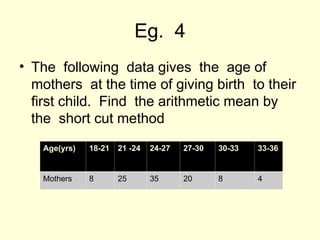
Central tendency
The property of concentration of the
values around a central value is
called central tendency
Desired qualities of a good measure
of central tendency.
»It should be based on all the values.
»It should not be affected too much by
abnormal extreme values.
»It should be rigidly defined.
»It should be capable of further algebric
treatment, so that it could be used in further
analysis.
»It should be easy to understand . its
computation procedure should be simple.
Different measures of central
tendency
1. Mean : 1. Arithmetic mean
2. Harmonic mean
3. Geometric mean
4. Weighted mean
2. Median :
3. Mode:
4. Quartiles:
5. Deciles
6. Percentiles
Arithmetic mean
• For ungrouped data
• Mean = ∑x /n = x1+x2+ x3+………+xn
• n
• For grouped data
• If the observations x1,x2,x3,.. .. . . . xn have frequencies
f1,f2,f3,…….fn then the arithmetic mean is
• --
• X = ( f1x1+f2x2+ f3x3+ . . . .+ f nxn) / (f1 +f2 + f3 +...+ fn)
• = ∑fx / ∑f
Arithmetic Mean
Properties
Properties of the Arithmetic MeanMean
 Every set of interval-level and ratio-level data has
a mean.
 All the values are included in computing the mean.
 A set of data has a unique mean.
 The mean is affected by unusually large or small
data values.
 The arithmetic mean is the only measure of
location where the sum of the deviations of each
value from the mean is zero.
Eg.1 Tuberculin test reaction measured
in millimeters of 10 boys is given below:
5, 7, 3, 7, 8, 10, 12, 11, 9, 8
Eg.2: The following data relates to the marks obtained
by students of a class in examination. Compute the mean.
Marks
0 --10 10 --
20
20 --30 30 --40 40 --50 50 --60 60 --70
Number of
students
4 6 10 45 20 12 3
Eg. 4
• The following data gives the age of
mothers at the time of giving birth to their
first child. Find the arithmetic mean by
the short cut method
Age(yrs) 18-21 21 -24 24-27 27-30 30-33 33-36
Mothers 8 25 35 20 8 4
The Median
Median is the
midpoint of the values after
they have been ordered from
the smallest to the largest.
There are as many values
above the median as
below it in the data array.
For an even set of values, the median will be the
arithmetic average of the two middle numbers and is
found at the (n+1)/2 ranked observation.
MEDIAN
• In the case of a continuous frequency distribution, ( i.e. for
grouped data) , the Median is
• M= l + {( N /2 – m) * c}/ f
• where l = lower limit of the median class
• N = total frequency
• f = frequency of the median class
• m = cumulative frequency prior to
the median class
• c = class interval
Properties of the Median
 There is a unique median for each data set.
 It is not affected by extremely large or small
values and is therefore a valuable measure of
location when such values occur.
 It can be computed for ratio-level, interval-level,
and ordinal-level data.
 It can be computed for an open-ended frequency
distribution if the median does not lie in an open-
ended class.
Eg.1 The following data relate to the number of
children to 25 couples. Find the Median
2 0 5 4 6
2 3 0 0 1
1 6 2 3 4
2 2 1 1 2
2 1 1 0 2
For the following frequency distribution , find the
Median
Percentage 0– 10 10 - 20 20– 30 30- 40 40- 50 50- 60 60 -70
Number of
students
4 9 19 20 18 7 3
MODE
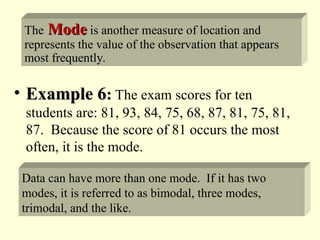
• Mode is the value which has the highest frequency
• In the case of a continuous frequency distribution, mode is
• M0 = l + [{(f- f1)* c} / (2f – f1 –f2)]
• where l = Lower limit of the modal class
• f = frequency of the modal class
• c = width of the modal class
• f1 = frequency of the class preceeding the
modal class
• f2 = frequency of the class succeeding the
modal class
• (Modal class - the class which has maximum frequency )
• Example 6
Example 6:
: The exam scores for ten
students are: 81, 93, 84, 75, 68, 87, 81, 75, 81,
87. Because the score of 81 occurs the most
often, it is the mode.
Data can have more than one mode. If it has two
modes, it is referred to as bimodal, three modes,
trimodal, and the like.
The Mode
Mode is another measure of location and
represents the value of the observation that appears
most frequently.
WHEN TO USE THE VARIOUS
AVERAGES?
• Arithmetic mean : 1. The average is required for deep statistical
analysis
• 2. The variable is continuous
• Median : 1. The variable is discrete
• 2. Some of the extreme values are missing.
• 3. If there are abnormal extreme values
• Mode : 1. Modal value has very high frequency
compared to other frequencies.
• 2. Some of the extreme values are missing
• 3. The variable is discrete
• 4. If there are abnormal extreme values

6Central tendency research methodology.ppt

  • 1.
    Central tendency The propertyof concentration of the values around a central value is called central tendency
  • 2.
    Desired qualities ofa good measure of central tendency. »It should be based on all the values. »It should not be affected too much by abnormal extreme values. »It should be rigidly defined. »It should be capable of further algebric treatment, so that it could be used in further analysis. »It should be easy to understand . its computation procedure should be simple.
  • 3.
    Different measures ofcentral tendency 1. Mean : 1. Arithmetic mean 2. Harmonic mean 3. Geometric mean 4. Weighted mean 2. Median : 3. Mode: 4. Quartiles: 5. Deciles 6. Percentiles
  • 4.
    Arithmetic mean • Forungrouped data • Mean = ∑x /n = x1+x2+ x3+………+xn • n • For grouped data • If the observations x1,x2,x3,.. .. . . . xn have frequencies f1,f2,f3,…….fn then the arithmetic mean is • -- • X = ( f1x1+f2x2+ f3x3+ . . . .+ f nxn) / (f1 +f2 + f3 +...+ fn) • = ∑fx / ∑f
  • 5.
    Arithmetic Mean Properties Properties ofthe Arithmetic MeanMean  Every set of interval-level and ratio-level data has a mean.  All the values are included in computing the mean.  A set of data has a unique mean.  The mean is affected by unusually large or small data values.  The arithmetic mean is the only measure of location where the sum of the deviations of each value from the mean is zero.
  • 6.
    Eg.1 Tuberculin testreaction measured in millimeters of 10 boys is given below: 5, 7, 3, 7, 8, 10, 12, 11, 9, 8 Eg.2: The following data relates to the marks obtained by students of a class in examination. Compute the mean. Marks 0 --10 10 -- 20 20 --30 30 --40 40 --50 50 --60 60 --70 Number of students 4 6 10 45 20 12 3
  • 7.
    Eg. 4 • Thefollowing data gives the age of mothers at the time of giving birth to their first child. Find the arithmetic mean by the short cut method Age(yrs) 18-21 21 -24 24-27 27-30 30-33 33-36 Mothers 8 25 35 20 8 4
  • 8.
    The Median Median isthe midpoint of the values after they have been ordered from the smallest to the largest. There are as many values above the median as below it in the data array. For an even set of values, the median will be the arithmetic average of the two middle numbers and is found at the (n+1)/2 ranked observation.
  • 9.
    MEDIAN • In thecase of a continuous frequency distribution, ( i.e. for grouped data) , the Median is • M= l + {( N /2 – m) * c}/ f • where l = lower limit of the median class • N = total frequency • f = frequency of the median class • m = cumulative frequency prior to the median class • c = class interval
  • 10.
    Properties of theMedian  There is a unique median for each data set.  It is not affected by extremely large or small values and is therefore a valuable measure of location when such values occur.  It can be computed for ratio-level, interval-level, and ordinal-level data.  It can be computed for an open-ended frequency distribution if the median does not lie in an open- ended class.
  • 11.
    Eg.1 The followingdata relate to the number of children to 25 couples. Find the Median 2 0 5 4 6 2 3 0 0 1 1 6 2 3 4 2 2 1 1 2 2 1 1 0 2
  • 12.
    For the followingfrequency distribution , find the Median Percentage 0– 10 10 - 20 20– 30 30- 40 40- 50 50- 60 60 -70 Number of students 4 9 19 20 18 7 3
  • 13.
    MODE • Mode isthe value which has the highest frequency • In the case of a continuous frequency distribution, mode is • M0 = l + [{(f- f1)* c} / (2f – f1 –f2)] • where l = Lower limit of the modal class • f = frequency of the modal class • c = width of the modal class • f1 = frequency of the class preceeding the modal class • f2 = frequency of the class succeeding the modal class • (Modal class - the class which has maximum frequency )
  • 14.
    • Example 6 Example6: : The exam scores for ten students are: 81, 93, 84, 75, 68, 87, 81, 75, 81, 87. Because the score of 81 occurs the most often, it is the mode. Data can have more than one mode. If it has two modes, it is referred to as bimodal, three modes, trimodal, and the like. The Mode Mode is another measure of location and represents the value of the observation that appears most frequently.
  • 15.
    WHEN TO USETHE VARIOUS AVERAGES? • Arithmetic mean : 1. The average is required for deep statistical analysis • 2. The variable is continuous • Median : 1. The variable is discrete • 2. Some of the extreme values are missing. • 3. If there are abnormal extreme values • Mode : 1. Modal value has very high frequency compared to other frequencies. • 2. Some of the extreme values are missing • 3. The variable is discrete • 4. If there are abnormal extreme values