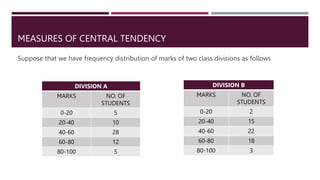
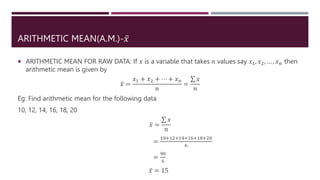
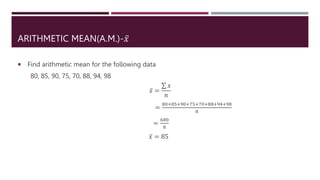
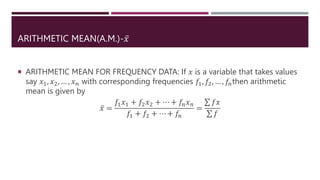
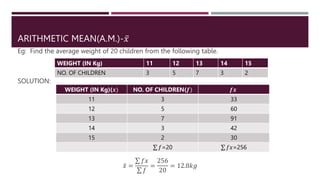
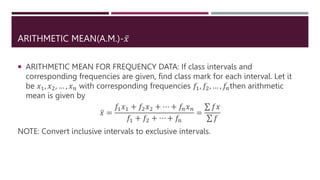
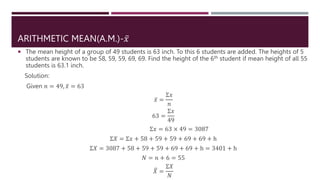
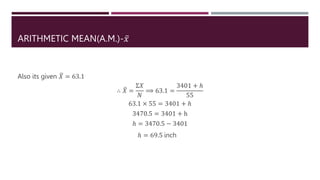
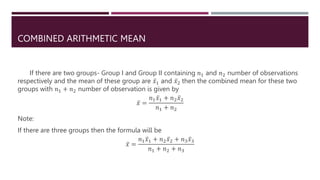
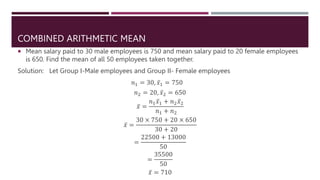
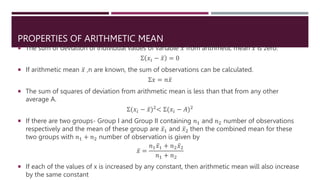
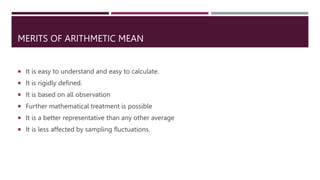
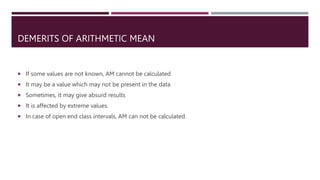
The document discusses measures of central tendency and arithmetic mean. It provides formulas to calculate the arithmetic mean for raw data, frequency data, and grouped frequency data. It includes examples such as finding the average marks of students, average weight of children, and average salary of employees. The arithmetic mean is used to solve problems involving changes to the original data or addition of new data points.
Average are generally the central part of the distribution and therefore they are also called as Measure of Central tendency. There are five types of measure of Central Tendency or averages .
Reference;Quantitative Apptitude by Dr P.N Arora,S.Arora
Wikipedia
Average are generally the central part of the distribution and therefore they are also called as Measure of Central tendency. There are five types of measure of Central Tendency or averages .
Reference;Quantitative Apptitude by Dr P.N Arora,S.Arora
Wikipedia
Measure of central tendency provides a very convenient way of describing a set of scores with a single number that describes the PERFORMANCE of the group.
It is also defined as a single value that is used to describe the “center” of the data.
The standard deviation is a measure of the spread of scores within a set of data. Usually, we are interested in the standard deviation of a population.
Measures of Central tendency-bio-statistics
Biostatistics and research methodology
Mean
Median
Mode
Mean- Arithmetic mean
weighted mean
harmonic mean
geometric mean
individual series
discrete series
continuous series
Relation between mean, median and mode
Statistical average
mathematical average
positional average
Merits and demerits of mean, median and mode
statistics
Bachelor of Pharmacy
8th Semester
Biostatistics
What is range and how to calculate it, quartile deviation,co-efficient of quartile deviation, arithmetic mean,mean deviation, variances and standard deviation.
STANDARD DEVIATION (2018) (STATISTICS)sumanmathews
THIS IS A QUICK AND EASY METHOD TO LEARN STANDARD DEVIATION FOR DISCRETE AND GROUPED FREQUENCY DISTRIBUTION.
IT GIVES A STEP BY STEP, SIMPLE EXPLANATION OF PROBLEMS WITH FORMULAE.
SO WATCH THE ENTIRE VIDEO TODAY.
in biostatistics, a measure of central tendency is a single value that describes a set of data by of typical value. it is also called as average. Arithmetic mean” or “mean” is the term used for average. The arithmetic mean or simply mean is the sum of the separate scores or measures divided by their number.
Similar to ARITHMETIC MEAN, MEASURES OF CENTRAL TENDENCY (20)
2024.06.01 Introducing a competency framework for languag learning materials ...Sandy Millin
http://sandymillin.wordpress.com/iateflwebinar2024
Published classroom materials form the basis of syllabuses, drive teacher professional development, and have a potentially huge influence on learners, teachers and education systems. All teachers also create their own materials, whether a few sentences on a blackboard, a highly-structured fully-realised online course, or anything in between. Despite this, the knowledge and skills needed to create effective language learning materials are rarely part of teacher training, and are mostly learnt by trial and error.
Knowledge and skills frameworks, generally called competency frameworks, for ELT teachers, trainers and managers have existed for a few years now. However, until I created one for my MA dissertation, there wasn’t one drawing together what we need to know and do to be able to effectively produce language learning materials.
This webinar will introduce you to my framework, highlighting the key competencies I identified from my research. It will also show how anybody involved in language teaching (any language, not just English!), teacher training, managing schools or developing language learning materials can benefit from using the framework.
Safalta Digital marketing institute in Noida, provide complete applications that encompass a huge range of virtual advertising and marketing additives, which includes search engine optimization, virtual communication advertising, pay-per-click on marketing, content material advertising, internet analytics, and greater. These university courses are designed for students who possess a comprehensive understanding of virtual marketing strategies and attributes.Safalta Digital Marketing Institute in Noida is a first choice for young individuals or students who are looking to start their careers in the field of digital advertising. The institute gives specialized courses designed and certification.
for beginners, providing thorough training in areas such as SEO, digital communication marketing, and PPC training in Noida. After finishing the program, students receive the certifications recognised by top different universitie, setting a strong foundation for a successful career in digital marketing.
Francesca Gottschalk - How can education support child empowerment.pptxEduSkills OECD
Francesca Gottschalk from the OECD’s Centre for Educational Research and Innovation presents at the Ask an Expert Webinar: How can education support child empowerment?
Normal Labour/ Stages of Labour/ Mechanism of LabourWasim Ak
Normal labor is also termed spontaneous labor, defined as the natural physiological process through which the fetus, placenta, and membranes are expelled from the uterus through the birth canal at term (37 to 42 weeks
A Strategic Approach: GenAI in EducationPeter Windle
Artificial Intelligence (AI) technologies such as Generative AI, Image Generators and Large Language Models have had a dramatic impact on teaching, learning and assessment over the past 18 months. The most immediate threat AI posed was to Academic Integrity with Higher Education Institutes (HEIs) focusing their efforts on combating the use of GenAI in assessment. Guidelines were developed for staff and students, policies put in place too. Innovative educators have forged paths in the use of Generative AI for teaching, learning and assessments leading to pockets of transformation springing up across HEIs, often with little or no top-down guidance, support or direction.
This Gasta posits a strategic approach to integrating AI into HEIs to prepare staff, students and the curriculum for an evolving world and workplace. We will highlight the advantages of working with these technologies beyond the realm of teaching, learning and assessment by considering prompt engineering skills, industry impact, curriculum changes, and the need for staff upskilling. In contrast, not engaging strategically with Generative AI poses risks, including falling behind peers, missed opportunities and failing to ensure our graduates remain employable. The rapid evolution of AI technologies necessitates a proactive and strategic approach if we are to remain relevant.
Read| The latest issue of The Challenger is here! We are thrilled to announce that our school paper has qualified for the NATIONAL SCHOOLS PRESS CONFERENCE (NSPC) 2024. Thank you for your unwavering support and trust. Dive into the stories that made us stand out!
Unit 8 - Information and Communication Technology (Paper I).pdfThiyagu K
This slides describes the basic concepts of ICT, basics of Email, Emerging Technology and Digital Initiatives in Education. This presentations aligns with the UGC Paper I syllabus.
June 3, 2024 Anti-Semitism Letter Sent to MIT President Kornbluth and MIT Cor...Levi Shapiro
Letter from the Congress of the United States regarding Anti-Semitism sent June 3rd to MIT President Sally Kornbluth, MIT Corp Chair, Mark Gorenberg
Dear Dr. Kornbluth and Mr. Gorenberg,
The US House of Representatives is deeply concerned by ongoing and pervasive acts of antisemitic
harassment and intimidation at the Massachusetts Institute of Technology (MIT). Failing to act decisively to ensure a safe learning environment for all students would be a grave dereliction of your responsibilities as President of MIT and Chair of the MIT Corporation.
This Congress will not stand idly by and allow an environment hostile to Jewish students to persist. The House believes that your institution is in violation of Title VI of the Civil Rights Act, and the inability or
unwillingness to rectify this violation through action requires accountability.
Postsecondary education is a unique opportunity for students to learn and have their ideas and beliefs challenged. However, universities receiving hundreds of millions of federal funds annually have denied
students that opportunity and have been hijacked to become venues for the promotion of terrorism, antisemitic harassment and intimidation, unlawful encampments, and in some cases, assaults and riots.
The House of Representatives will not countenance the use of federal funds to indoctrinate students into hateful, antisemitic, anti-American supporters of terrorism. Investigations into campus antisemitism by the Committee on Education and the Workforce and the Committee on Ways and Means have been expanded into a Congress-wide probe across all relevant jurisdictions to address this national crisis. The undersigned Committees will conduct oversight into the use of federal funds at MIT and its learning environment under authorities granted to each Committee.
• The Committee on Education and the Workforce has been investigating your institution since December 7, 2023. The Committee has broad jurisdiction over postsecondary education, including its compliance with Title VI of the Civil Rights Act, campus safety concerns over disruptions to the learning environment, and the awarding of federal student aid under the Higher Education Act.
• The Committee on Oversight and Accountability is investigating the sources of funding and other support flowing to groups espousing pro-Hamas propaganda and engaged in antisemitic harassment and intimidation of students. The Committee on Oversight and Accountability is the principal oversight committee of the US House of Representatives and has broad authority to investigate “any matter” at “any time” under House Rule X.
• The Committee on Ways and Means has been investigating several universities since November 15, 2023, when the Committee held a hearing entitled From Ivory Towers to Dark Corners: Investigating the Nexus Between Antisemitism, Tax-Exempt Universities, and Terror Financing. The Committee followed the hearing with letters to those institutions on January 10, 202
How to Make a Field invisible in Odoo 17Celine George
It is possible to hide or invisible some fields in odoo. Commonly using “invisible” attribute in the field definition to invisible the fields. This slide will show how to make a field invisible in odoo 17.
2. MEASURES OF CENTRAL TENDENCY
Suppose that we have frequency distribution of marks of two class divisions as follows
DIVISION A
MARKS NO. OF
STUDENTS
0-20 5
20-40 10
40-60 28
60-80 12
80-100 5
DIVISION B
MARKS NO. OF
STUDENTS
0-20 2
20-40 15
40-60 22
60-80 18
80-100 3
3. MEASURES OF CENTRAL TENDENCY
AVERAGES: They are typical values with in the range of data. These values generally lie in the
center part of the distribution, individual values of the variable usually cluster around it. So
averages are called as measures of central tendency.
TYPES OF AVERAGES: Averages are classified as two
(i) MATHEMATICAL AVERAGES: They are computed averages. They are based on all the
observations. Eg: Arithmetic mean, Geometric mean, Harmonic mean
(ii) POSITIONAL AVERAGES: These are positional values. These averages are not based on all
observations
Eg: Median, Mode
4. ARITHMETIC MEAN(A.M.)-𝑥
ARITHMETIC MEAN FOR RAW DATA: If 𝑥 is a variable that takes 𝑛 values say 𝑥1, 𝑥2, … , 𝑥𝑛 then
arithmetic mean is given by
𝑥 =
𝑥1 + 𝑥2 + ⋯ + 𝑥𝑛
𝑛
=
𝑥
𝑛
Eg: Find arithmetic mean for the following data
10, 12, 14, 16, 18, 20
𝑥 =
𝑥
𝑛
=
10+12+14+16+18+20
6
=
90
6
𝑥 = 15
5. ARITHMETIC MEAN(A.M.)-𝑥
Find arithmetic mean for the following data
80, 85, 90, 75, 70, 88, 94, 98
𝑥 =
𝑥
𝑛
=
80+85+90+75+70+88+94+98
8
=
680
8
𝑥 = 85
6. ARITHMETIC MEAN(A.M.)-𝑥
ARITHMETIC MEAN FOR FREQUENCY DATA: If 𝑥 is a variable that takes values
say 𝑥1, 𝑥2, … , 𝑥𝑛 with corresponding frequencies 𝑓1, 𝑓2, … , 𝑓𝑛then arithmetic
mean is given by
𝑥 =
𝑓1𝑥1 + 𝑓2𝑥2 + ⋯ + 𝑓𝑛𝑥𝑛
𝑓1 + 𝑓2 + ⋯ + 𝑓𝑛
=
𝑓𝑥
𝑓
7. ARITHMETIC MEAN(A.M.)-𝑥
Eg: Find the average weight of 20 children from the following table.
SOLUTION:
𝑥 =
𝑓𝑥
𝑓
=
256
20
= 12.8𝑘𝑔
WEIGHT (IN Kg) 11 12 13 14 15
NO. OF CHILDREN 3 5 7 3 2
WEIGHT (IN Kg)(𝒙) NO. OF CHILDREN(𝒇) 𝒇𝒙
11 3 33
12 5 60
13 7 91
14 3 42
15 2 30
𝑓=20 𝑓𝑥=256
8. ARITHMETIC MEAN(A.M.)-𝑥
Eg: Find the average height of students from the following table.
SOLUTION:
𝑥 =
𝑓𝑥
𝑓
=
3771
23
= 163.956𝑐𝑚
HEIGHT (IN cm) 159 162 164 166 170
NO. OF STUDENTS 3 5 7 6 2
HEIGHT (IN cm)(𝒙) NO. OF CHILDREN(𝒇) 𝒇𝒙
159 3 477
162 5 810
164 7 1148
166 6 996
170 2 340
𝑓=23 𝑓𝑥=3771
9. ARITHMETIC MEAN(A.M.)-𝑥
ARITHMETIC MEAN FOR FREQUENCY DATA: If class intervals and
corresponding frequencies are given, find class mark for each interval. Let it
be 𝑥1, 𝑥2, … , 𝑥𝑛 with corresponding frequencies 𝑓1, 𝑓2, … , 𝑓𝑛then arithmetic
mean is given by
𝑥 =
𝑓1𝑥1 + 𝑓2𝑥2 + ⋯ + 𝑓𝑛𝑥𝑛
𝑓1 + 𝑓2 + ⋯ + 𝑓𝑛
=
𝑓𝑥
𝑓
NOTE: Convert inclusive intervals to exclusive intervals.
10. ARITHMETIC MEAN(A.M.)-𝑥
Eg: Find the A.M. for the following data.
SOLUTION:
𝑥 =
𝑓𝑥
𝑓
=
1240
50
= 24.8
Class intervals 0-10 10-20 20-30 30-40 40-50
Frequency 7 11 15 10 7
Class intervals Class mark(x) Frequency(f) 𝒇𝒙
0-10 5 7 35
10-20 15 11 165
20-30 25 15 375
30-40 35 10 350
40-50 45 7 315
𝑓=50 𝑓𝑥=1240
11. ARITHMETIC MEAN(A.M.)-𝑥
Eg: Find the A.M. for the following data.
SOLUTION:
Lower limit of successive class – Upper limit of previous
class
Correction factor(C.F.)=
2
Here CF=
20−19
2
= 0.5
New class intervals will be (l.l –C.F)-(u.l+ C.F)
Class intervals 10-19 20- 30-39 40-49 50-59 60-69 70-79
Frequency 6 5 8 15 7 6 3
13. ARITHMETIC MEAN(A.M.)-𝑥
Eg: Find the A.M. for the following data representing daily wages of a group of employees. Given minimum salary is
700.
SOLUTION:
𝑥 =
𝑓𝑥
𝑓
=
136500
150
= 910
Salary <800 <900 <1000 <1100 <1200
No. of people 30 70 120 140 150
Class intervals Class mark(x) Frequency(f) 𝒇𝒙
700-800 750 30 22500
800-900 850 40 34000
900-1000 950 50 47500
1000-1100 1050 20 21000
1100-1200 1150 10 11500
𝑓=150 𝑓𝑥=136500
14. ARITHMETIC MEAN(A.M.)-𝑥
Eg: Following data gives the consumption of electricity. Find average consumption.
SOLUTION:
𝑓 = 170
𝑓𝑥 = 136408
𝑥 =
𝑓𝑥
𝑓
=
136408
170
= 802.4
Units <200 <400 <600 <80 <100 <1200 <140 <160
No. of consumers 7 25 53 88 118 142 160 170
15. ARITHMETIC MEAN(A.M.)-𝑥
Find the missing frequency in the following data given that A.M is 31.
Solution: Let the missing frequency be k.
Marks 0-10 10-20 20-30 30-40 40-50 50-60
No. of students 5 10 - 35 15 5
Marks No. of Class mark(x) 𝒇𝒙
0-10 5 5 25
10-20 10 15 150
20-30 k 25 25k
30-40 35 35 1225
40-50 15 45 675
50-60 5 55 275
Σ𝑓 = 70 + 𝑘 Σ𝑓𝑥 = 2350 + 25𝑘
16. ARITHMETIC MEAN(A.M.)-𝑥
We know 𝑥 =
𝑓𝑥
𝑓
And it is given that A.M for the data is 31.
Substituting all values, we get, 31 =
2350+25𝑘
70+𝑘
31 70 + 𝑘 = 2350 + 25𝑘
2170 + 31𝑘 = 2350 + 25𝑘
31𝑘 − 25𝑘 = 2350 − 2170
6𝑘 = 180
𝑘 =
180
6
𝑘 = 30
17. ARITHMETIC MEAN(A.M.)-𝑥
Calculate the missing frequency in the following data given that A.M is 28.
Solution: Let the missing frequency be k.
Marks 0-10 10-20 20-30 30-40 40-50 50-60
No. of students 12 18 27 - 17 6
Marks No. of Class mark(x) 𝒇𝒙
0-10 12 5 60
10-20 18 15 270
20-30 27 25 675
30-40 k 35 35k
40-50 17 45 765
50-60 6 55 330
Σ𝑓 = 80 + 𝑘 Σ𝑓𝑥 = 2100 + 35𝑘
18. ARITHMETIC MEAN(A.M.)-𝑥
We know 𝑥 =
𝑓𝑥
𝑓
And it is given that A.M for the data is 28.
Substituting all values, we get, 28 =
2100+35𝑘
80+𝑘
28 80 + 𝑘 = 2100 + 35𝑘
2240 + 28𝑘 = 2100 + 35𝑘
35𝑘 − 28𝑘 = 2240 − 2100
7𝑘 = 140
𝑘 =
140
7
𝑘 = 20
19. ARITHMETIC MEAN(A.M.)-𝑥
Mean of 200 observations was 50. Later on it was discovered that one observation was
wrongly noted as 92 instead of 192. Find the correct mean.
Solution: Given 𝑛 = 200, 𝑥 = 50
𝑥 =
Σ𝑥
𝑛
50 =
Σ𝑥
200
Σ𝑥 = 50 × 200 = 10000
Σ𝑋 = 10000 − 92 + 192 = 10100
𝑋 =
Σ𝑋
𝑁
𝑋 =
10100
200
∴ 𝑋 = 50.5
20. ARITHMETIC MEAN(A.M.)-𝑥
Mean of 20 observations was 44. Later on it was discovered that two observations was
wrongly noted as 17, 40 instead of 70, 14. Find the correct mean.
Solution: Given 𝑛 = 20, 𝑥 = 44
𝑥 =
Σ𝑥
𝑛
44 =
Σ𝑥
20
Σ𝑥 = 44 × 20 = 880
Σ𝑋 = 880 − 17 − 40 + 70 + 14 = 907
𝑋 =
Σ𝑋
𝑁
𝑋 =
907
20
∴ 𝑋 = 45.35
21. ARITHMETIC MEAN(A.M.)-𝑥
The mean of a certain number of observations is 40. if two more items with values 50 & 64 are
added to the data the mean rises to 42. Find the number of observations in the original data.
Solution:
Given 𝑥 = 40
𝑥 =
Σ𝑥
𝑛
40 =
Σ𝑥
𝑛
Σ𝑥 = 40𝑛
Σ𝑋 = Σ𝑥 + 50 + 64 = 40n + 114
𝑁 = 𝑛 + 2
𝑋 =
Σ𝑋
𝑁
42 =
40𝑛 + 114
𝑛 + 2
23. ARITHMETIC MEAN(A.M.)-𝑥
The mean height of a group of 49 students is 63 inch. To this 6 students are added. The heights of 5
students are known to be 58, 59, 59, 69, 69. Find the height of the 6th student if mean height of all 55
students is 63.1 inch.
Solution:
Given 𝑛 = 49, 𝑥 = 63
𝑥 =
Σ𝑥
𝑛
63 =
Σ𝑥
49
Σ𝑥 = 63 × 49 = 3087
Σ𝑋 = Σ𝑥 + 58 + 59 + 59 + 69 + 69 + h
Σ𝑋 = 3087 + 58 + 59 + 59 + 69 + 69 + h = 3401 + h
𝑁 = 𝑛 + 6 = 55
𝑋 =
Σ𝑋
𝑁
24. ARITHMETIC MEAN(A.M.)-𝑥
Also its given 𝑋 = 63.1
∴ 𝑋 =
Σ𝑋
𝑁
⟹ 63.1 =
3401 + ℎ
55
63.1 × 55 = 3401 + ℎ
3470.5 = 3401 + h
ℎ = 3470.5 − 3401
ℎ = 69.5 inch
25. COMBINED ARITHMETIC MEAN
If there are two groups- Group I and Group II containing 𝑛1 and 𝑛2 number of observations
respectively and the mean of these group are 𝑥1 and 𝑥2 then the combined mean for these two
groups with 𝑛1 + 𝑛2 number of observation is given by
𝑥 =
𝑛1𝑥1 + 𝑛2𝑥2
𝑛1 + 𝑛2
Note:
If there are three groups then the formula will be
𝑥 =
𝑛1𝑥1 + 𝑛2𝑥2 + 𝑛3𝑥3
𝑛1 + 𝑛2 + 𝑛3
26. COMBINED ARITHMETIC MEAN
Mean salary paid to 30 male employees is 750 and mean salary paid to 20 female employees
is 650. Find the mean of all 50 employees taken together.
Solution: Let Group I-Male employees and Group II- Female employees
𝑛1 = 30, 𝑥1 = 750
𝑛2 = 20, 𝑥2 = 650
𝑥 =
𝑛1𝑥1 + 𝑛2𝑥2
𝑛1 + 𝑛2
𝑥 =
30 × 750 + 20 × 650
30 + 20
=
22500 + 13000
50
=
35500
50
𝑥 = 710
27. COMBINED ARITHMETIC MEAN
The average marks in Accountancy of 45 boys and 70 girls from a class are 55 and 63
respectively. Find the average marks of entire class.
Solution: Let Group I- Boys and Group II- Girls
𝑛1 = 45, 𝑥1 = 55
𝑛2 = 70, 𝑥2 = 63
𝑥 =
𝑛1𝑥1 + 𝑛2𝑥2
𝑛1 + 𝑛2
𝑥 =
45 × 55 + 70 × 63
45 + 70
=
2475 + 4410
115
=
6885
115
𝑥 = 59.87
28. COMBINED ARITHMETIC MEAN
The average marks of a class of students are 76. The average marks of boys and girls are 69
and 83 respectively. If there are 75 boys, find the number of girls.
Solution: Let Group I- Boys and Group II- Girls
Given 𝑥 = 76
𝑛1 = 75, 𝑥1 = 69
𝑛2 = 𝑘, 𝑥2 = 83
𝑥 =
𝑛1𝑥1 + 𝑛2𝑥2
𝑛1 + 𝑛2
76 =
75 × 69 + 𝑘 × 83
75 + 𝑘
76 =
5175 + 83𝑘
75 + 𝑘
30. COMBINED ARITHMETIC MEAN
The average weight of 500 articles manufactured in a factory is 34gm. Out of these, average
weight of 30 defective articles is 25gm. Find the average weight of non defective articles.
Solution: Let Group I- Defective articles and Group II- Non-defective articles
Given 𝑥 = 34, 𝑛1 + 𝑛2 = 500
𝑛1 = 30, 𝑥1 = 25
𝑛2 = 500 − 30 = 470, 𝑥2 = 𝑘
𝑥 =
𝑛1𝑥1 + 𝑛2𝑥2
𝑛1 + 𝑛2
34 =
30 × 25 + 470 × 𝑘
500
34 =
750 + 470𝑘
500
31. COMBINED ARITHMETIC MEAN
34 × 500 = 750 + 470𝑘
470𝑘 = 17000 − 750
470𝑘 = 16250
𝑘 =
16250
470
𝑘 = 34.57
∴ Average weight of non defective articles =34.57gm
32. COMBINED ARITHMETIC MEAN
The average weight of 500 students of FYBCom is 57kg. The average weight of 475 SYBCom
students is 61kg. and 525 TYBCom students are 59kg. Find the average weight of all students
together.
Solution:
𝑛1 = 500, 𝑥1 = 57
𝑛2 = 475, 𝑥2 = 61
𝑛3 = 525, 𝑥3 = 59
𝑥 =
𝑛1𝑥1 + 𝑛2𝑥2 + 𝑛3𝑥3
𝑛1 + 𝑛2 + 𝑛3
𝑥 =
500 × 57 + 475 × 61 + 525 × 59
500 + 475 + 525
𝑥 =
88450
1500
𝑥 = 58.97kg
33. WEIGHTED ARITHMETIC MEAN
If 𝑛 values 𝑥1, 𝑥2, … , 𝑥𝑛 of the variable 𝑥 are assigned the weights 𝑤1, 𝑤2, … , 𝑤𝑛 respectively
then weighted A.M is defined as
𝑥 =
𝑤1𝑥1 + 𝑤2𝑥2 + ⋯ + 𝑤𝑛𝑥𝑛
𝑤1 + 𝑤2 + ⋯ + 𝑤𝑛
=
𝑤𝑥
𝑤
34. WEIGHTED ARITHMETIC MEAN
A candidate appeared for an examination and scored following marks
Physics-45, Chemistry-52, Maths-40, English-55.
It was considered that weight should be given as 3,2,3,2 respectively. Calculate weighted
arithmetic mean.
Solution:
𝑥 =
𝑤𝑥
𝑤
=
469
10
= 46.9
SUBJECT MARKS(x) WEIGHT(w) 𝒘𝒙
Physics 45 3 135
Chemistry 52 2 104
Maths 40 3 120
English 55 2 110
Σ𝑤 = 10 Σ𝑤𝑥 = 469
35. WEIGHTED ARITHMETIC MEAN
A student X scores 50,55,60 and 45 in four subjects. Another student Y scores 53, 50, 47 and 59 in the
same subjects. If the weights are 2, 4, 3 and 1 respectively for these subjects, decide which student
performed better?
Solution:
𝑥 =
𝑤𝑥
𝑤
=
545
10
= 54.5
𝑦 =
𝑤𝑦
𝑤
=
506
10
= 50.6
∴X performed better
SUBJECT MARKS (x) MARKS
(y)
WEIGHTS
(w)
𝒘𝒙 𝒘𝒚
1 50 53 2 100 106
2 55 50 4 220 200
3 60 47 3 180 141
4 45 59 1 45 59
Σ𝑤 = 10 Σ𝑤𝑥 = 545 Σ𝑤𝑦 = 506
36. PROPERTIES OF ARITHMETIC MEAN
The sum of deviation of individual values of variable 𝑥 from arithmetic mean 𝑥 is zero.
Σ 𝑥𝑖 − 𝑥 = 0
If arithmetic mean 𝑥 ,n are known, the sum of observations can be calculated.
Σ𝑥 = 𝑛𝑥
The sum of squares of deviation from arithmetic mean is less than that from any other
average A.
Σ(𝑥𝑖 − 𝑥)2< Σ(𝑥𝑖 − 𝐴)2
If there are two groups- Group I and Group II containing 𝑛1 and 𝑛2 number of observations
respectively and the mean of these group are 𝑥1 and 𝑥2 then the combined mean for these
two groups with 𝑛1 + 𝑛2 number of observation is given by
𝑥 =
𝑛1𝑥1 + 𝑛2𝑥2
𝑛1 + 𝑛2
If each of the values of x is increased by any constant, then arithmetic mean will also increase
by the same constant
37. MERITS OF ARITHMETIC MEAN
It is easy to understand and easy to calculate.
It is rigidly defined.
It is based on all observation
Further mathematical treatment is possible
It is a better representative than any other average
It is less affected by sampling fluctuations.
38. DEMERITS OF ARITHMETIC MEAN
If some values are not known, AM cannot be calculated
It may be a value which may not be present in the data
Sometimes, it may give absurd results
It is affected by extreme values.
In case of open end class intervals, AM can not be calculated.