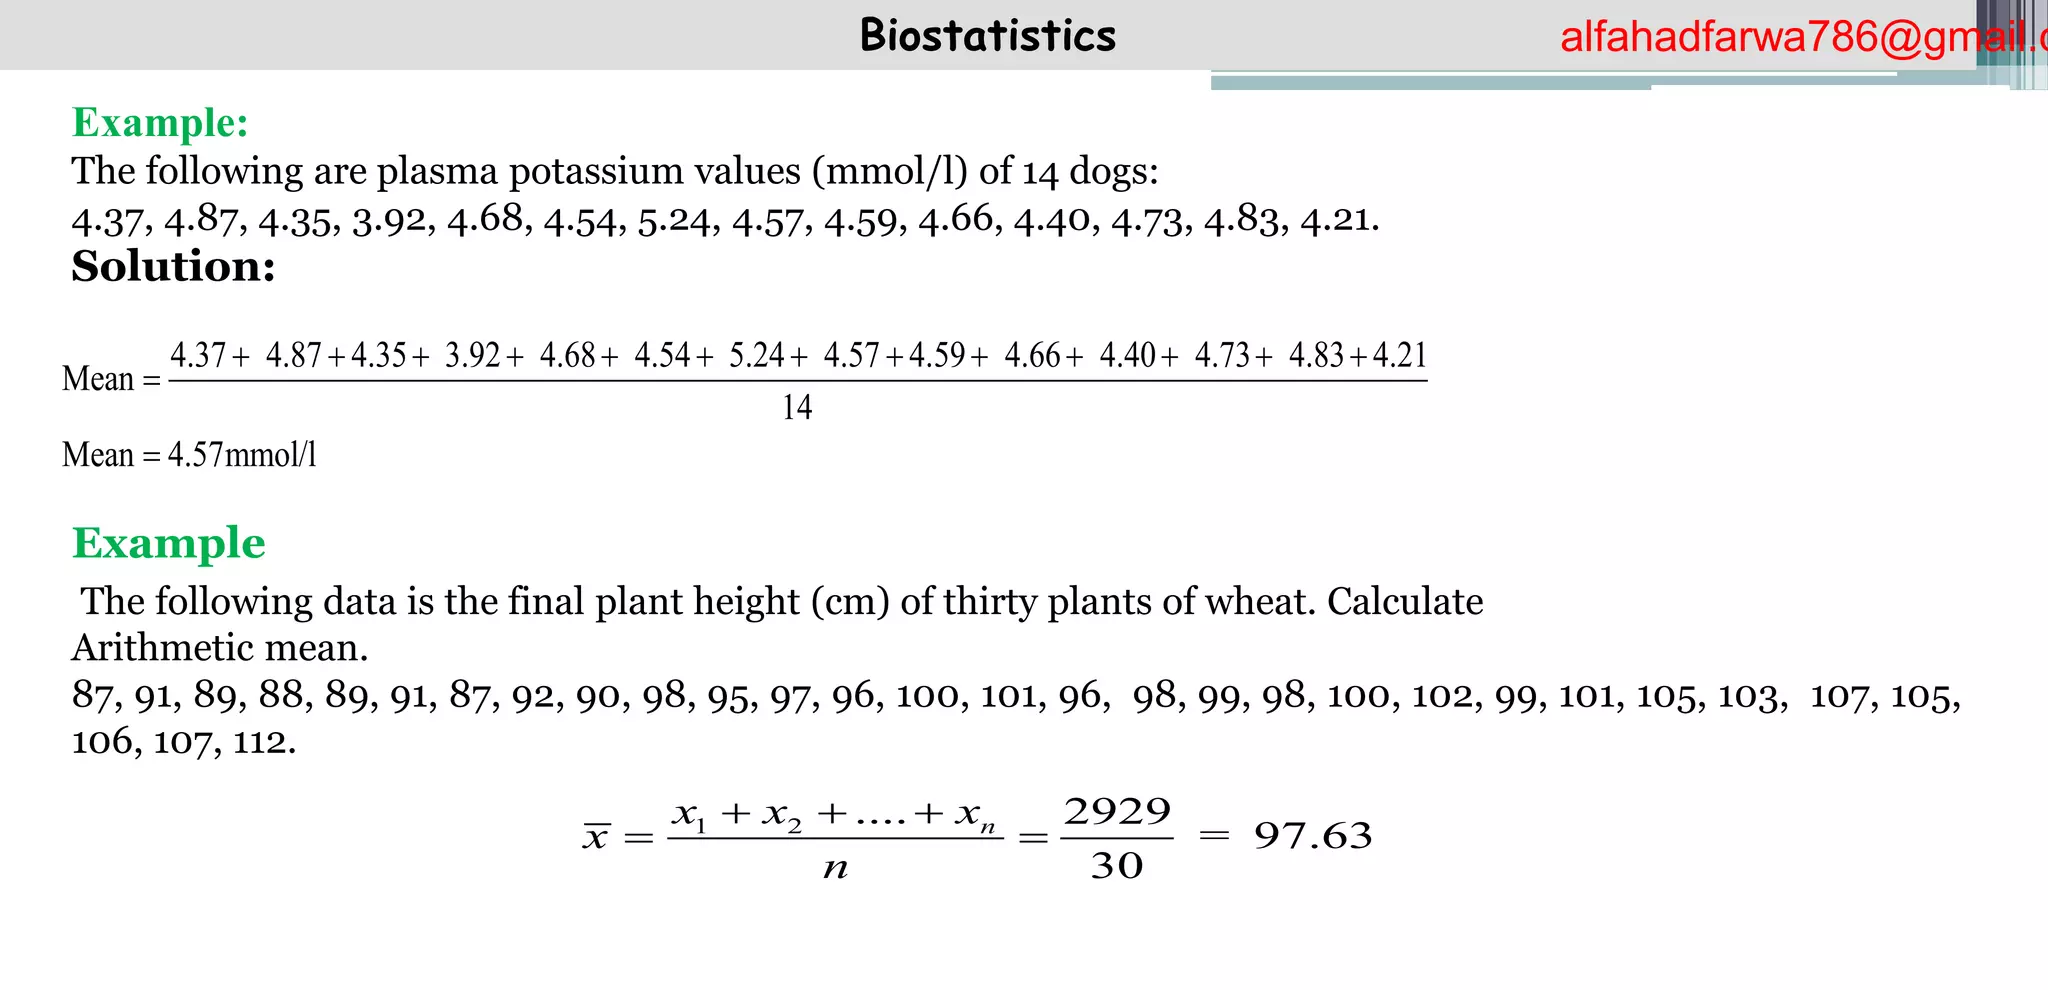
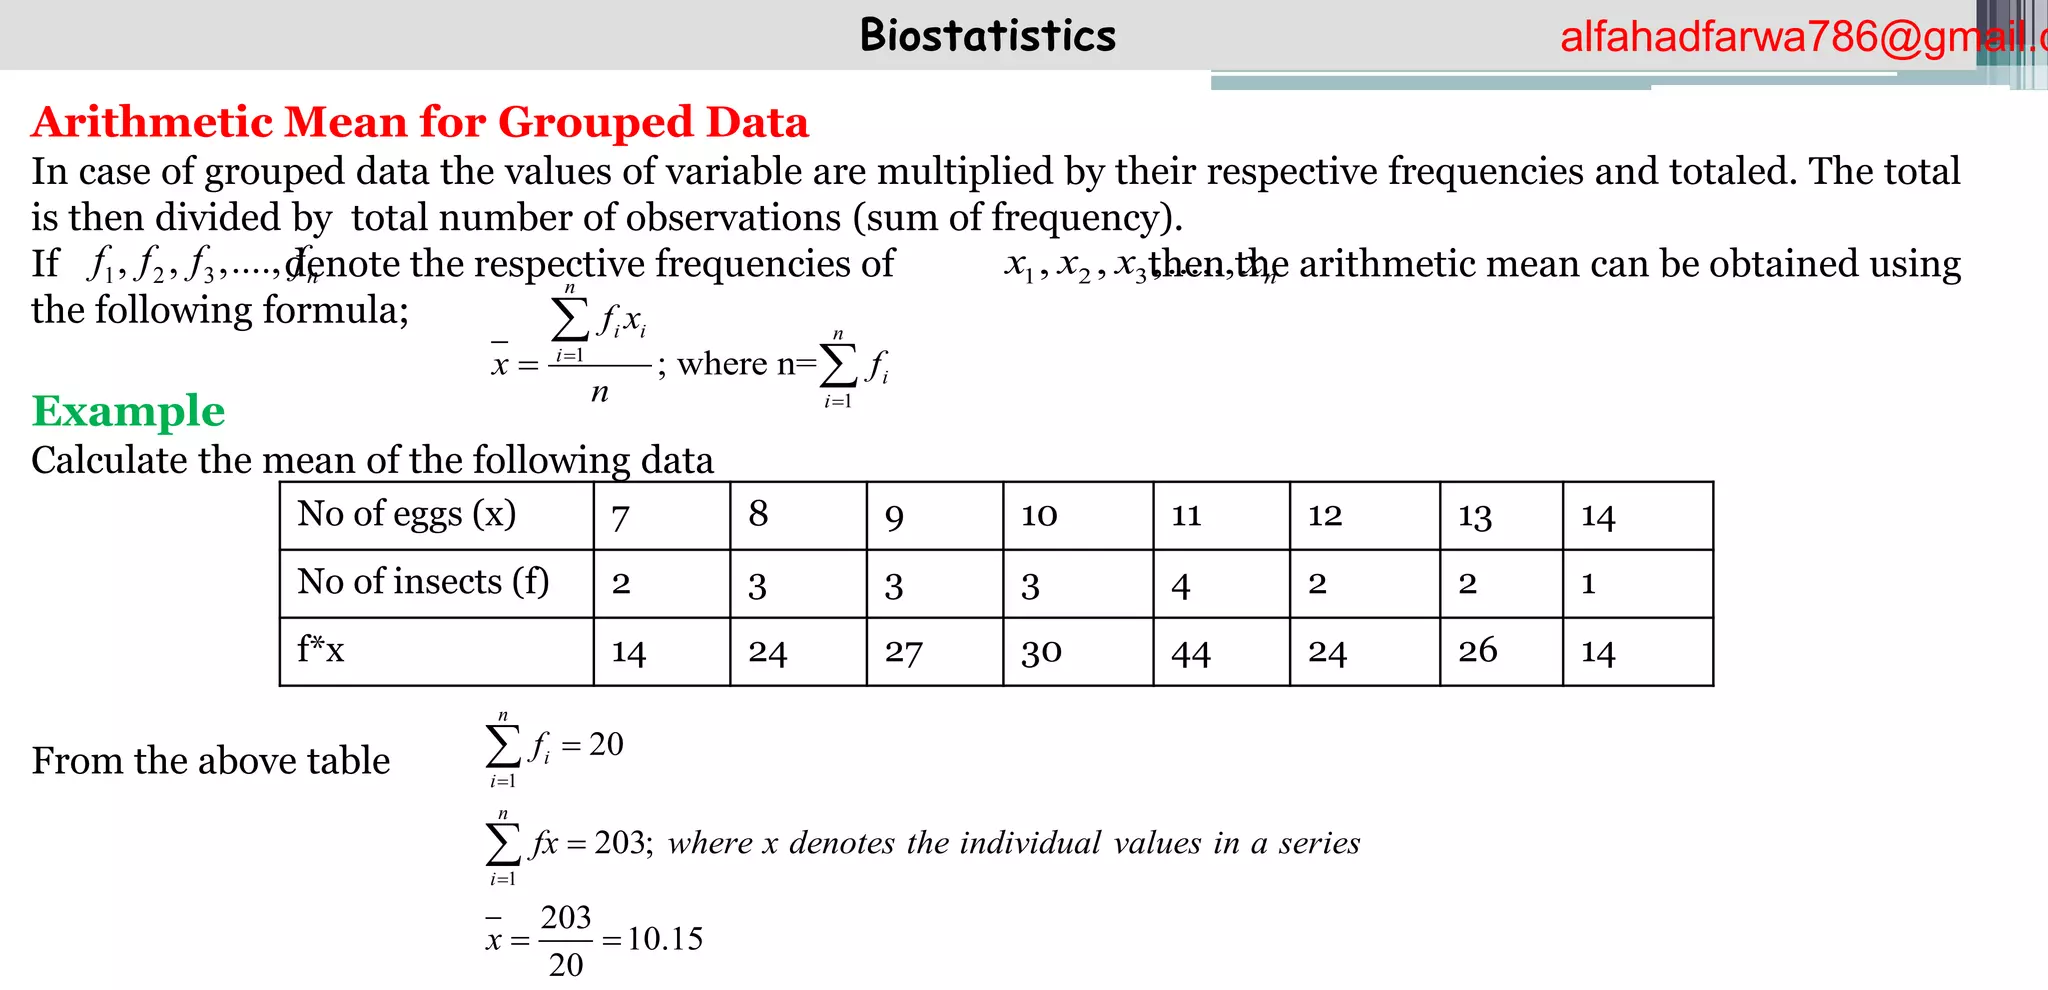
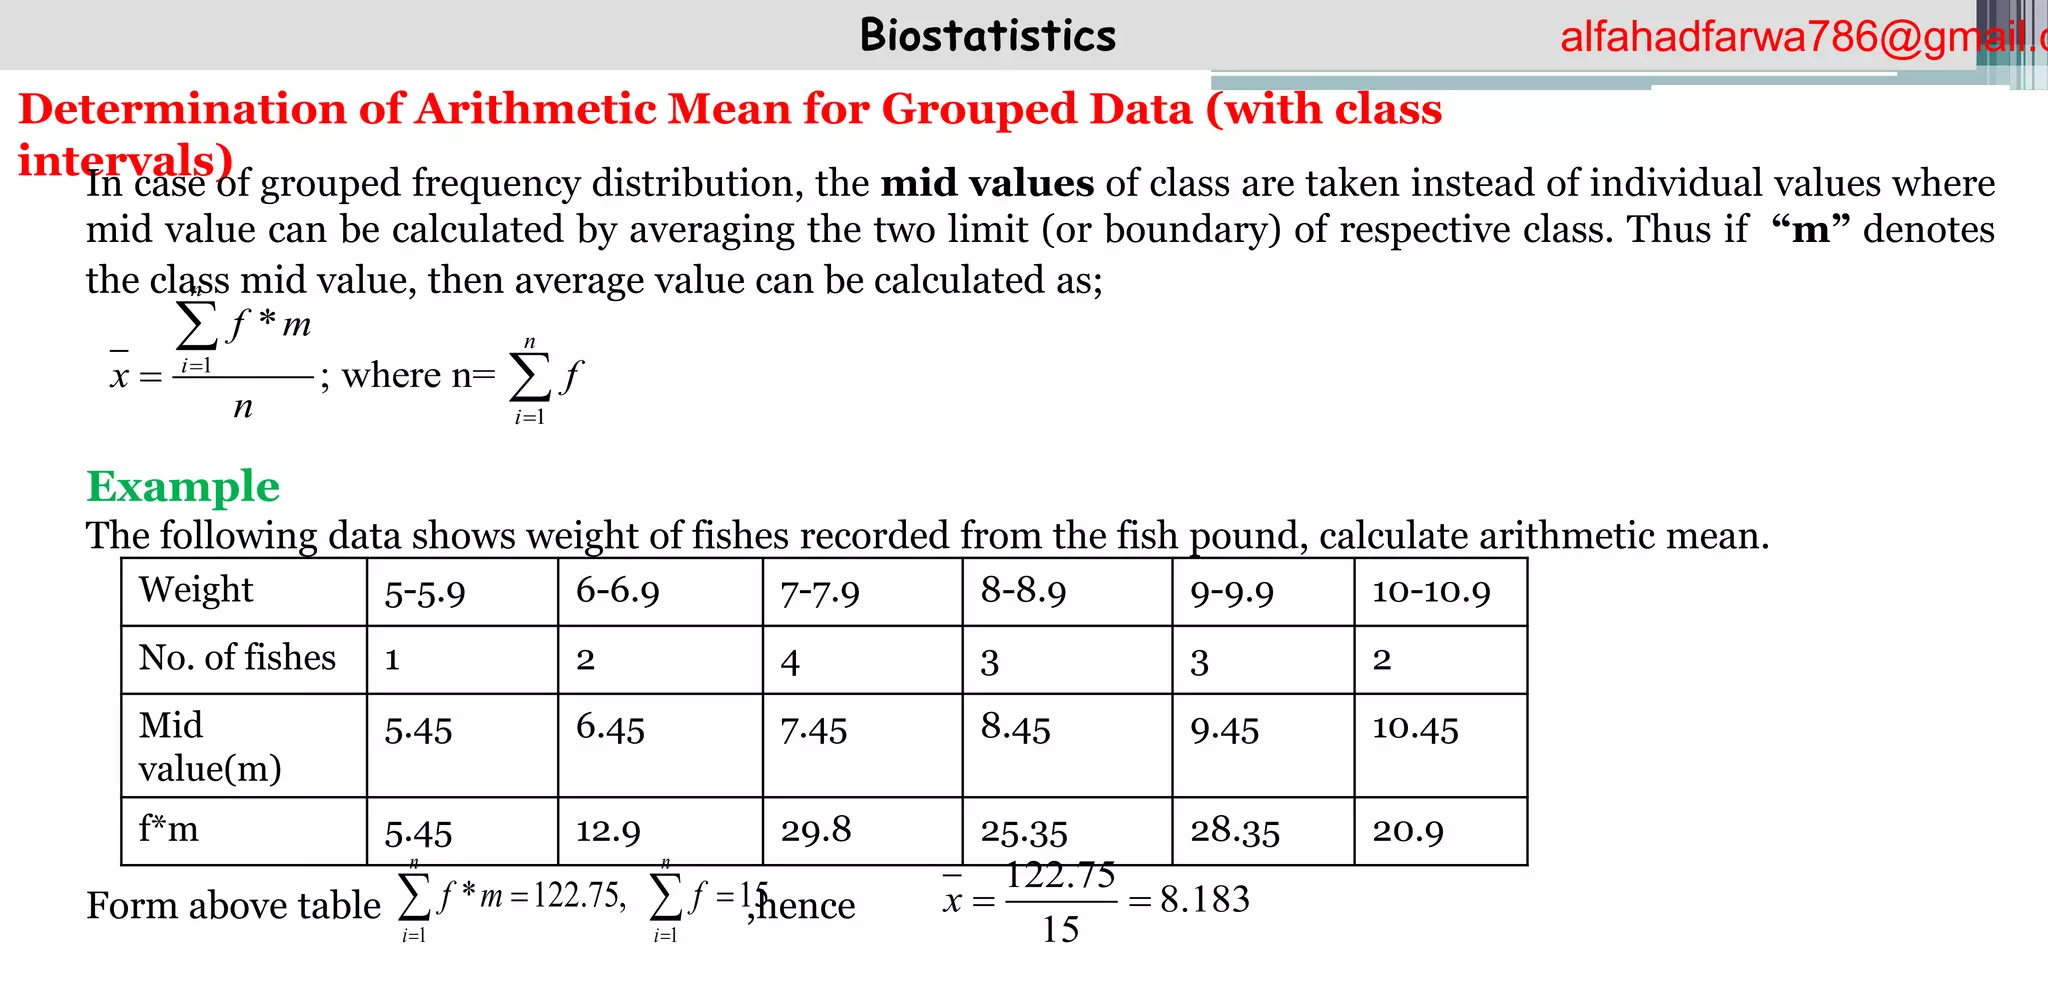
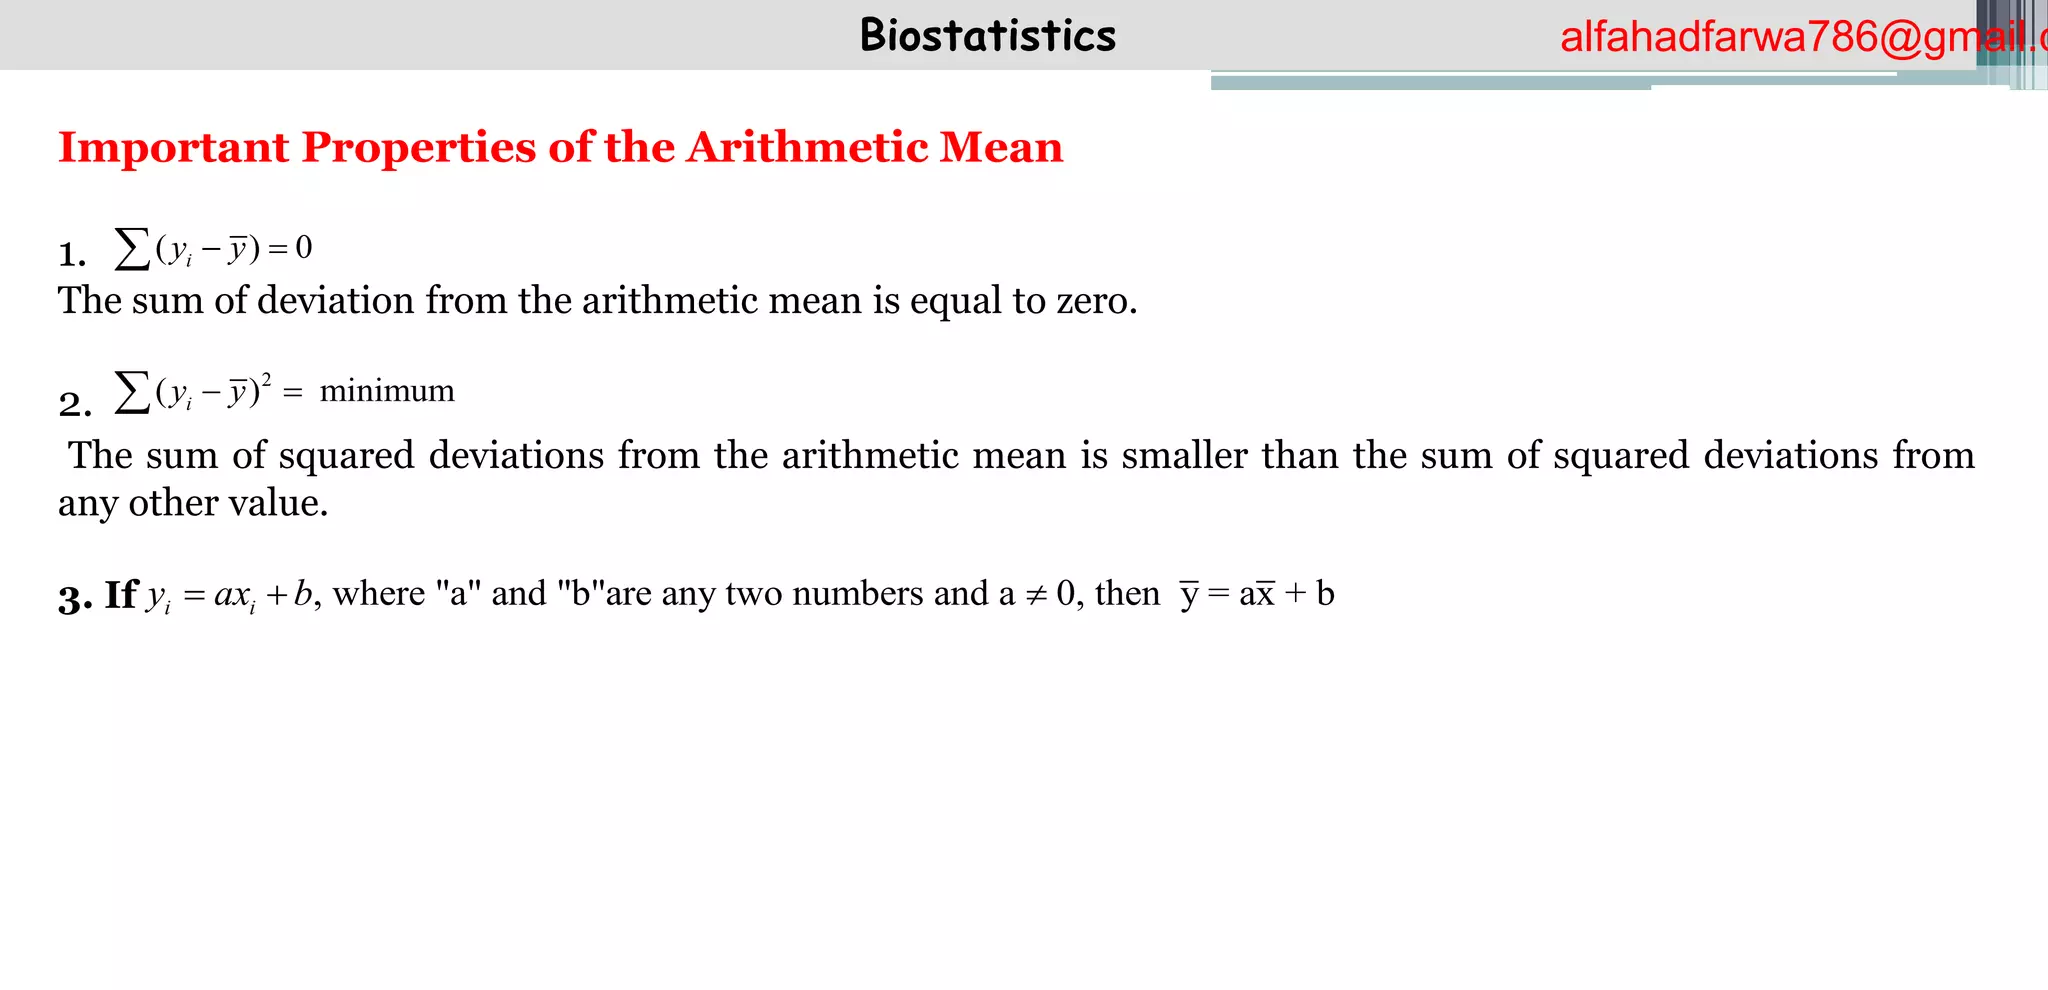
Biostatistics
Lecture N0 07
alfahadfarwa786@gmail.c
Muhammad Alfahad
Farfwa Butt
Biostatistics
Arithmetic Mean (AM)
Arithmetic mean of a series is obtained by dividing total of values in series by the number of items i.e.
Arithmetic mean is denoted by .
Determination of Arithmetic Mean for Ungrouped Data
Let be the “n” values of variable , then the arithmetic mean can be obtained by using the
following formula:
1 2 3
, , ,......., n
x x x x X
1 2 3
1
1
[ ..... ]
1
, where is arithmetic mean, = summation symbol
n
n
i
i
x x x x x
n
x x
n 
    
  

sum of all values
Mean=
total number of values
x
alfahadfarwa786@gmail.c
Biostatistics
Example:
The following are plasma potassium values (mmol/l) of 14 dogs:
4.37, 4.87, 4.35, 3.92, 4.68, 4.54, 5.24, 4.57, 4.59, 4.66, 4.40, 4.73, 4.83, 4.21.
Solution:
Example
The following data is the final plant height (cm) of thirty plants of wheat. Calculate
Arithmetic mean.
87, 91, 89, 88, 89, 91, 87, 92, 90, 98, 95, 97, 96, 100, 101, 96, 98, 99, 98, 100, 102, 99, 101, 105, 103, 107, 105,
106, 107, 112.
Mean
14
Mean 4.57mmol/l
4.37 4.87 4.35 3.92 4.68 4.54 5.24 4.57 4.59 4.66 4.40 4.73 4.83 4.21
           



1 2 .... 2929
97.63
30
n
x x x
x =
n
  
 
alfahadfarwa786@gmail.c
Biostatistics
Arithmetic Mean for Grouped Data
In case of grouped data the values of variable are multiplied by their respective frequencies and totaled. The total
is then divided by total number of observations (sum of frequency).
If denote the respective frequencies of then the arithmetic mean can be obtained using
the following formula;
Example
Calculate the mean of the following data
From the above table
1 2 3
, , ,...., n
f f f f 1 2 3
, , ,....., n
x x x x
1
1
; where n=
n
i i n
i
i
i
f x
x f
n





No of eggs (x) 7 8 9 10 11 12 13 14
No of insects (f) 2 3 3 3 4 2 2 1
f*x 14 24 27 30 44 24 26 14
1
1
20
203;
203
10.15
20
n
i
i
n
i
f
fx where x denotes the individual values in a series
x




 


alfahadfarwa786@gmail.c
Biostatistics
Determination of Arithmetic Mean for Grouped Data (with class
intervals)
In case of grouped frequency distribution, the mid values of class are taken instead of individual values where
mid value can be calculated by averaging the two limit (or boundary) of respective class. Thus if “m” denotes
the class mid value, then average value can be calculated as;
Example
The following data shows weight of fishes recorded from the fish pound, calculate arithmetic mean.
Form above table ,hence
1
1
*
; where n=
n
n
i
i
f m
x f
n





Weight 5-5.9 6-6.9 7-7.9 8-8.9 9-9.9 10-10.9
No. of fishes 1 2 4 3 3 2
Mid
value(m)
5.45 6.45 7.45 8.45 9.45 10.45
f*m 5.45 12.9 29.8 25.35 28.35 20.9
122.75
8.183
15
x  
1 1
* 122.75, 15
n n
i i
f m f
 
 
 
alfahadfarwa786@gmail.c
Biostatistics
Example: Calculate arithmetic mean for the following groped data.
Class
Limits
Class
Boundaries
Mid Points
X
C.F Frequency
(f)
fx
86---90
91---95
96---100
101---105
106---110
111---115
85.5---90.5
90.5---95.5
95.5---100.5
100.5--105.5
105.5– 10.5
110.5--115.5
88
93
98
103
108
113
6
10
20
26
29
30
6
4
10
6
3
1
528
372
980
618
324
113
Solution:
1 2 3 k
1 2 3 k
1 2 3 k
+ + ... x
f f f f fx
x x x
X = =
+ + ... f
f f f f


For grouped data
83
.
97
30
2935




f
fx
=
X
alfahadfarwa786@gmail.c
Biostatistics
Important Properties of the Arithmetic Mean
1.
The sum of deviation from the arithmetic mean is equal to zero.
2.
The sum of squared deviations from the arithmetic mean is smaller than the sum of squared deviations from
any other value.
3. If
( ) 0
i
y y
 

2
( ) minimum
i
y y
 

, where "a" and "b"are any two numbers and a 0, then y = ax + b
i i
y ax b
  
alfahadfarwa786@gmail.c

Lecture 07.

  • 1.
  • 2.
    Biostatistics Arithmetic Mean (AM) Arithmeticmean of a series is obtained by dividing total of values in series by the number of items i.e. Arithmetic mean is denoted by . Determination of Arithmetic Mean for Ungrouped Data Let be the “n” values of variable , then the arithmetic mean can be obtained by using the following formula: 1 2 3 , , ,......., n x x x x X 1 2 3 1 1 [ ..... ] 1 , where is arithmetic mean, = summation symbol n n i i x x x x x n x x n           sum of all values Mean= total number of values x alfahadfarwa786@gmail.c
  • 3.
    Biostatistics Example: The following areplasma potassium values (mmol/l) of 14 dogs: 4.37, 4.87, 4.35, 3.92, 4.68, 4.54, 5.24, 4.57, 4.59, 4.66, 4.40, 4.73, 4.83, 4.21. Solution: Example The following data is the final plant height (cm) of thirty plants of wheat. Calculate Arithmetic mean. 87, 91, 89, 88, 89, 91, 87, 92, 90, 98, 95, 97, 96, 100, 101, 96, 98, 99, 98, 100, 102, 99, 101, 105, 103, 107, 105, 106, 107, 112. Mean 14 Mean 4.57mmol/l 4.37 4.87 4.35 3.92 4.68 4.54 5.24 4.57 4.59 4.66 4.40 4.73 4.83 4.21                1 2 .... 2929 97.63 30 n x x x x = n      alfahadfarwa786@gmail.c
  • 4.
    Biostatistics Arithmetic Mean forGrouped Data In case of grouped data the values of variable are multiplied by their respective frequencies and totaled. The total is then divided by total number of observations (sum of frequency). If denote the respective frequencies of then the arithmetic mean can be obtained using the following formula; Example Calculate the mean of the following data From the above table 1 2 3 , , ,...., n f f f f 1 2 3 , , ,....., n x x x x 1 1 ; where n= n i i n i i i f x x f n      No of eggs (x) 7 8 9 10 11 12 13 14 No of insects (f) 2 3 3 3 4 2 2 1 f*x 14 24 27 30 44 24 26 14 1 1 20 203; 203 10.15 20 n i i n i f fx where x denotes the individual values in a series x         alfahadfarwa786@gmail.c
  • 5.
    Biostatistics Determination of ArithmeticMean for Grouped Data (with class intervals) In case of grouped frequency distribution, the mid values of class are taken instead of individual values where mid value can be calculated by averaging the two limit (or boundary) of respective class. Thus if “m” denotes the class mid value, then average value can be calculated as; Example The following data shows weight of fishes recorded from the fish pound, calculate arithmetic mean. Form above table ,hence 1 1 * ; where n= n n i i f m x f n      Weight 5-5.9 6-6.9 7-7.9 8-8.9 9-9.9 10-10.9 No. of fishes 1 2 4 3 3 2 Mid value(m) 5.45 6.45 7.45 8.45 9.45 10.45 f*m 5.45 12.9 29.8 25.35 28.35 20.9 122.75 8.183 15 x   1 1 * 122.75, 15 n n i i f m f       alfahadfarwa786@gmail.c
  • 6.
    Biostatistics Example: Calculate arithmeticmean for the following groped data. Class Limits Class Boundaries Mid Points X C.F Frequency (f) fx 86---90 91---95 96---100 101---105 106---110 111---115 85.5---90.5 90.5---95.5 95.5---100.5 100.5--105.5 105.5– 10.5 110.5--115.5 88 93 98 103 108 113 6 10 20 26 29 30 6 4 10 6 3 1 528 372 980 618 324 113 Solution: 1 2 3 k 1 2 3 k 1 2 3 k + + ... x f f f f fx x x x X = = + + ... f f f f f   For grouped data 83 . 97 30 2935     f fx = X alfahadfarwa786@gmail.c
  • 7.
    Biostatistics Important Properties ofthe Arithmetic Mean 1. The sum of deviation from the arithmetic mean is equal to zero. 2. The sum of squared deviations from the arithmetic mean is smaller than the sum of squared deviations from any other value. 3. If ( ) 0 i y y    2 ( ) minimum i y y    , where "a" and "b"are any two numbers and a 0, then y = ax + b i i y ax b    alfahadfarwa786@gmail.c