This document discusses key concepts related to analysis of variance (ANOVA), including:
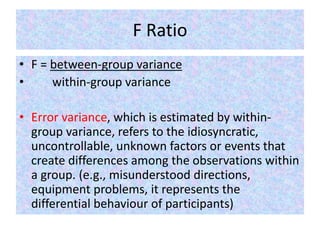
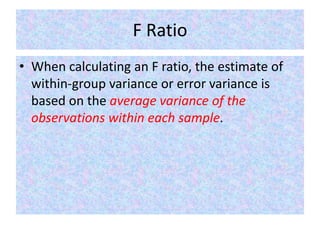
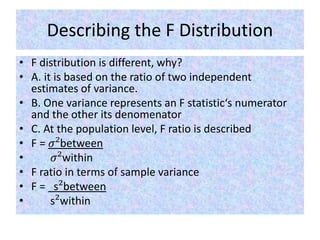
1. The F ratio compares between-group variance to within-group variance. Within-group variance represents error.
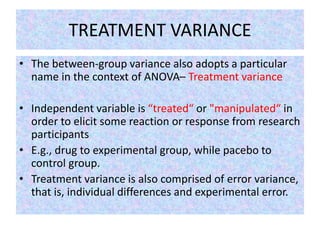
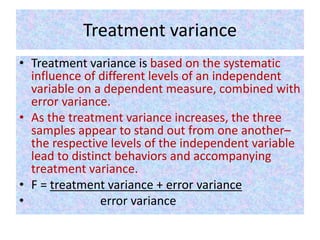
2. Treatment variance refers to the systematic influence of different levels of an independent variable on a dependent measure plus error variance.
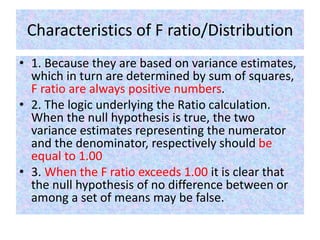
3. The F distribution is based on the ratio of two independent variance estimates - one for the numerator and one for the denominator. An F ratio above 1 indicates the null hypothesis of no mean differences may be false.