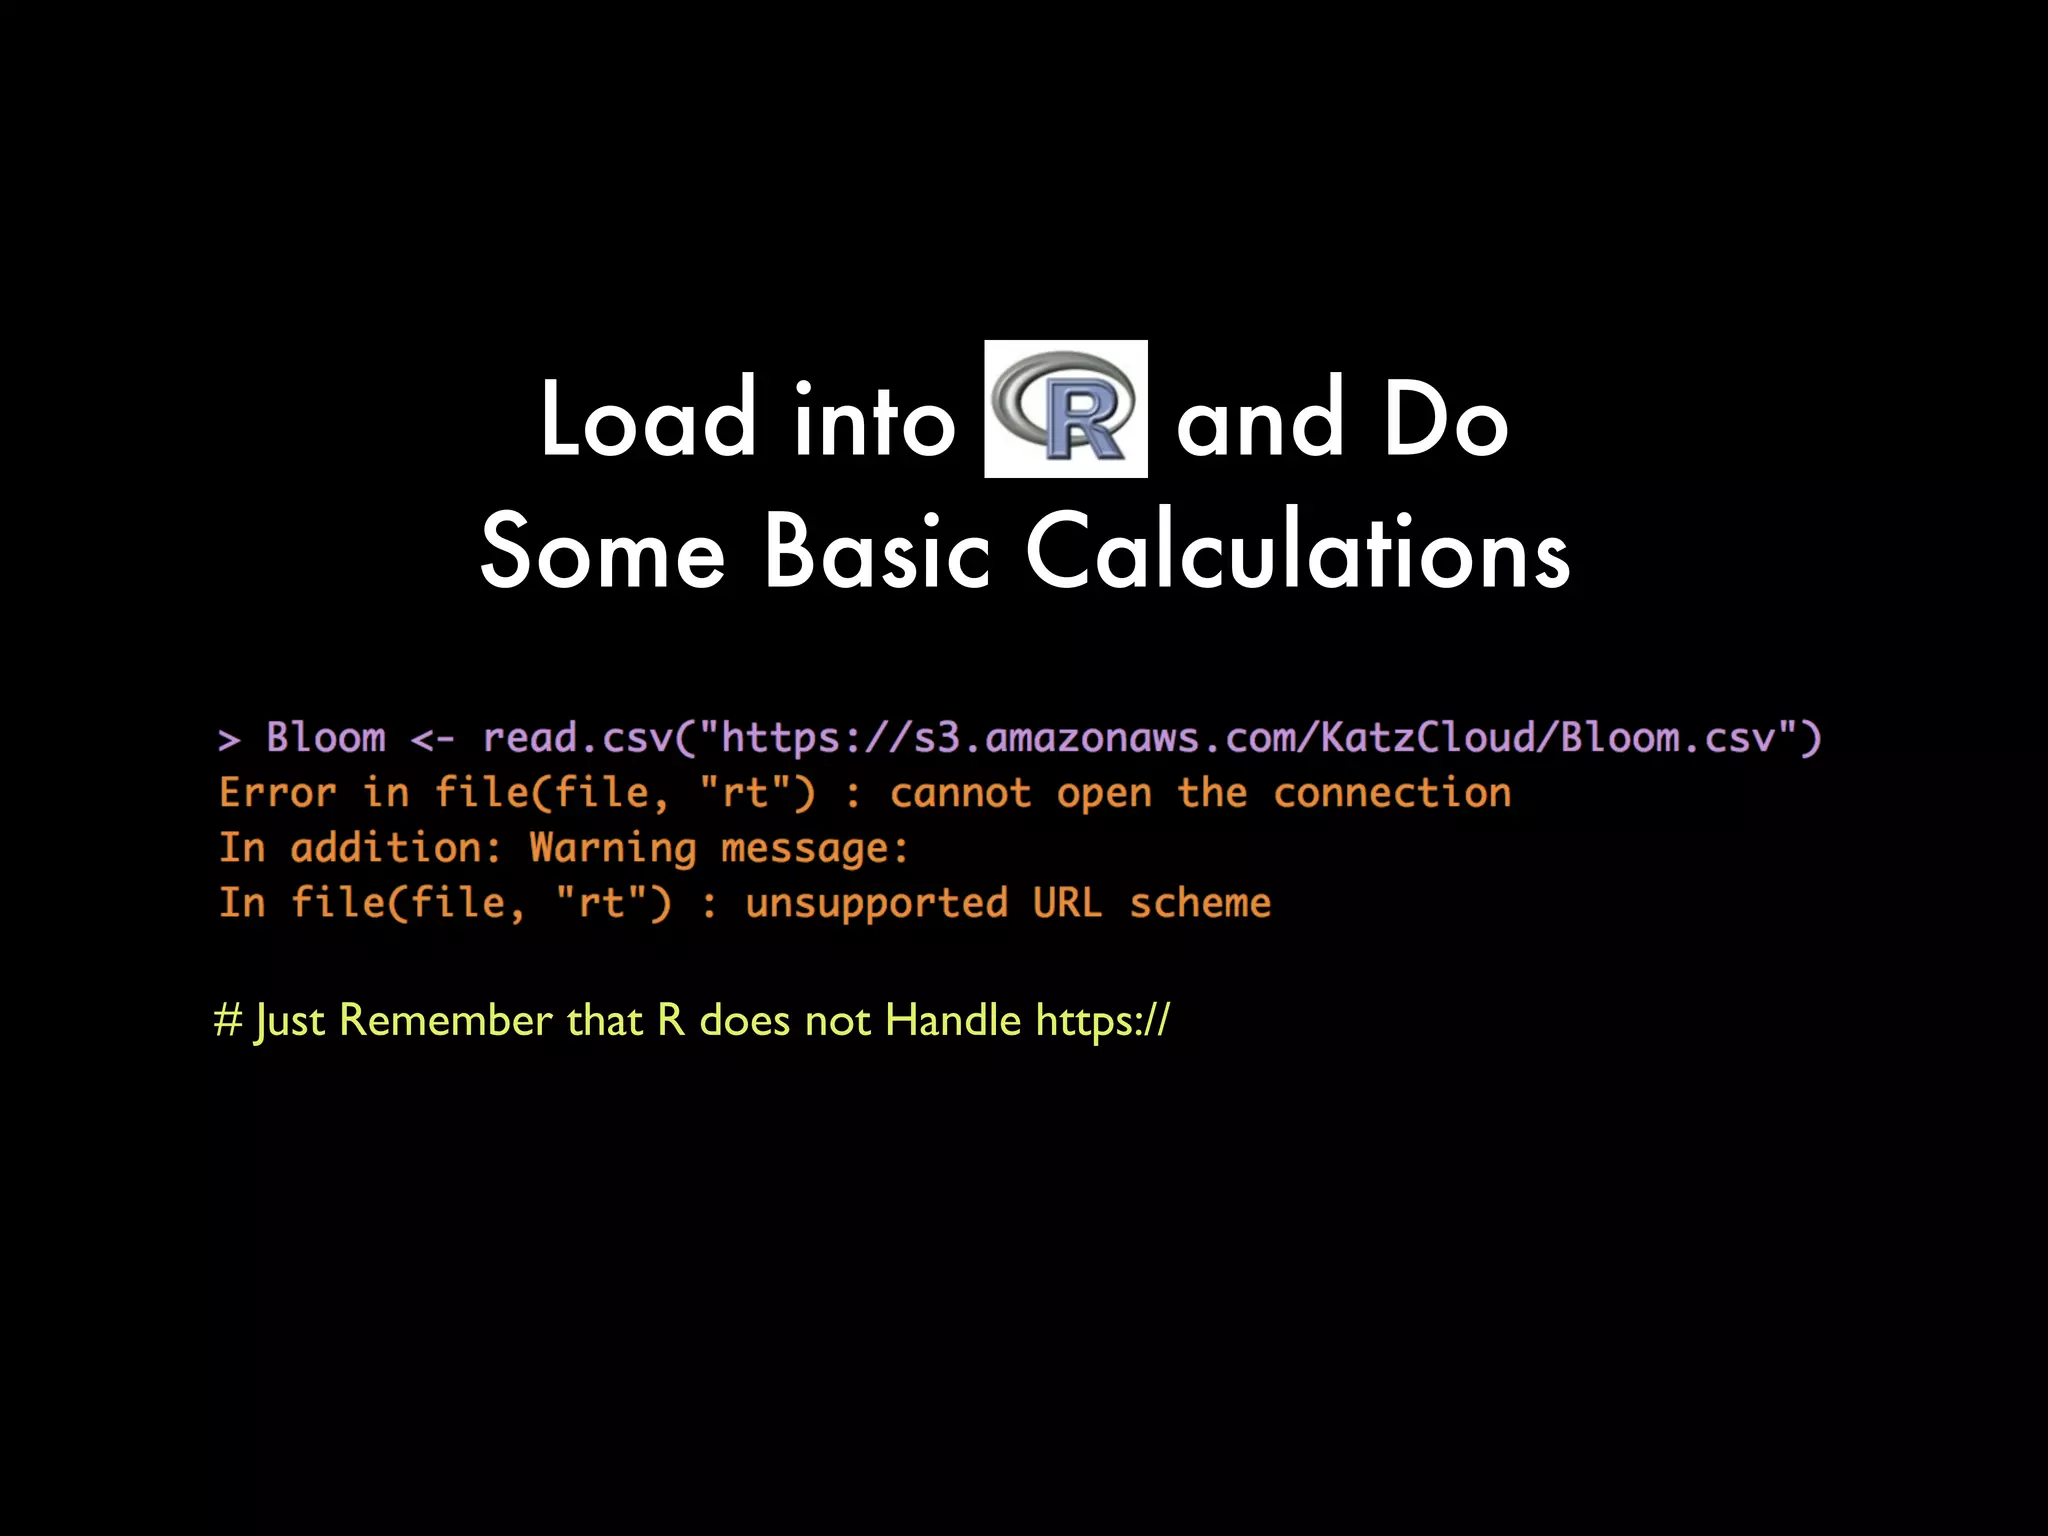
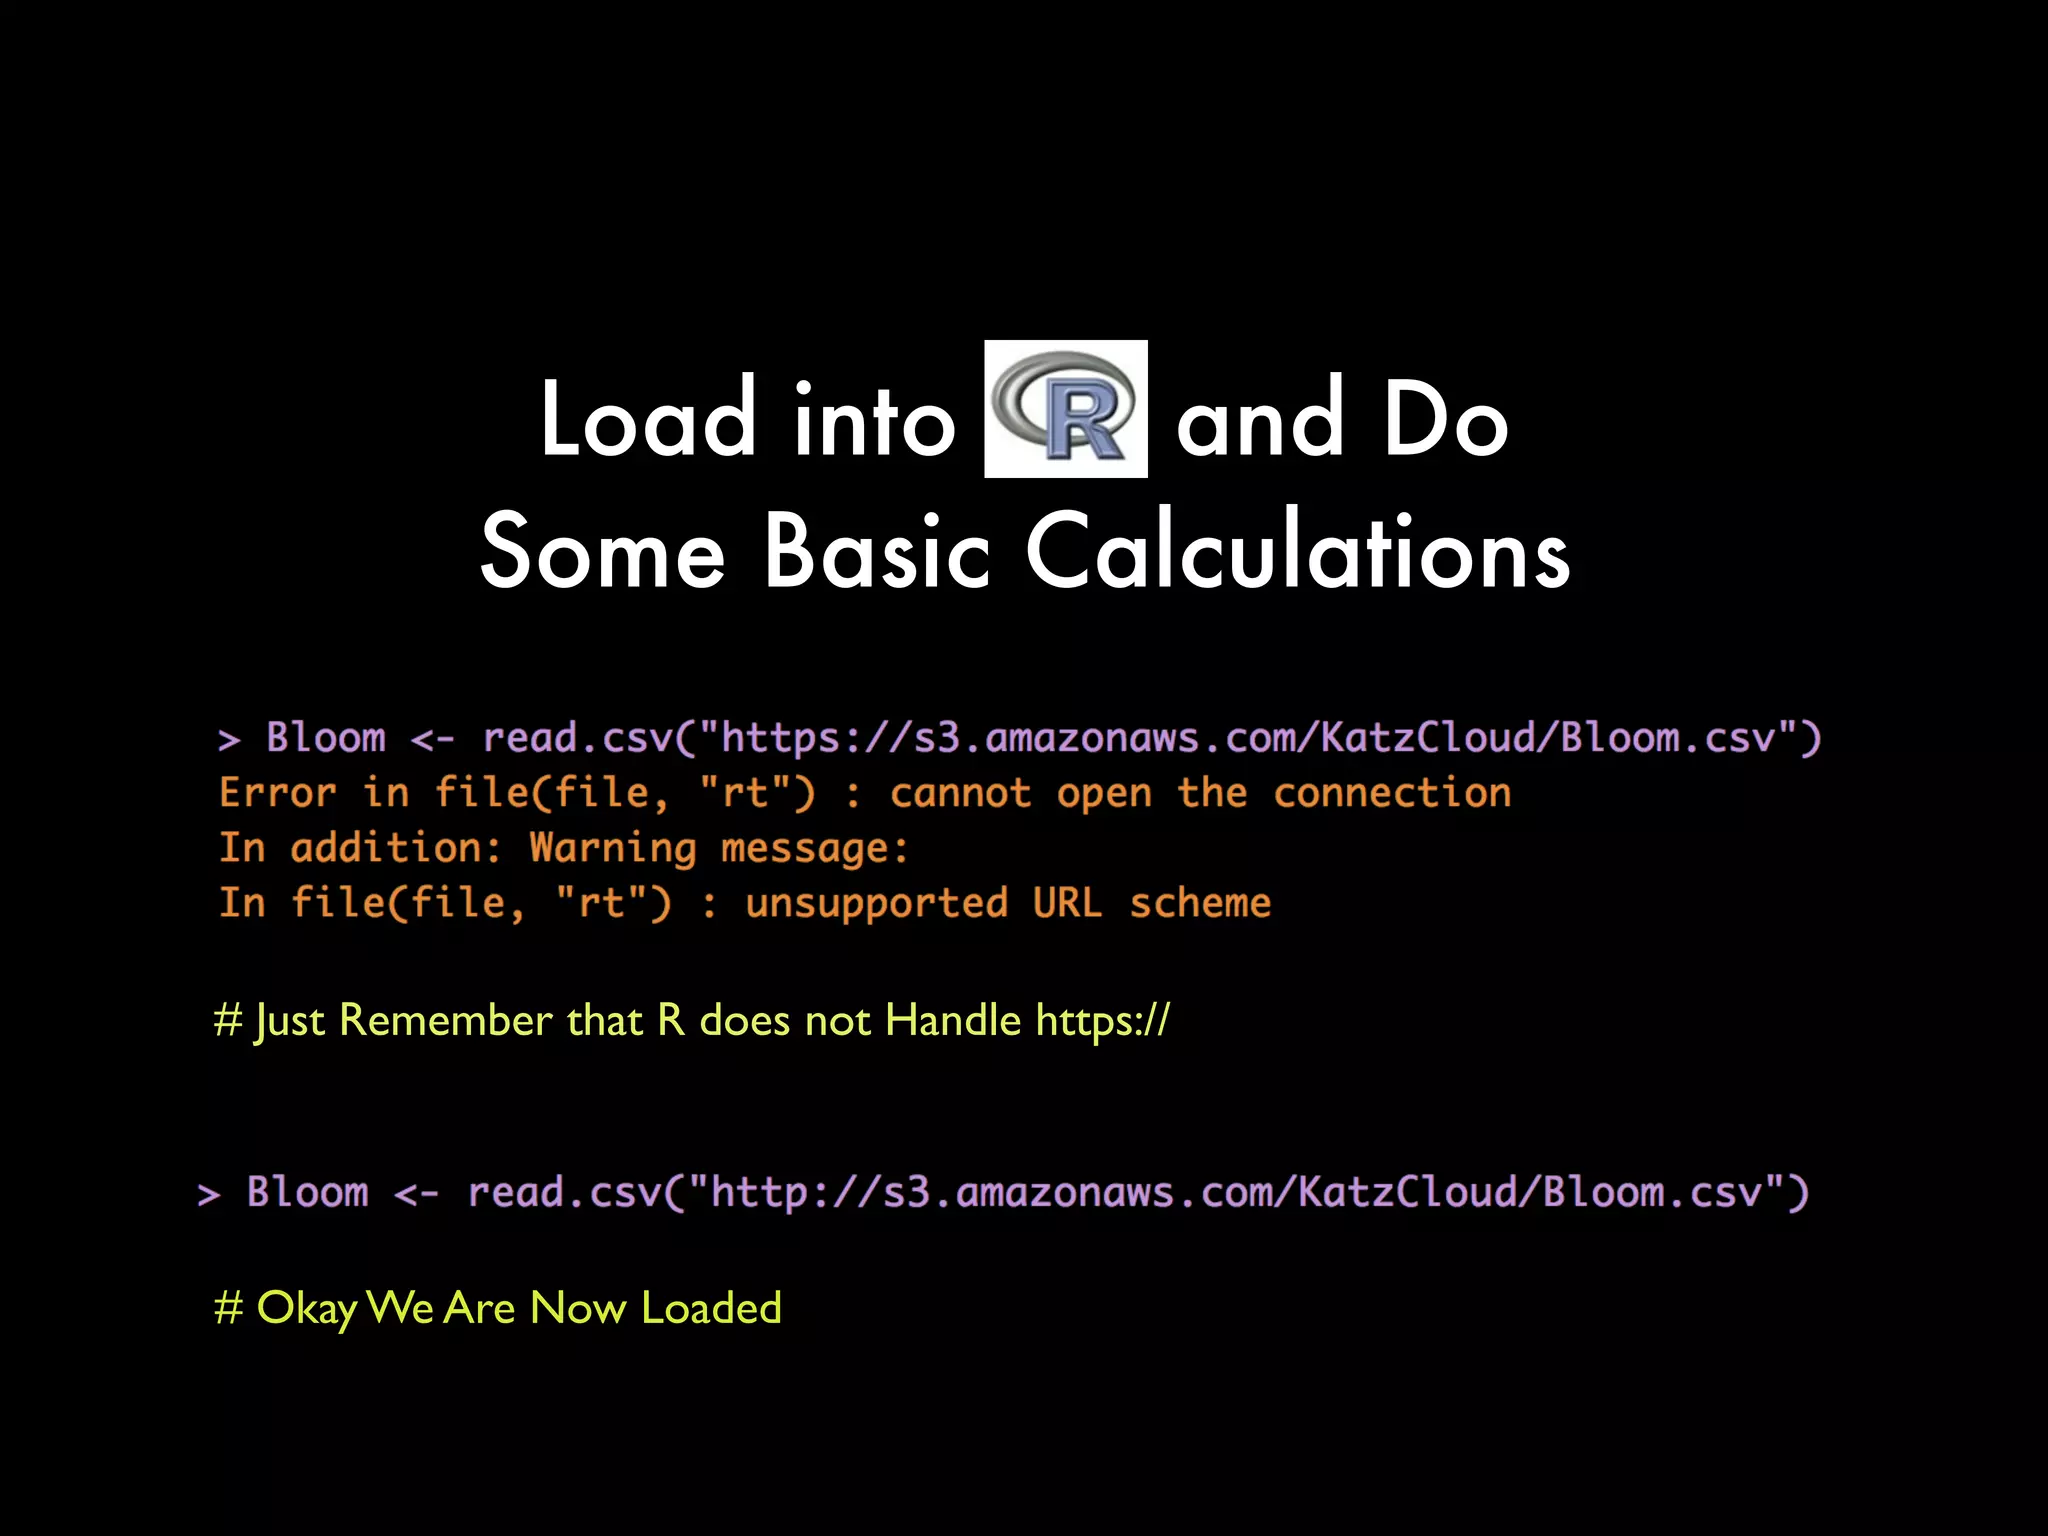
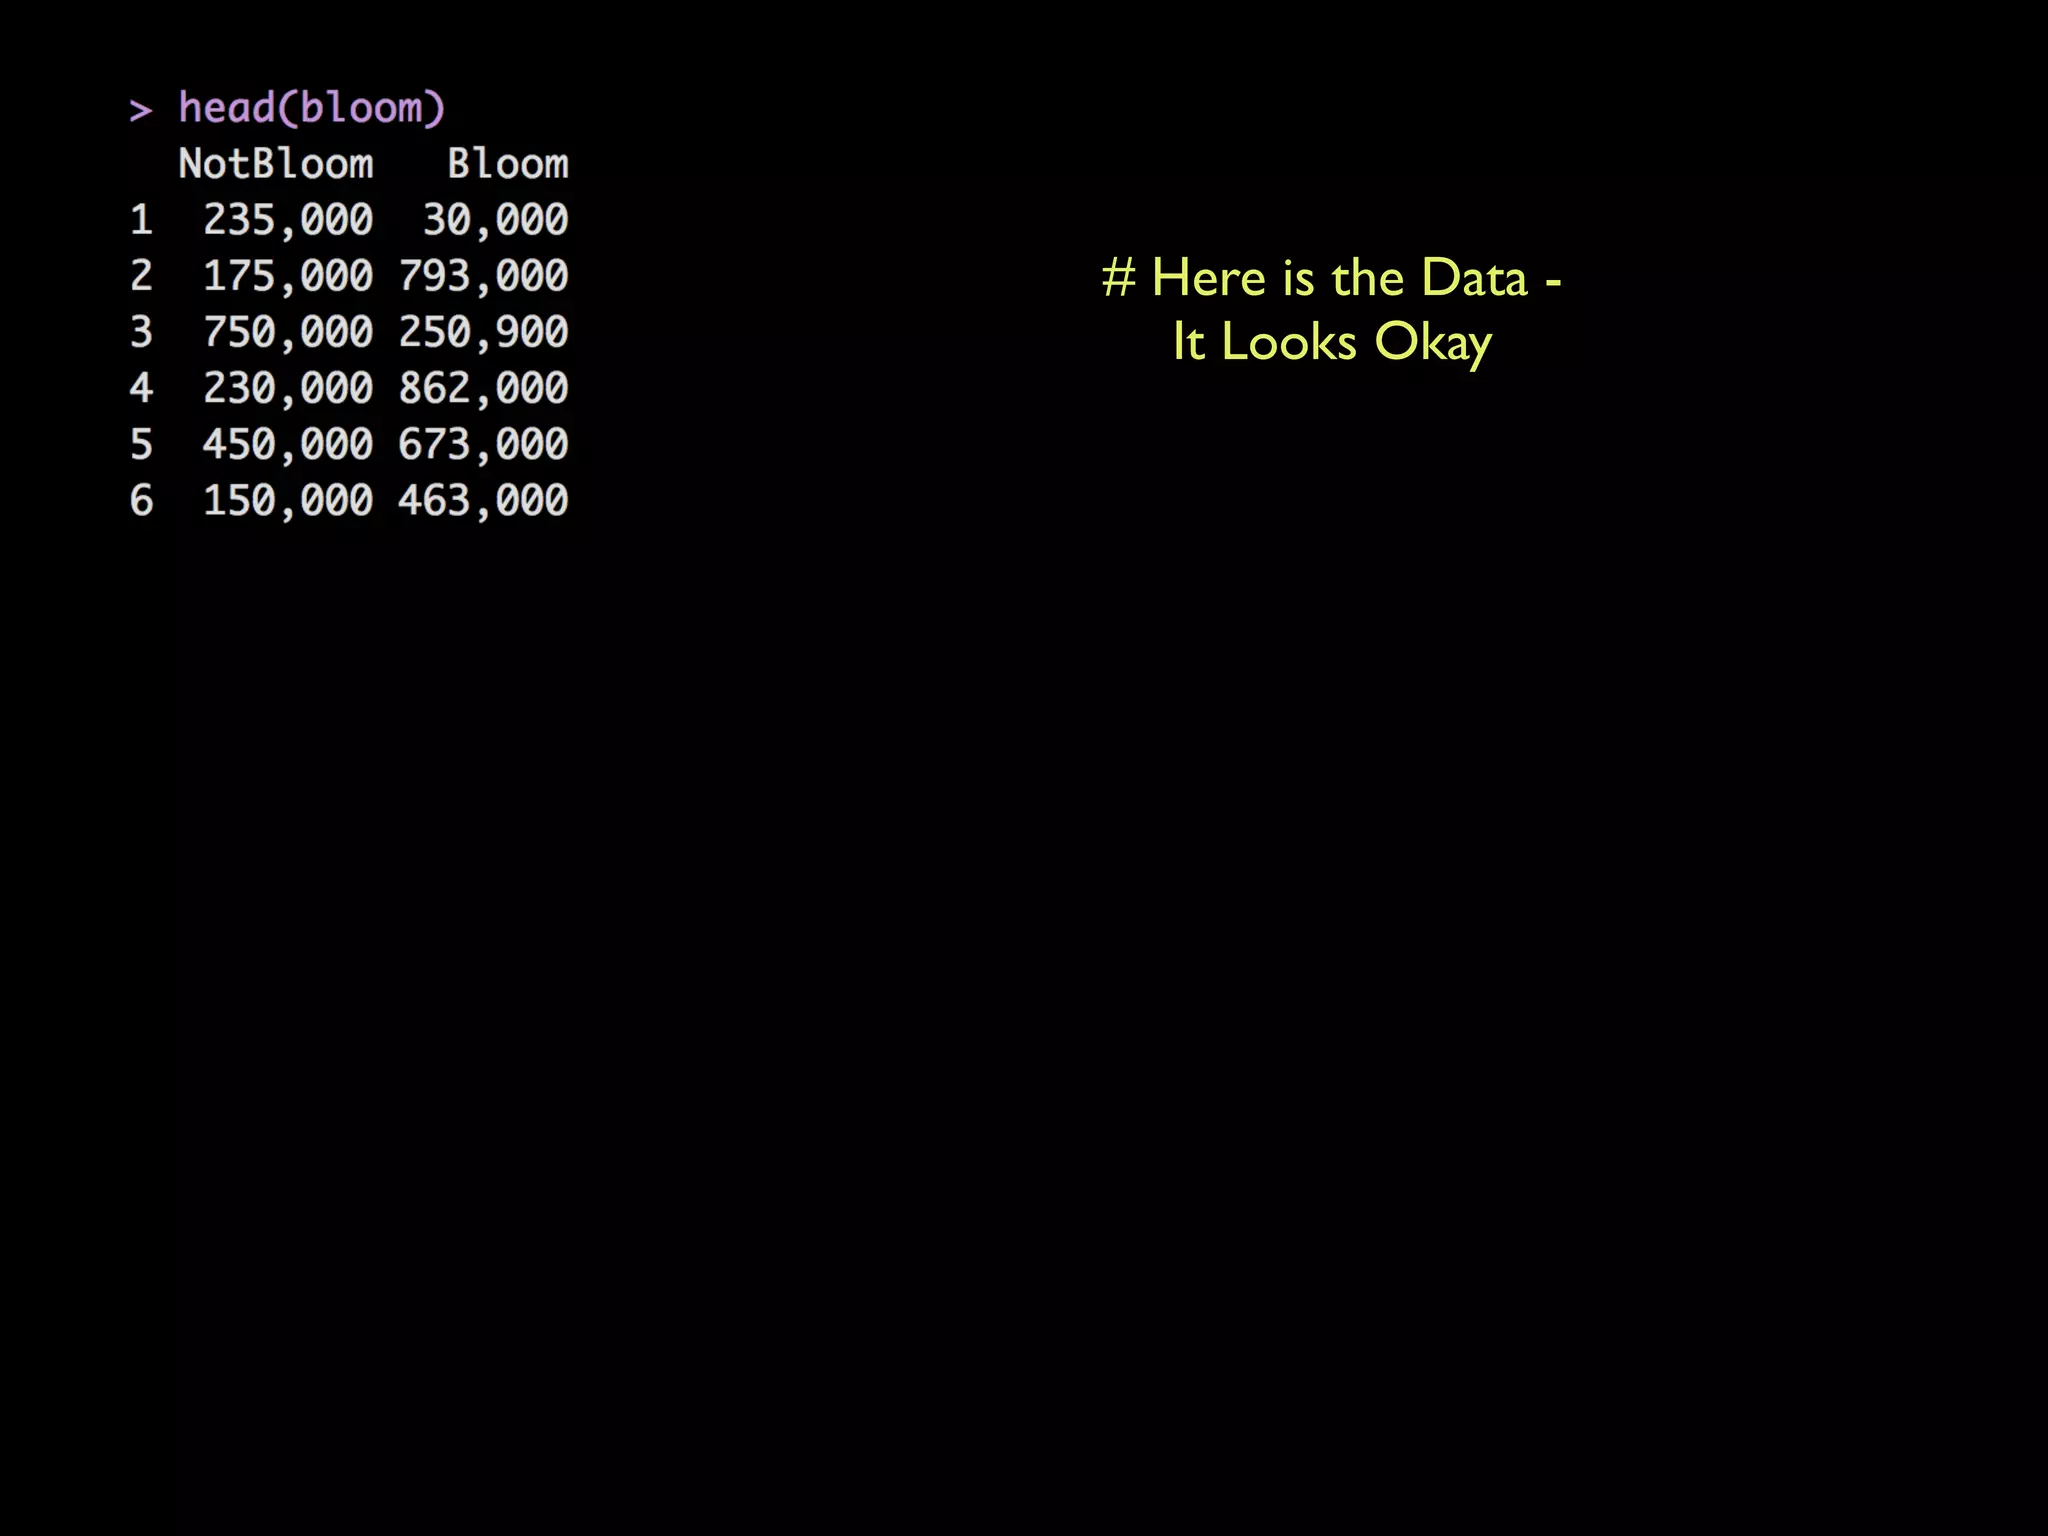
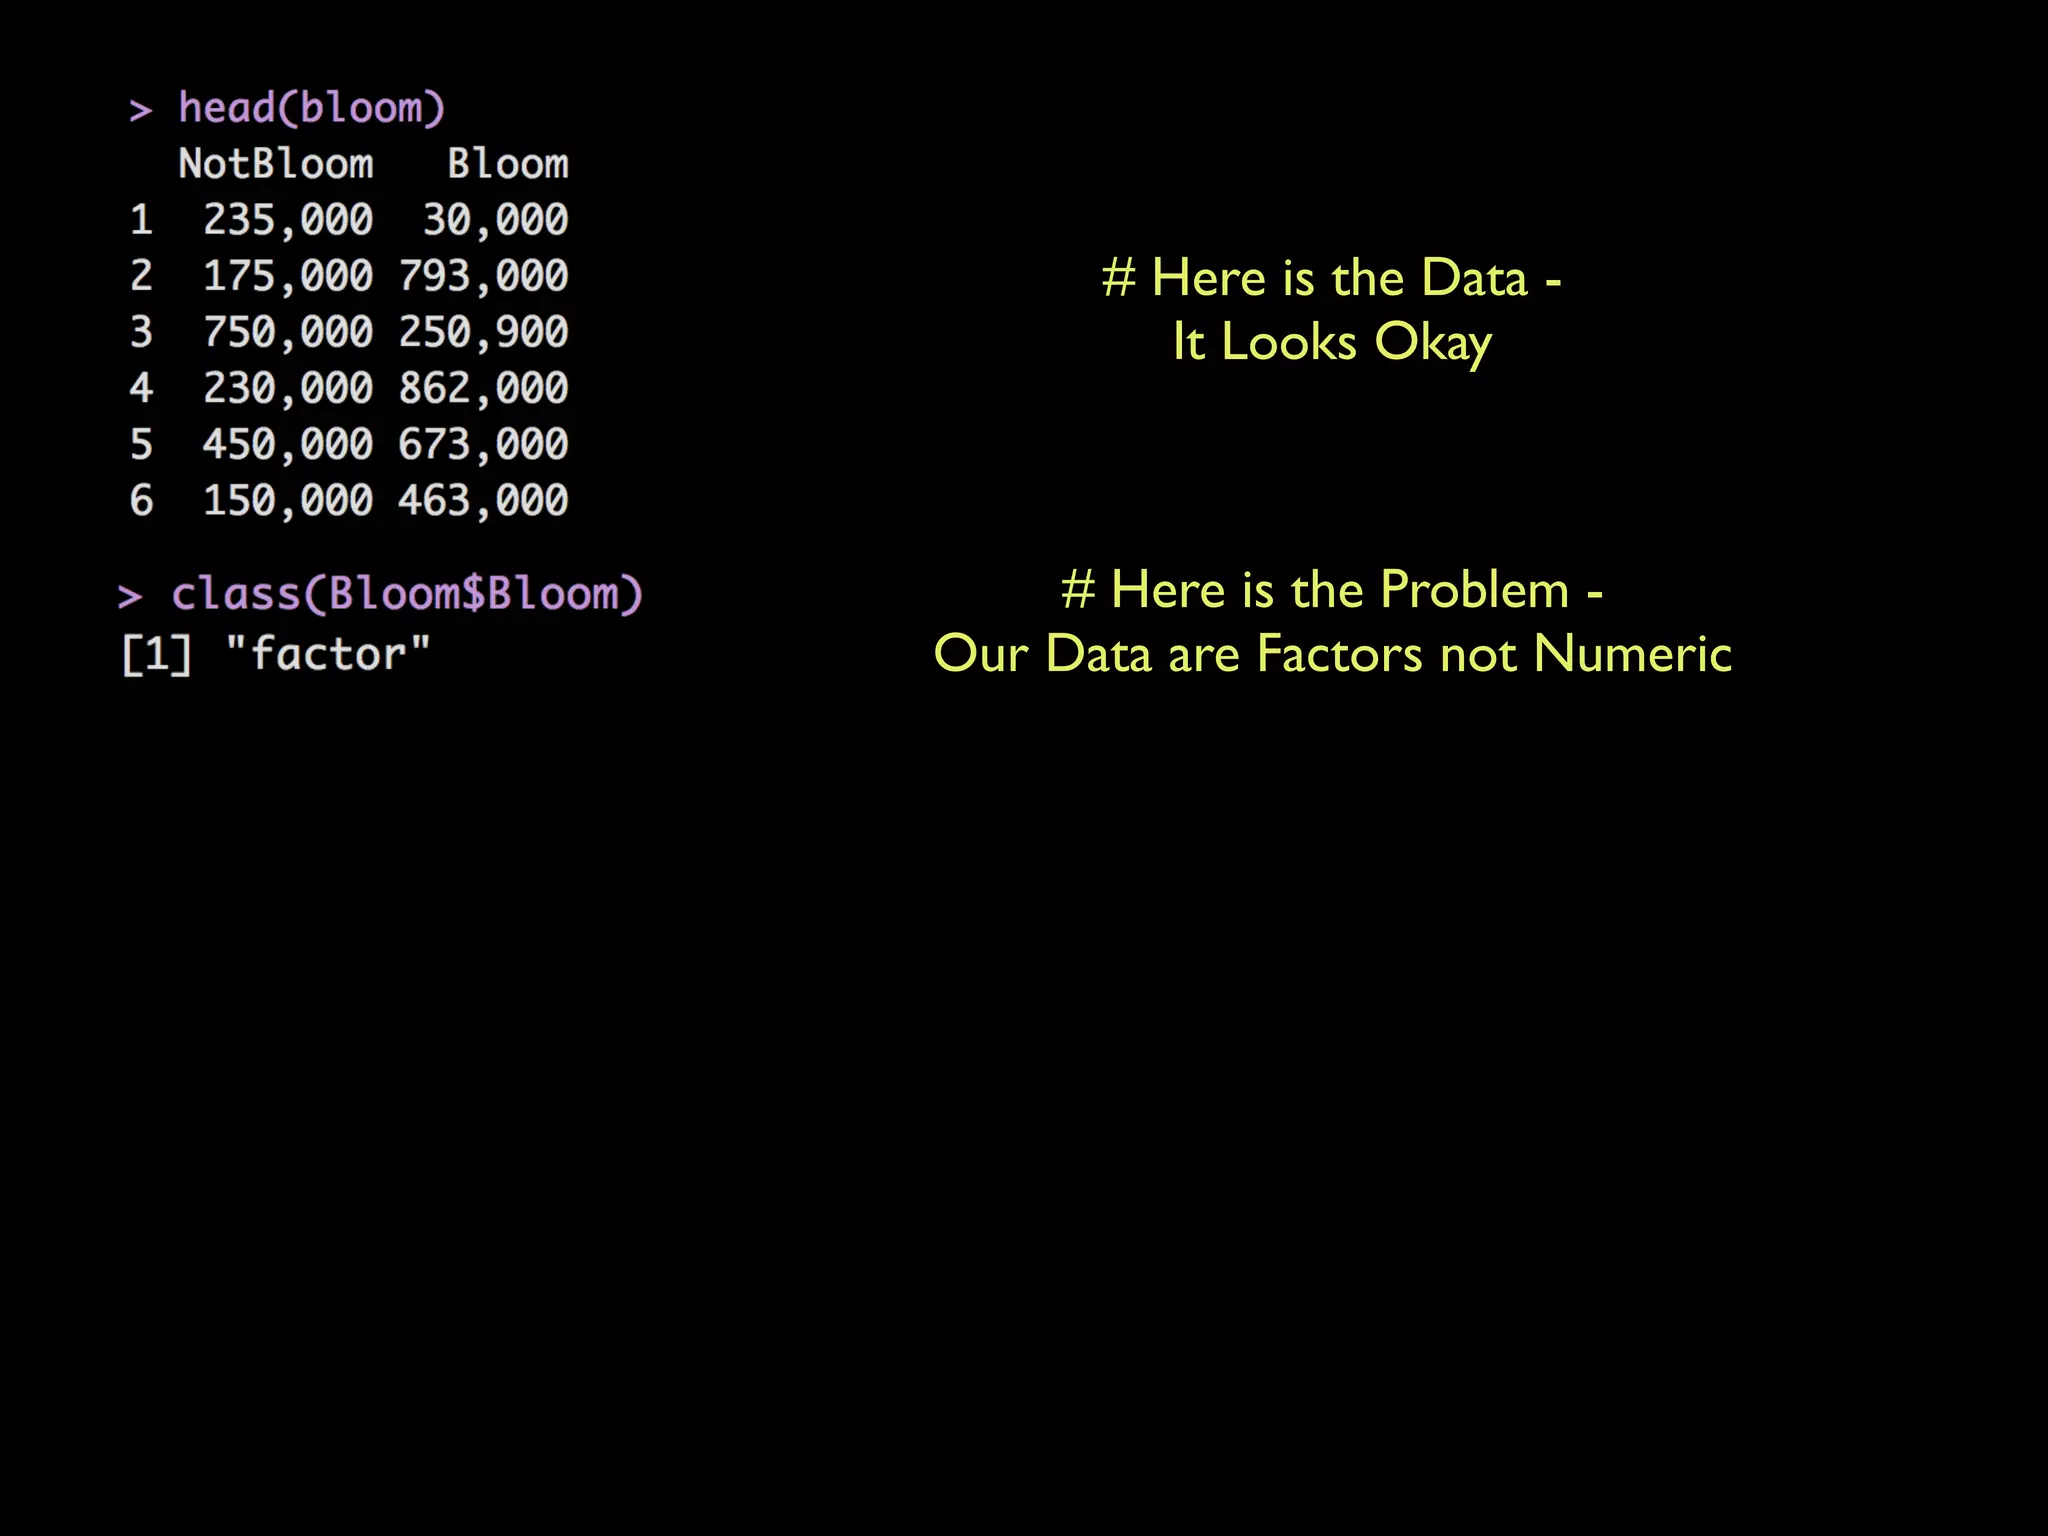
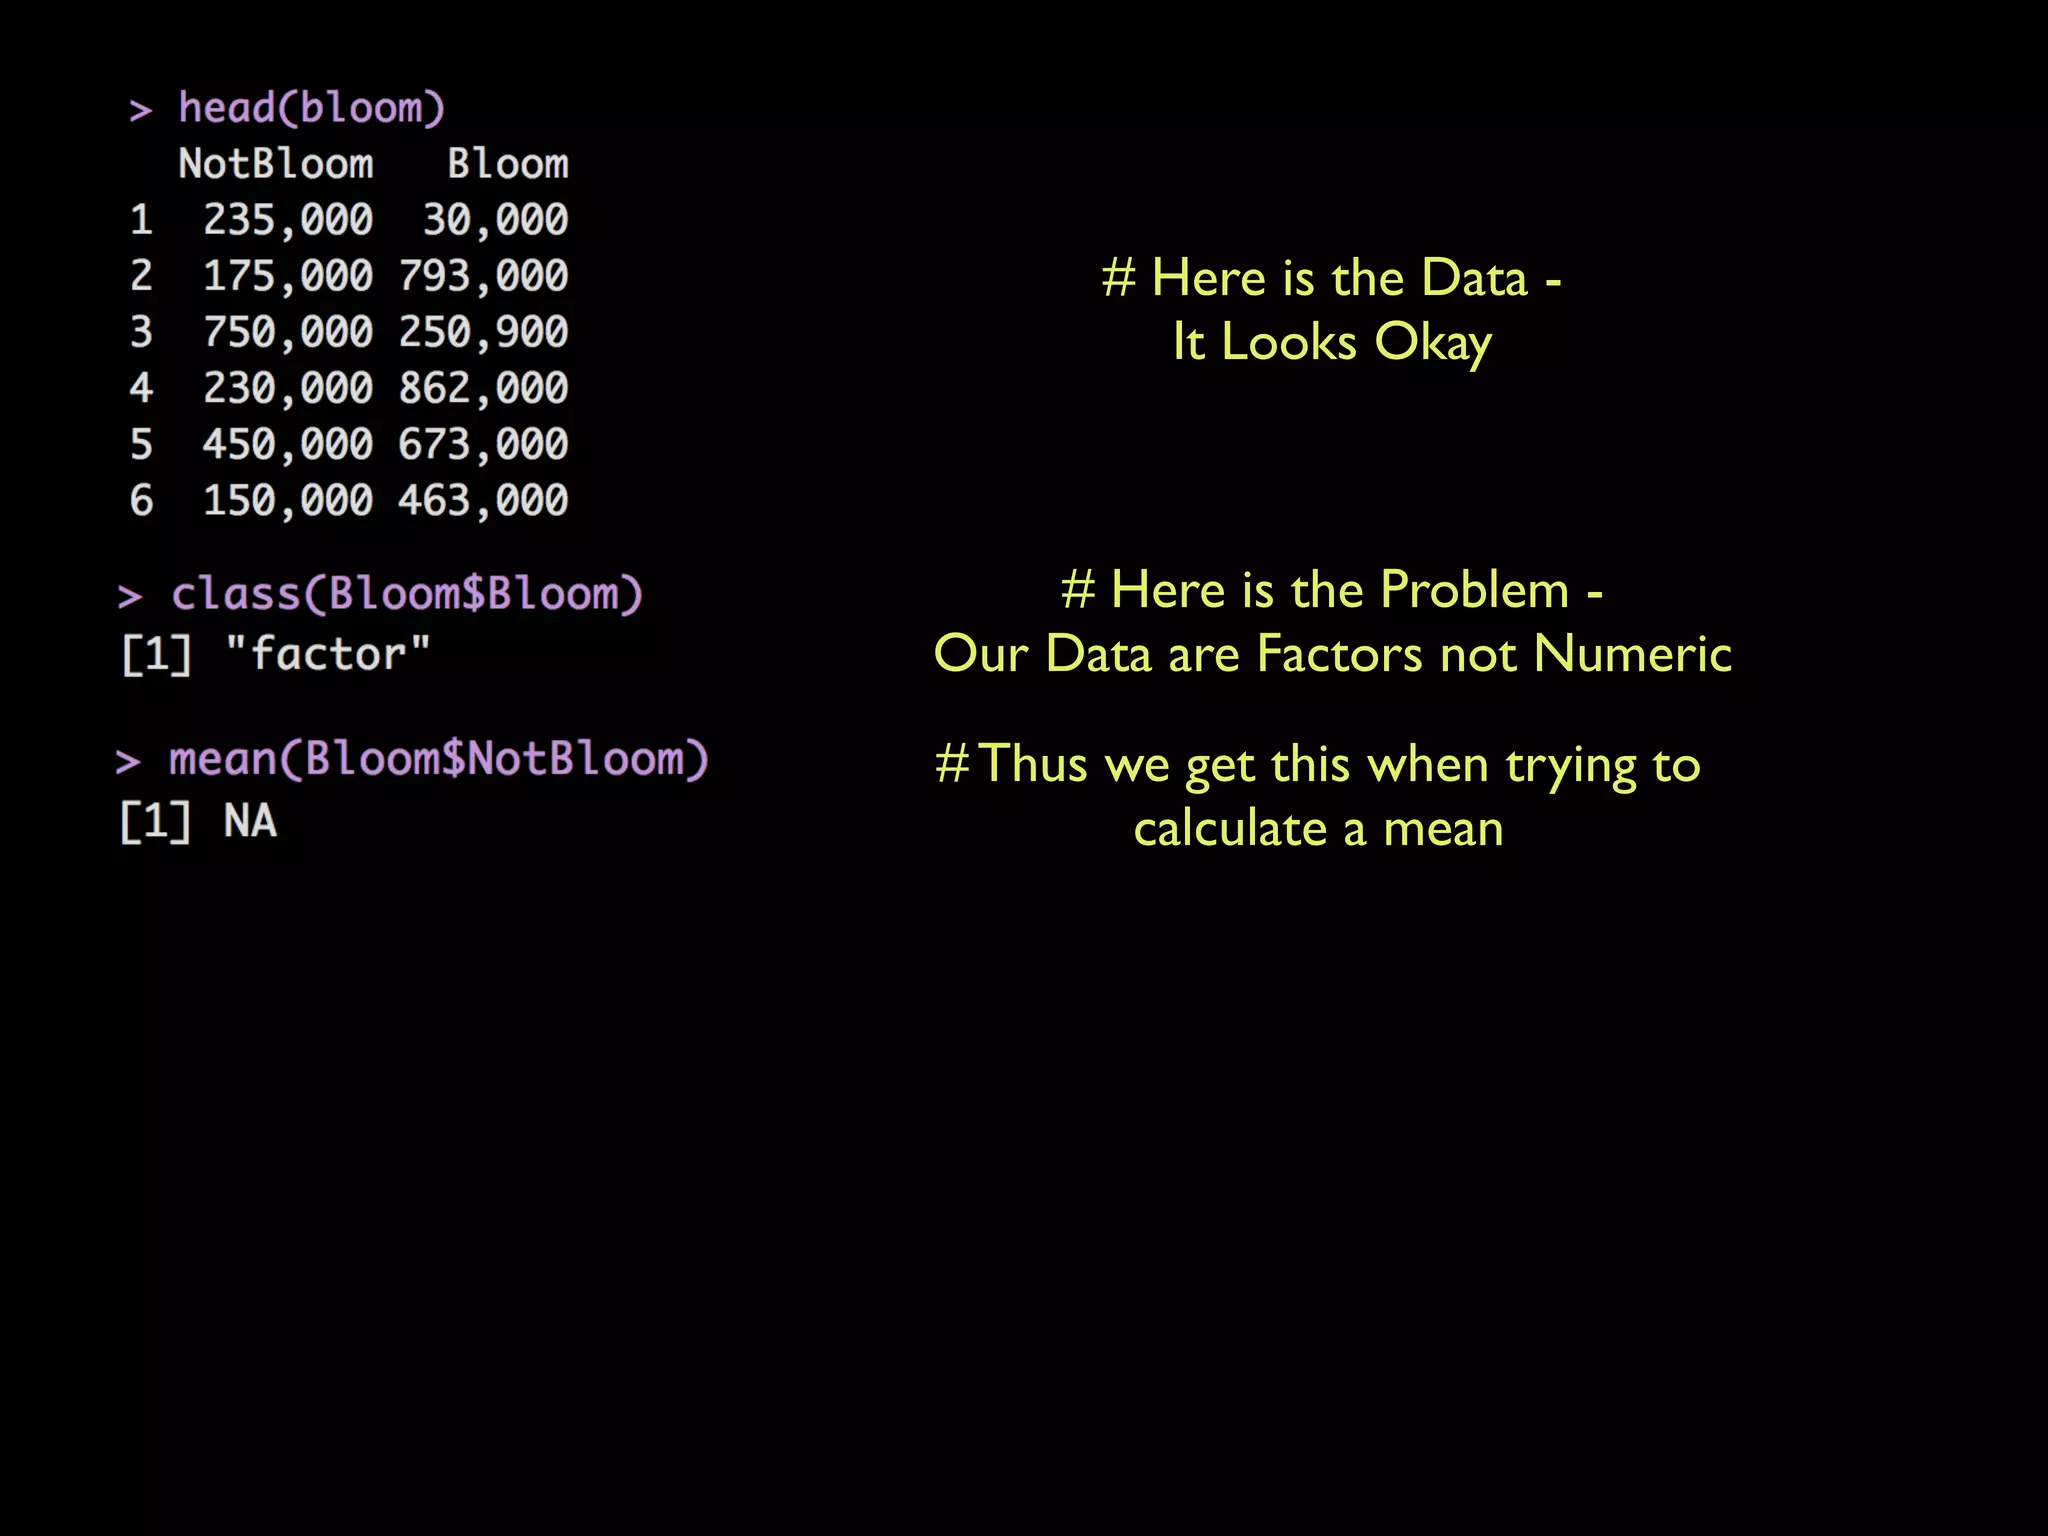
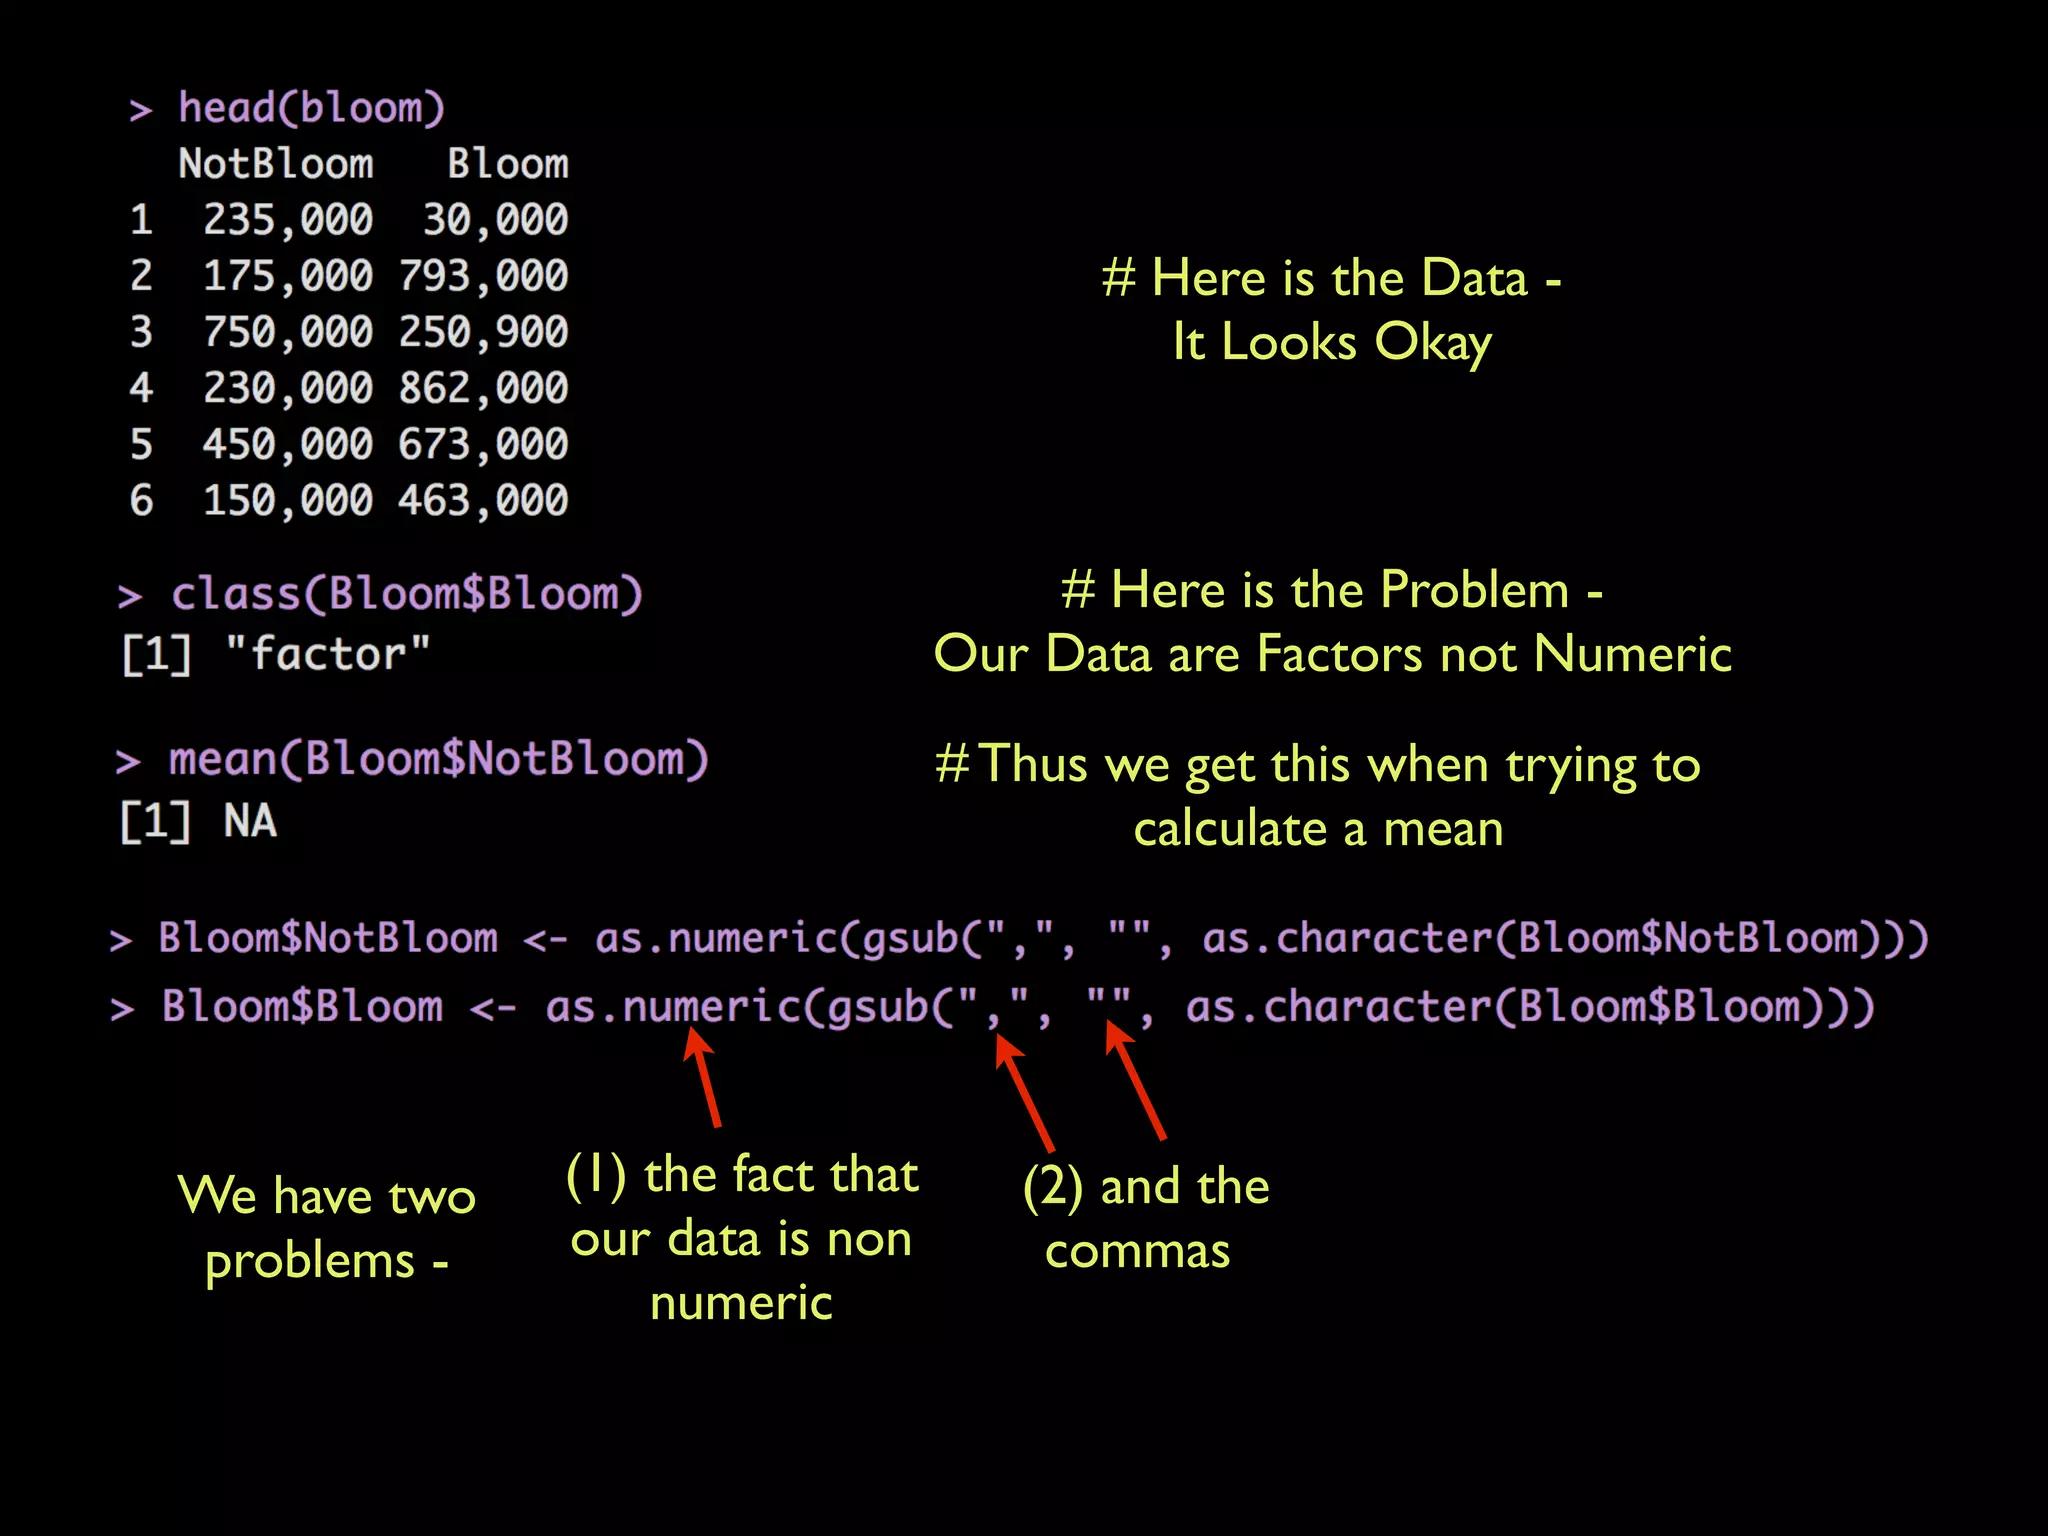
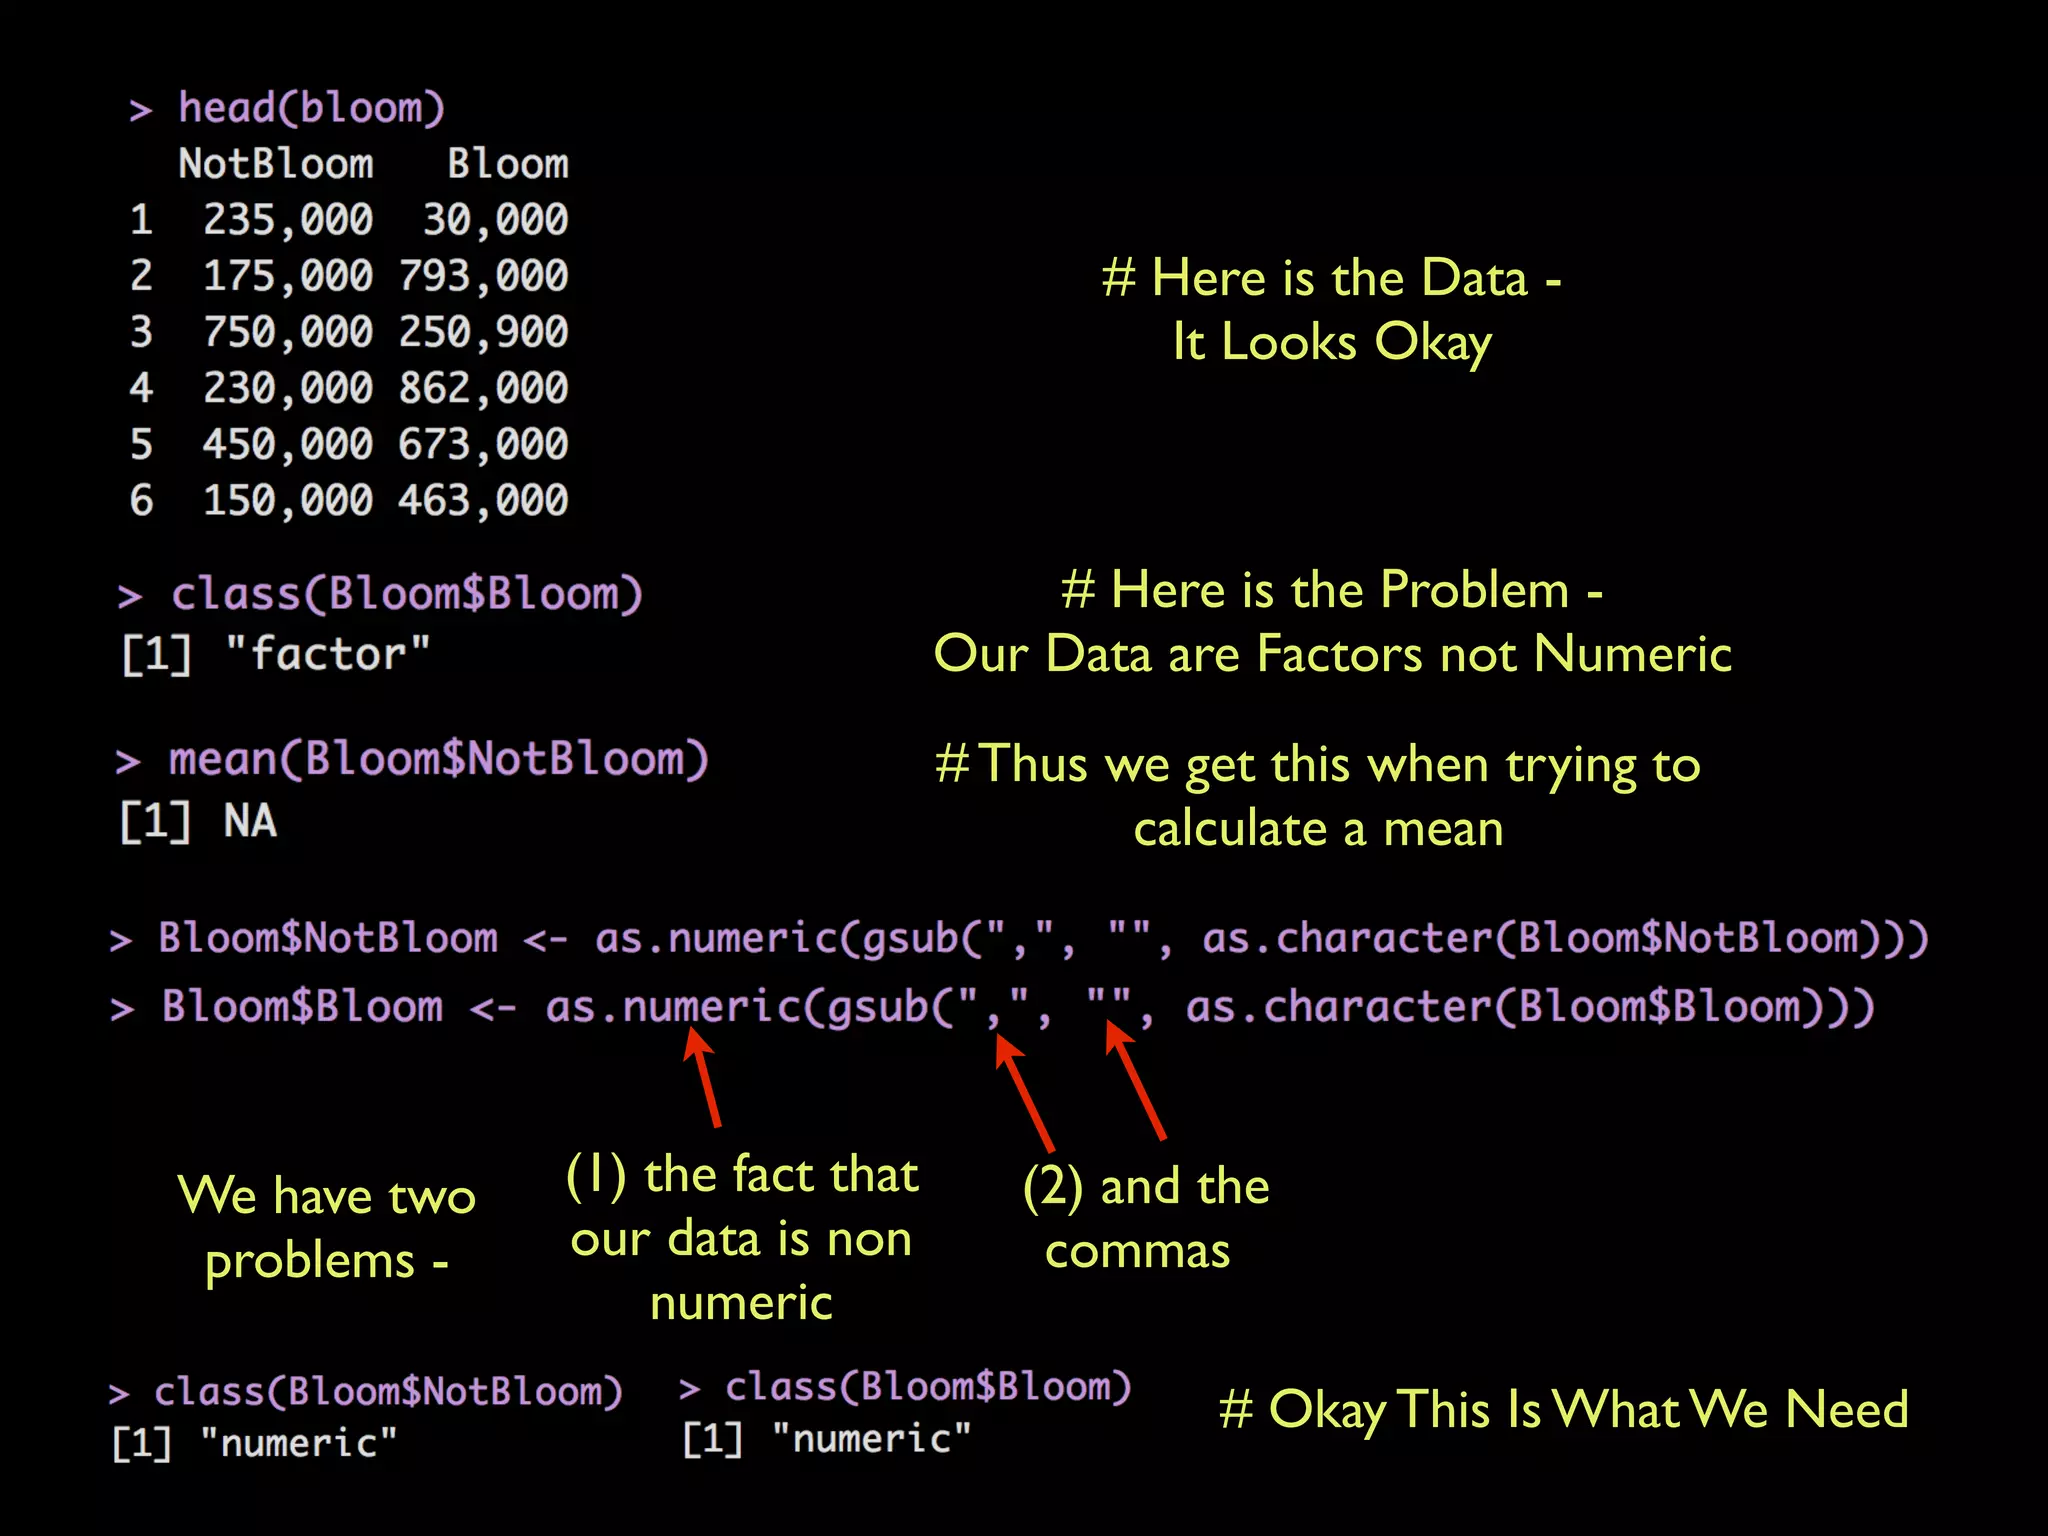
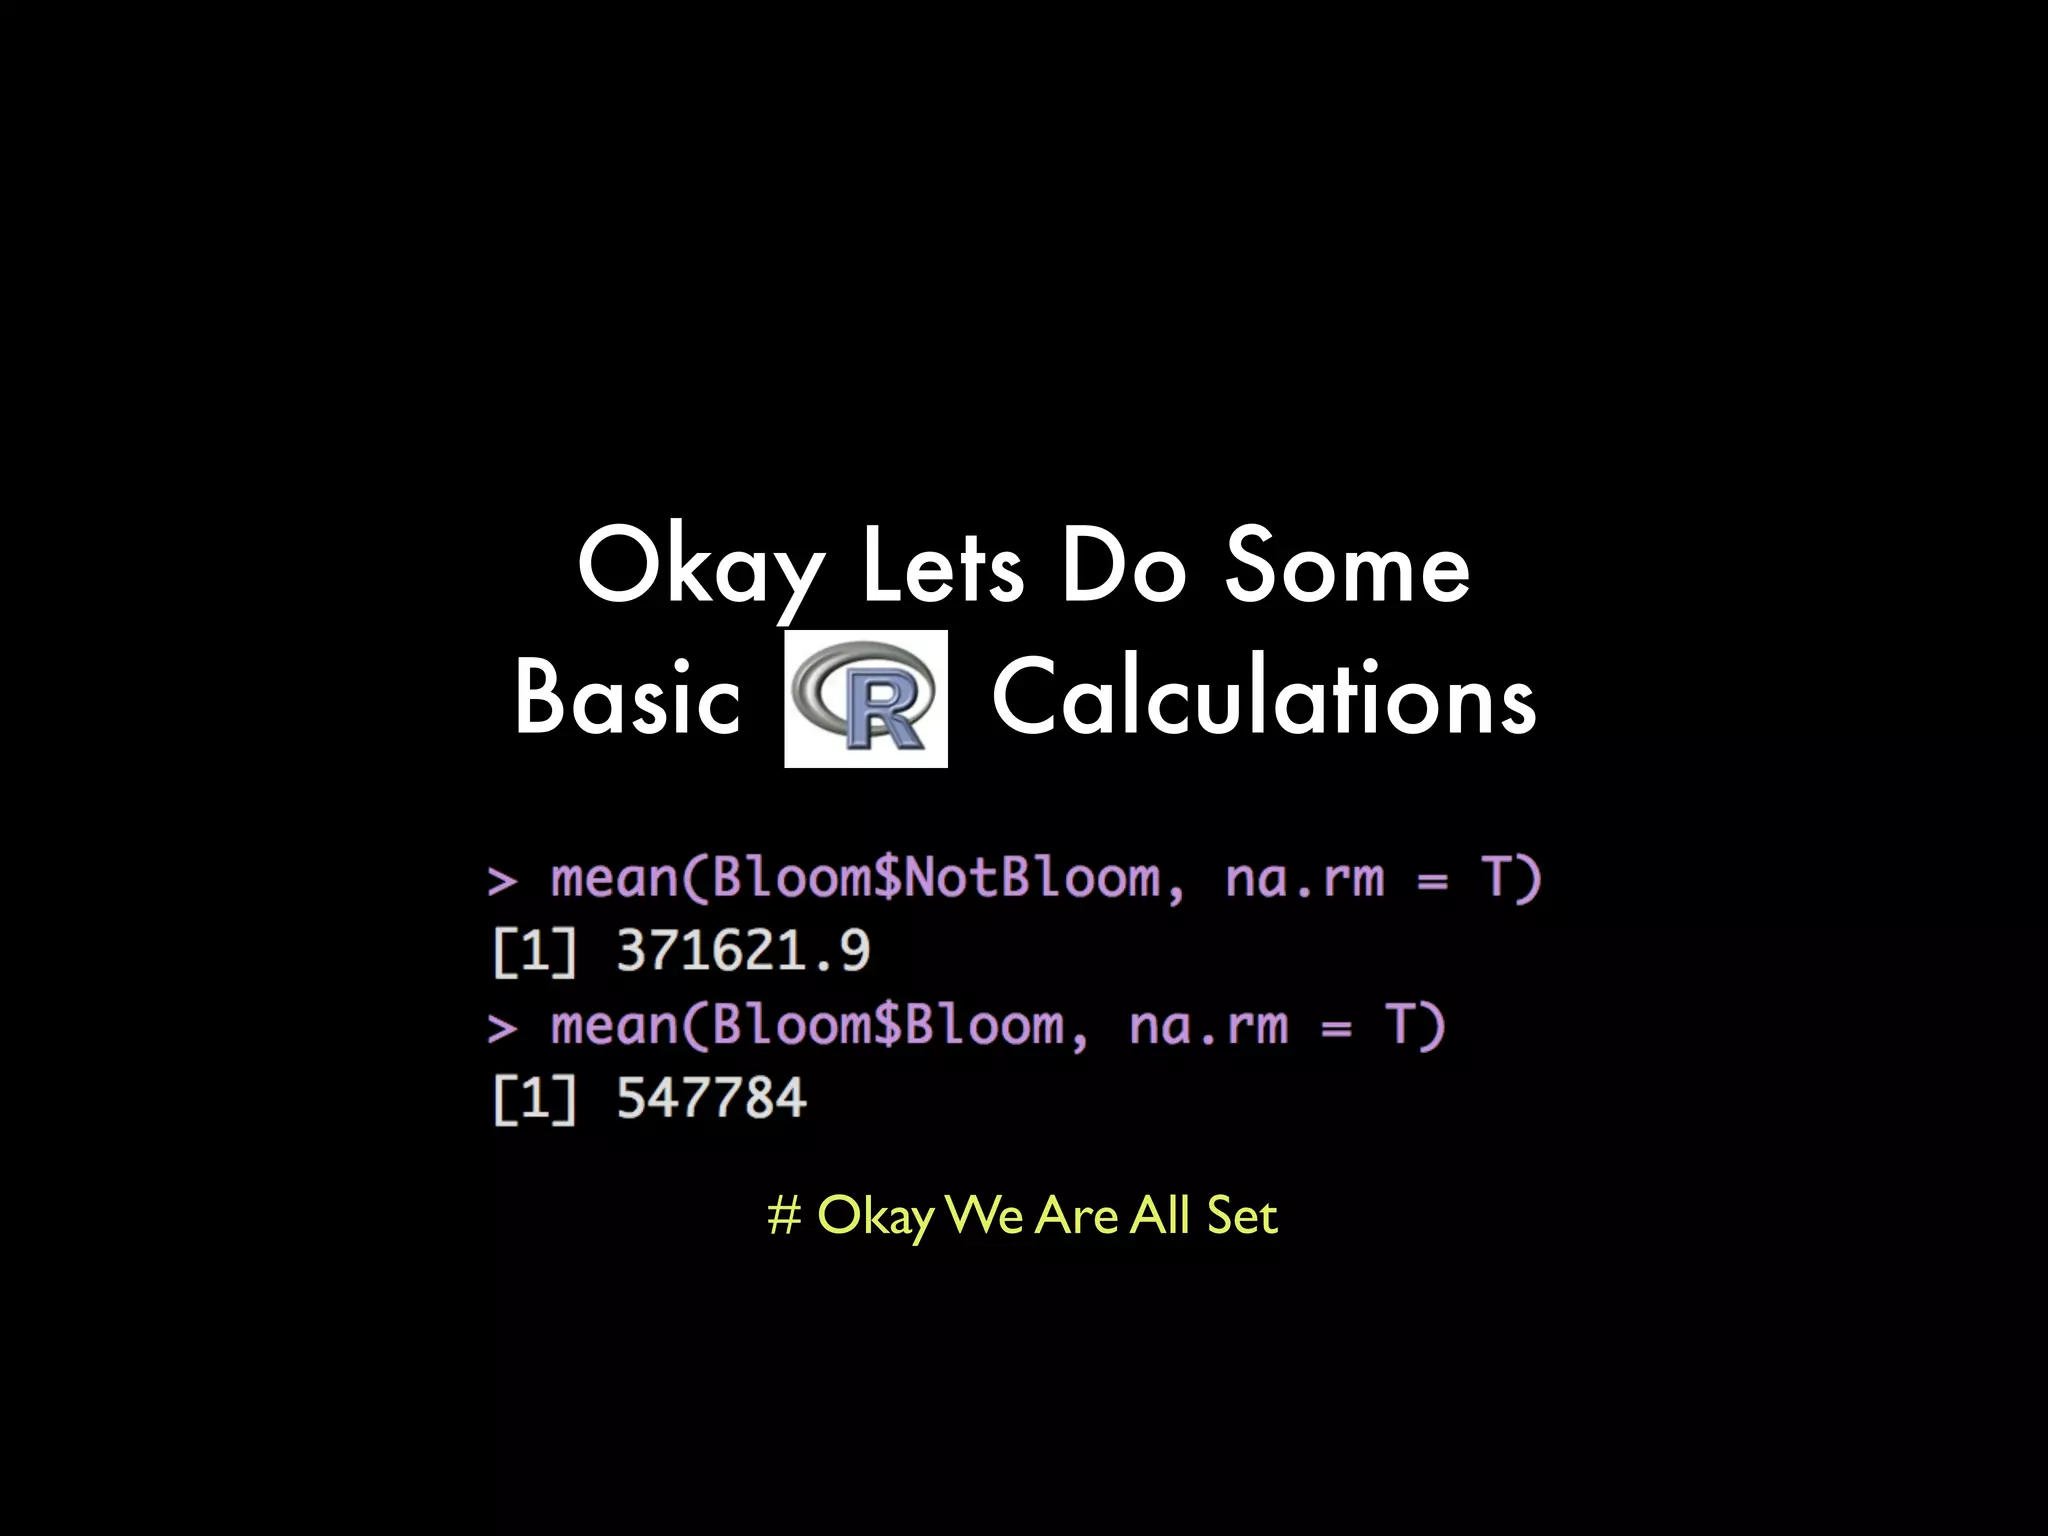
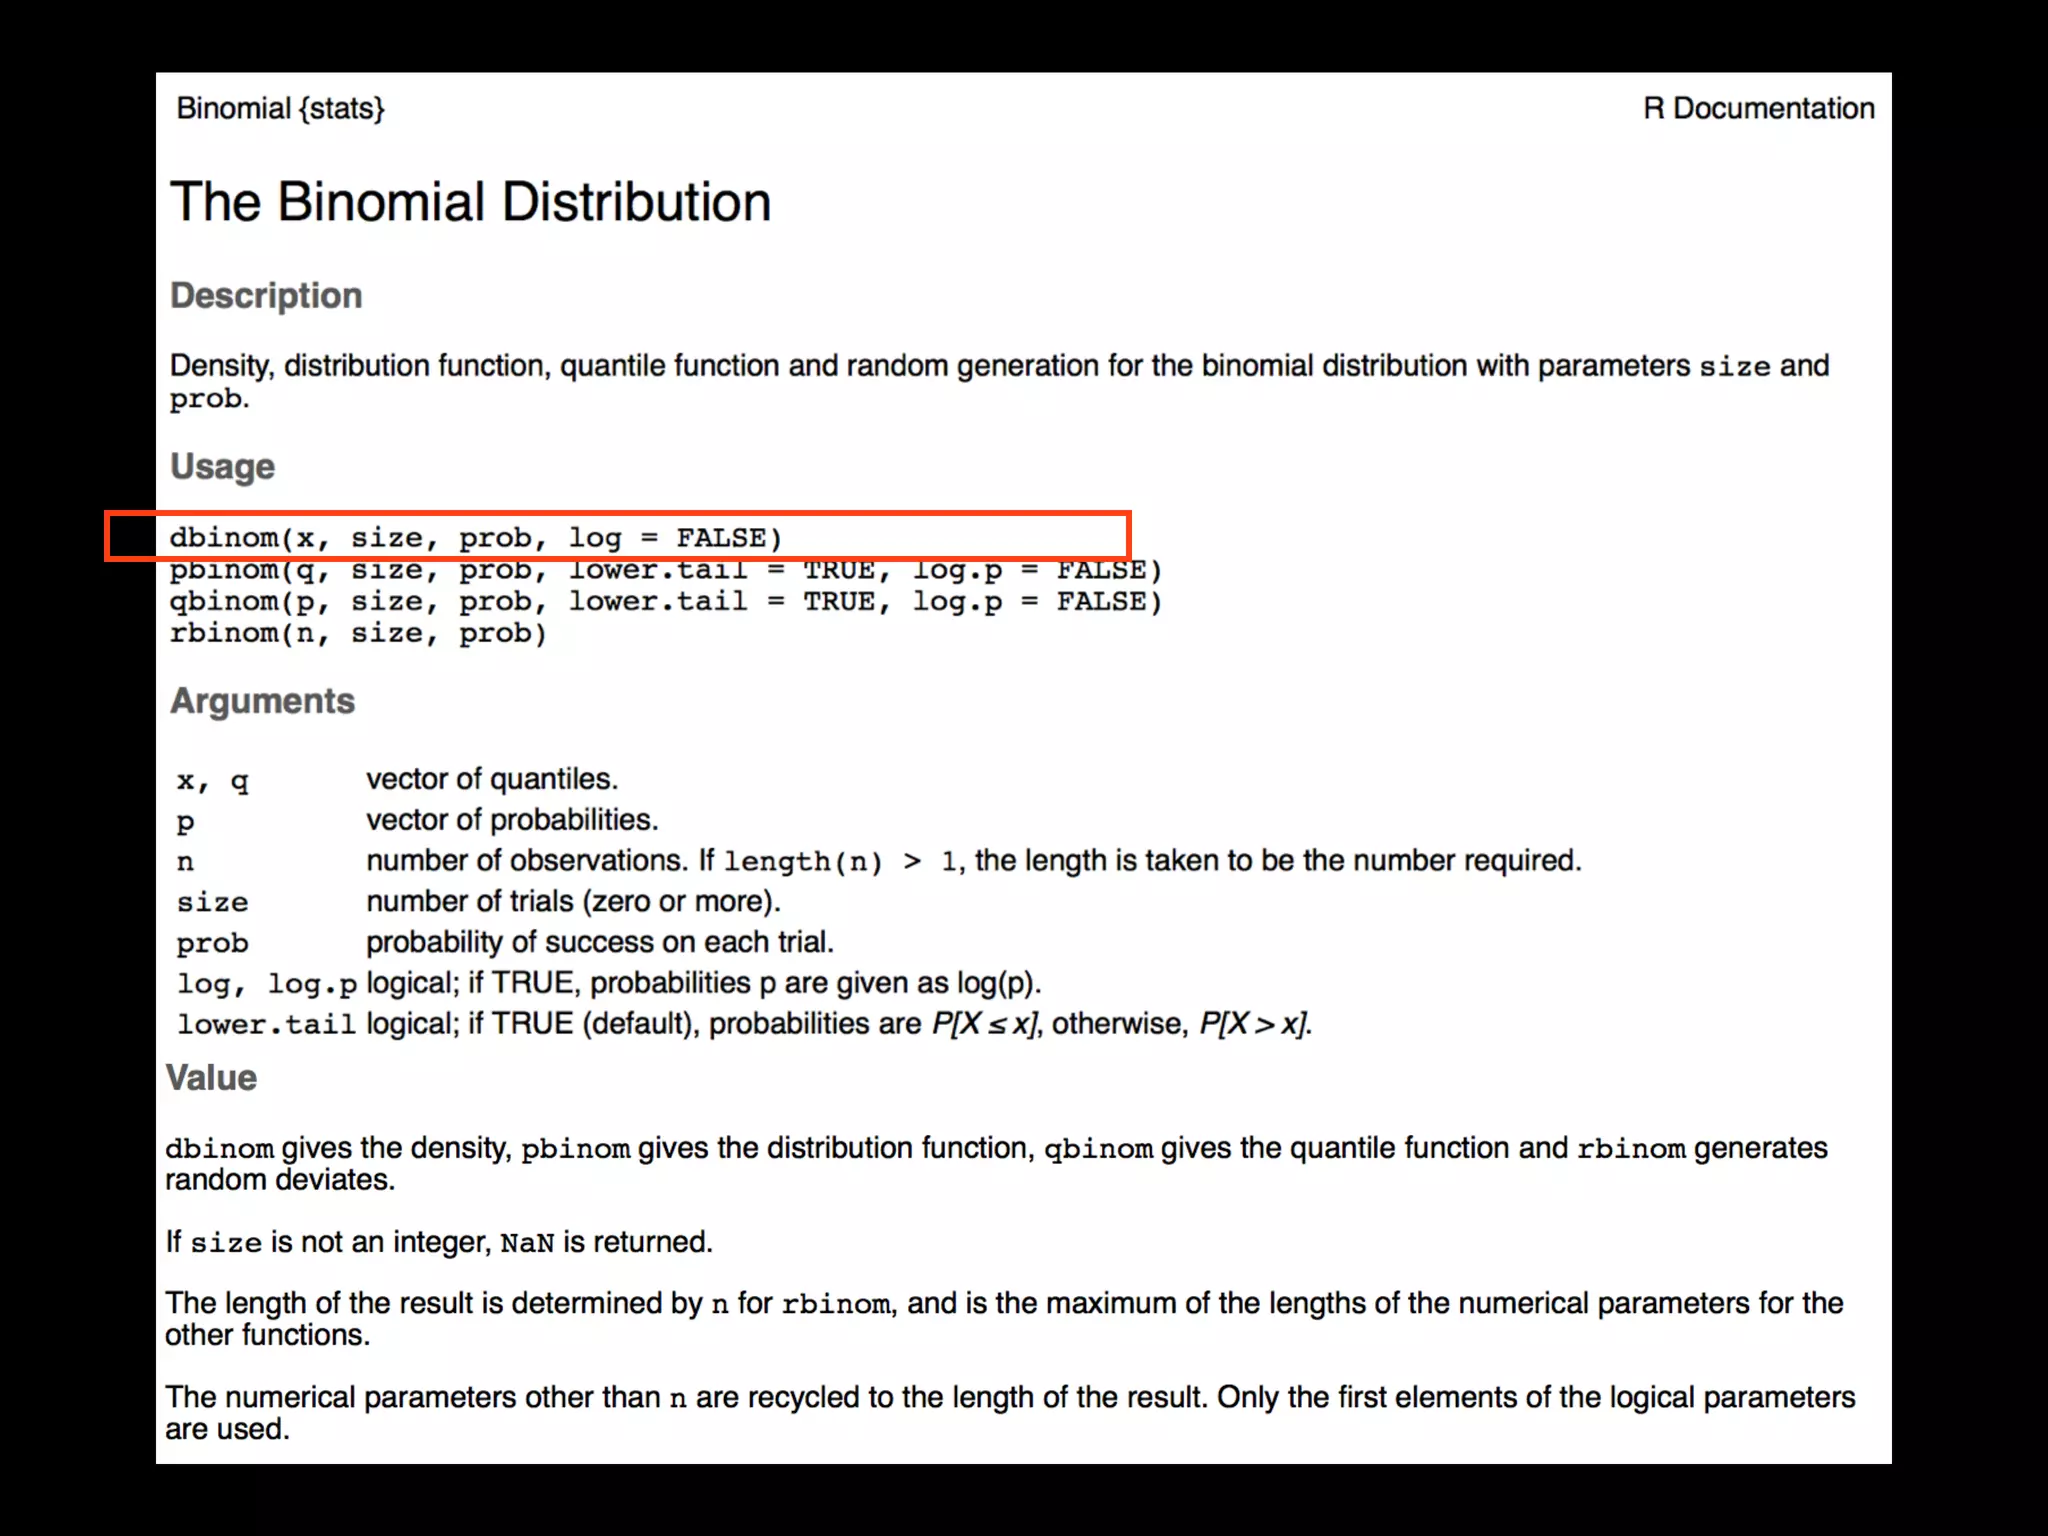
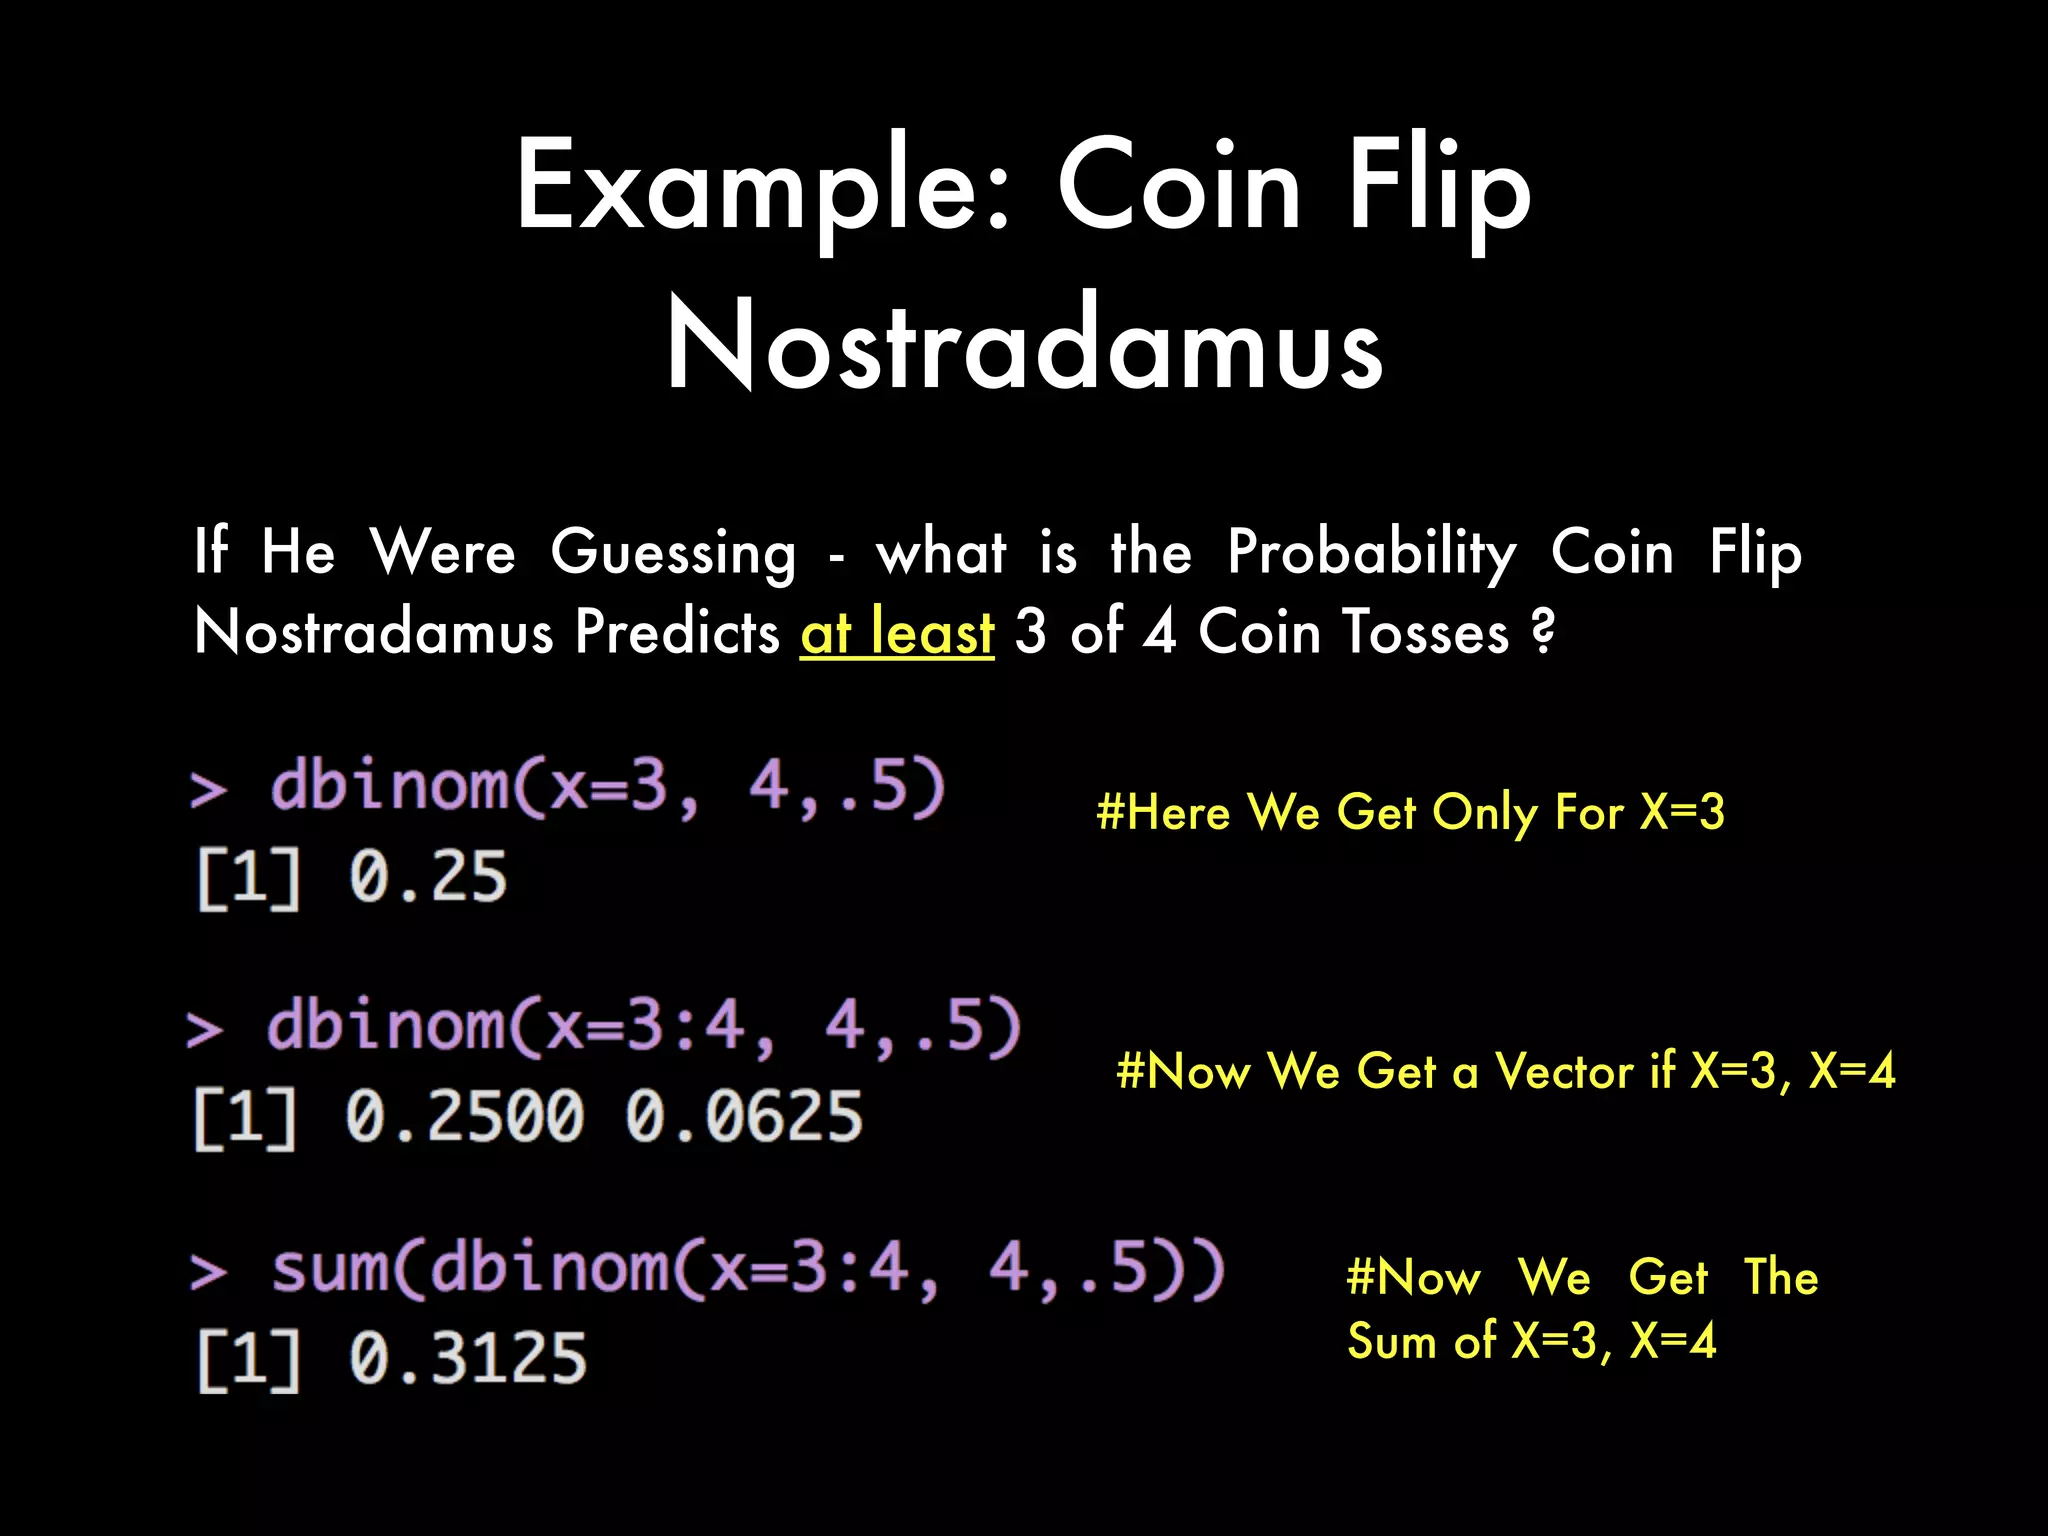
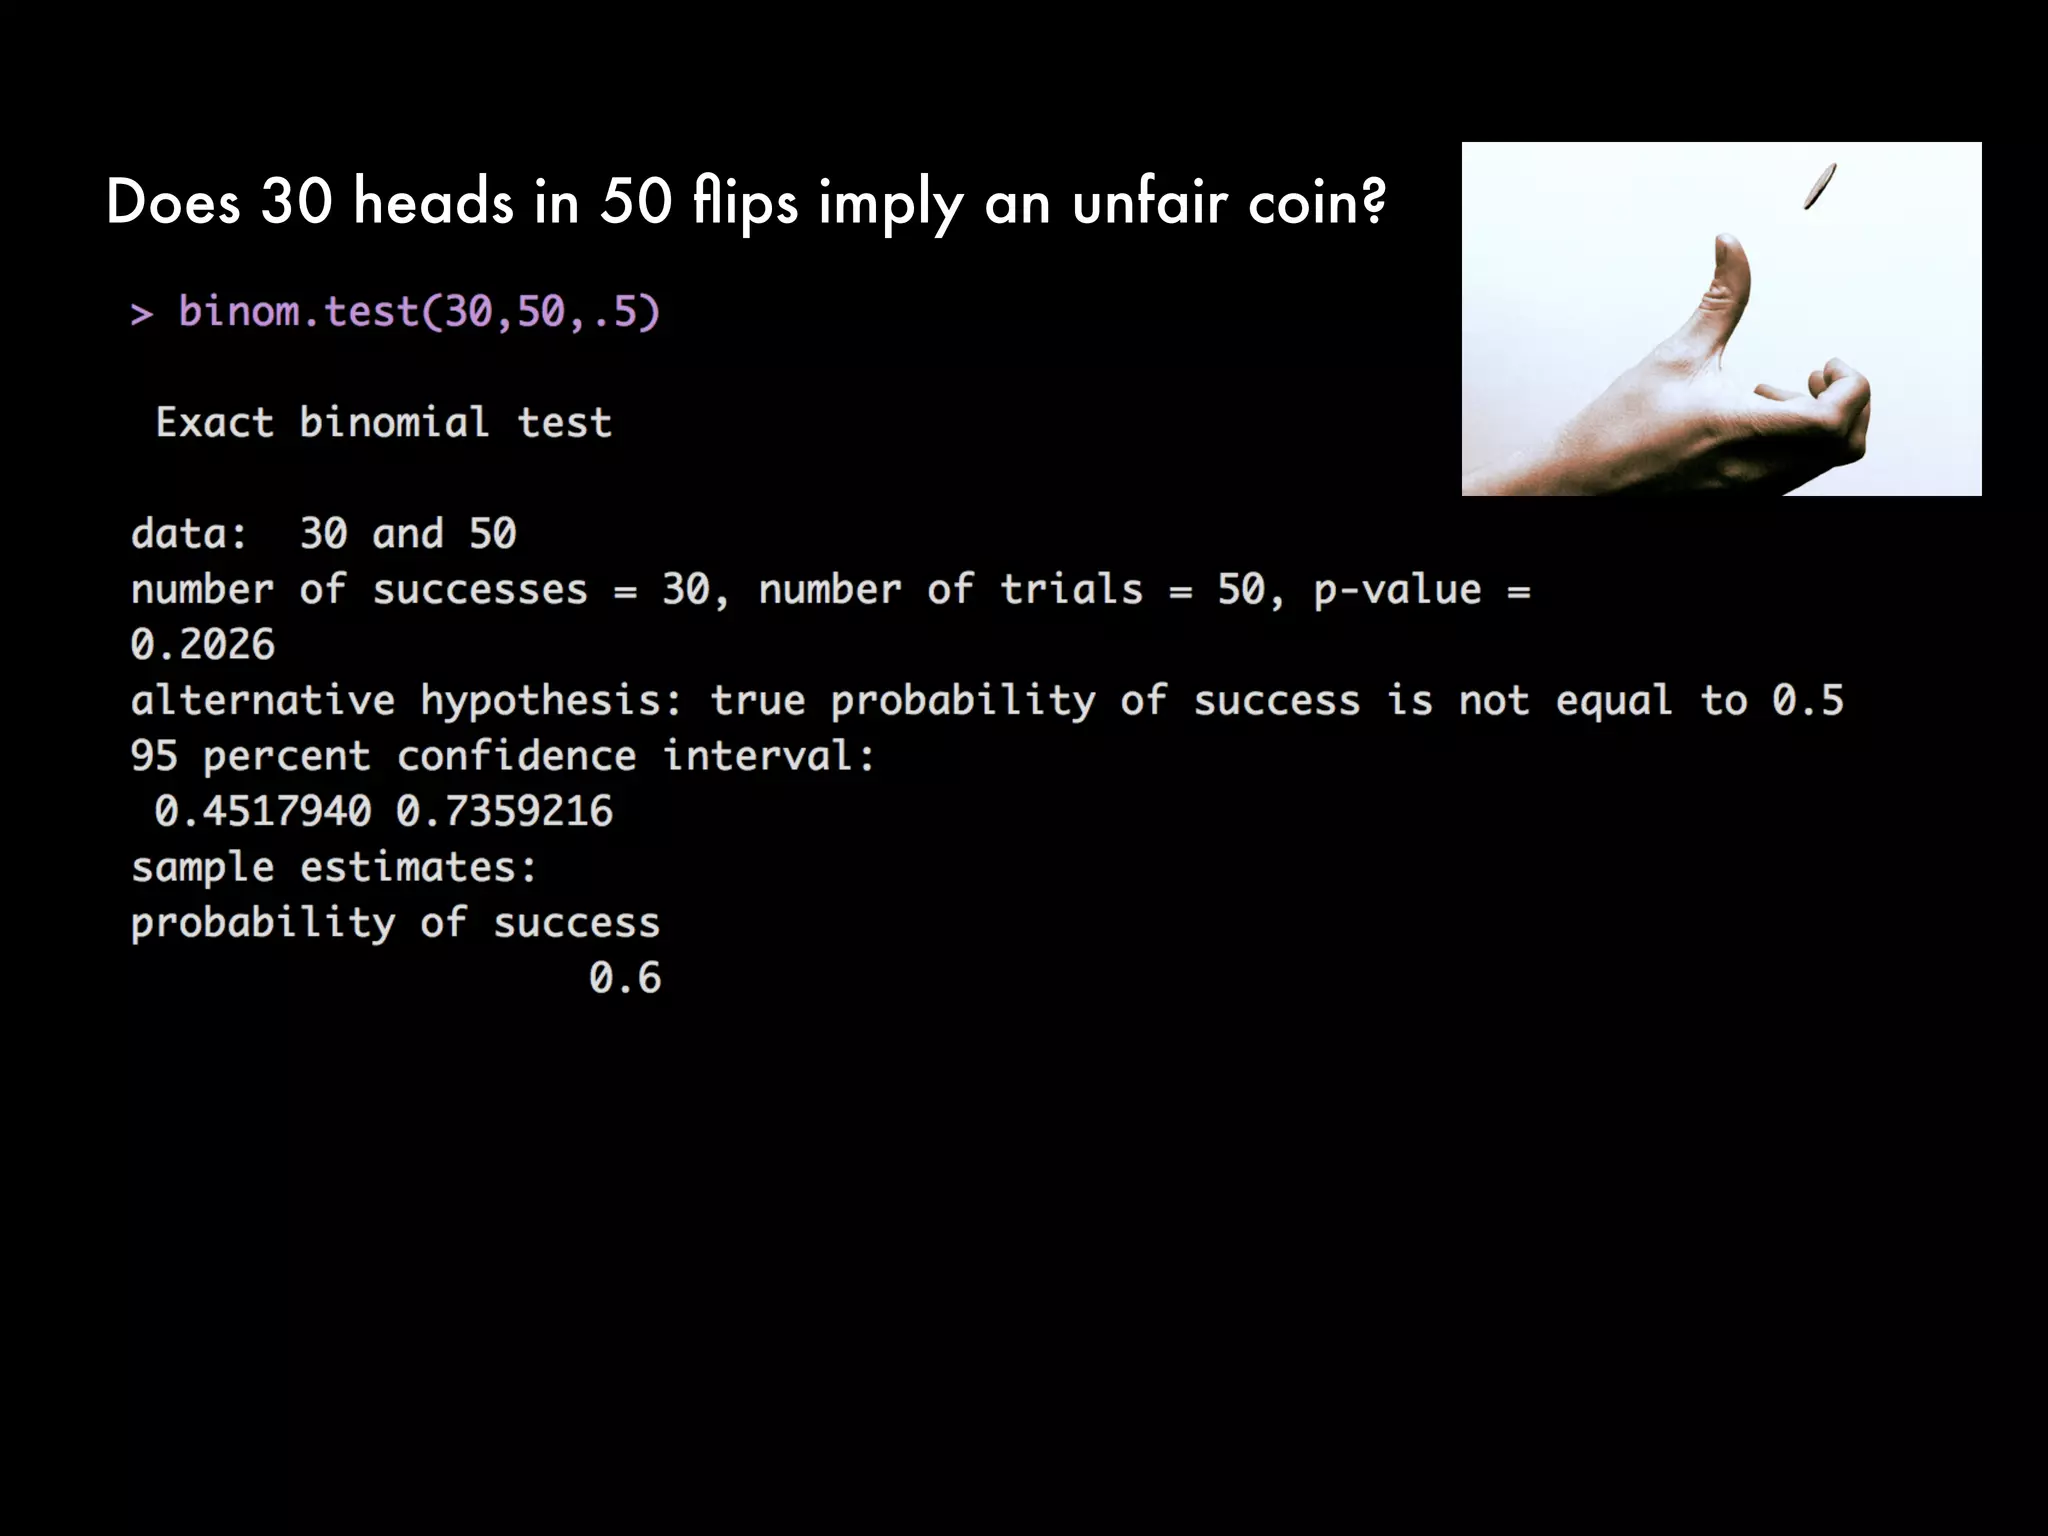
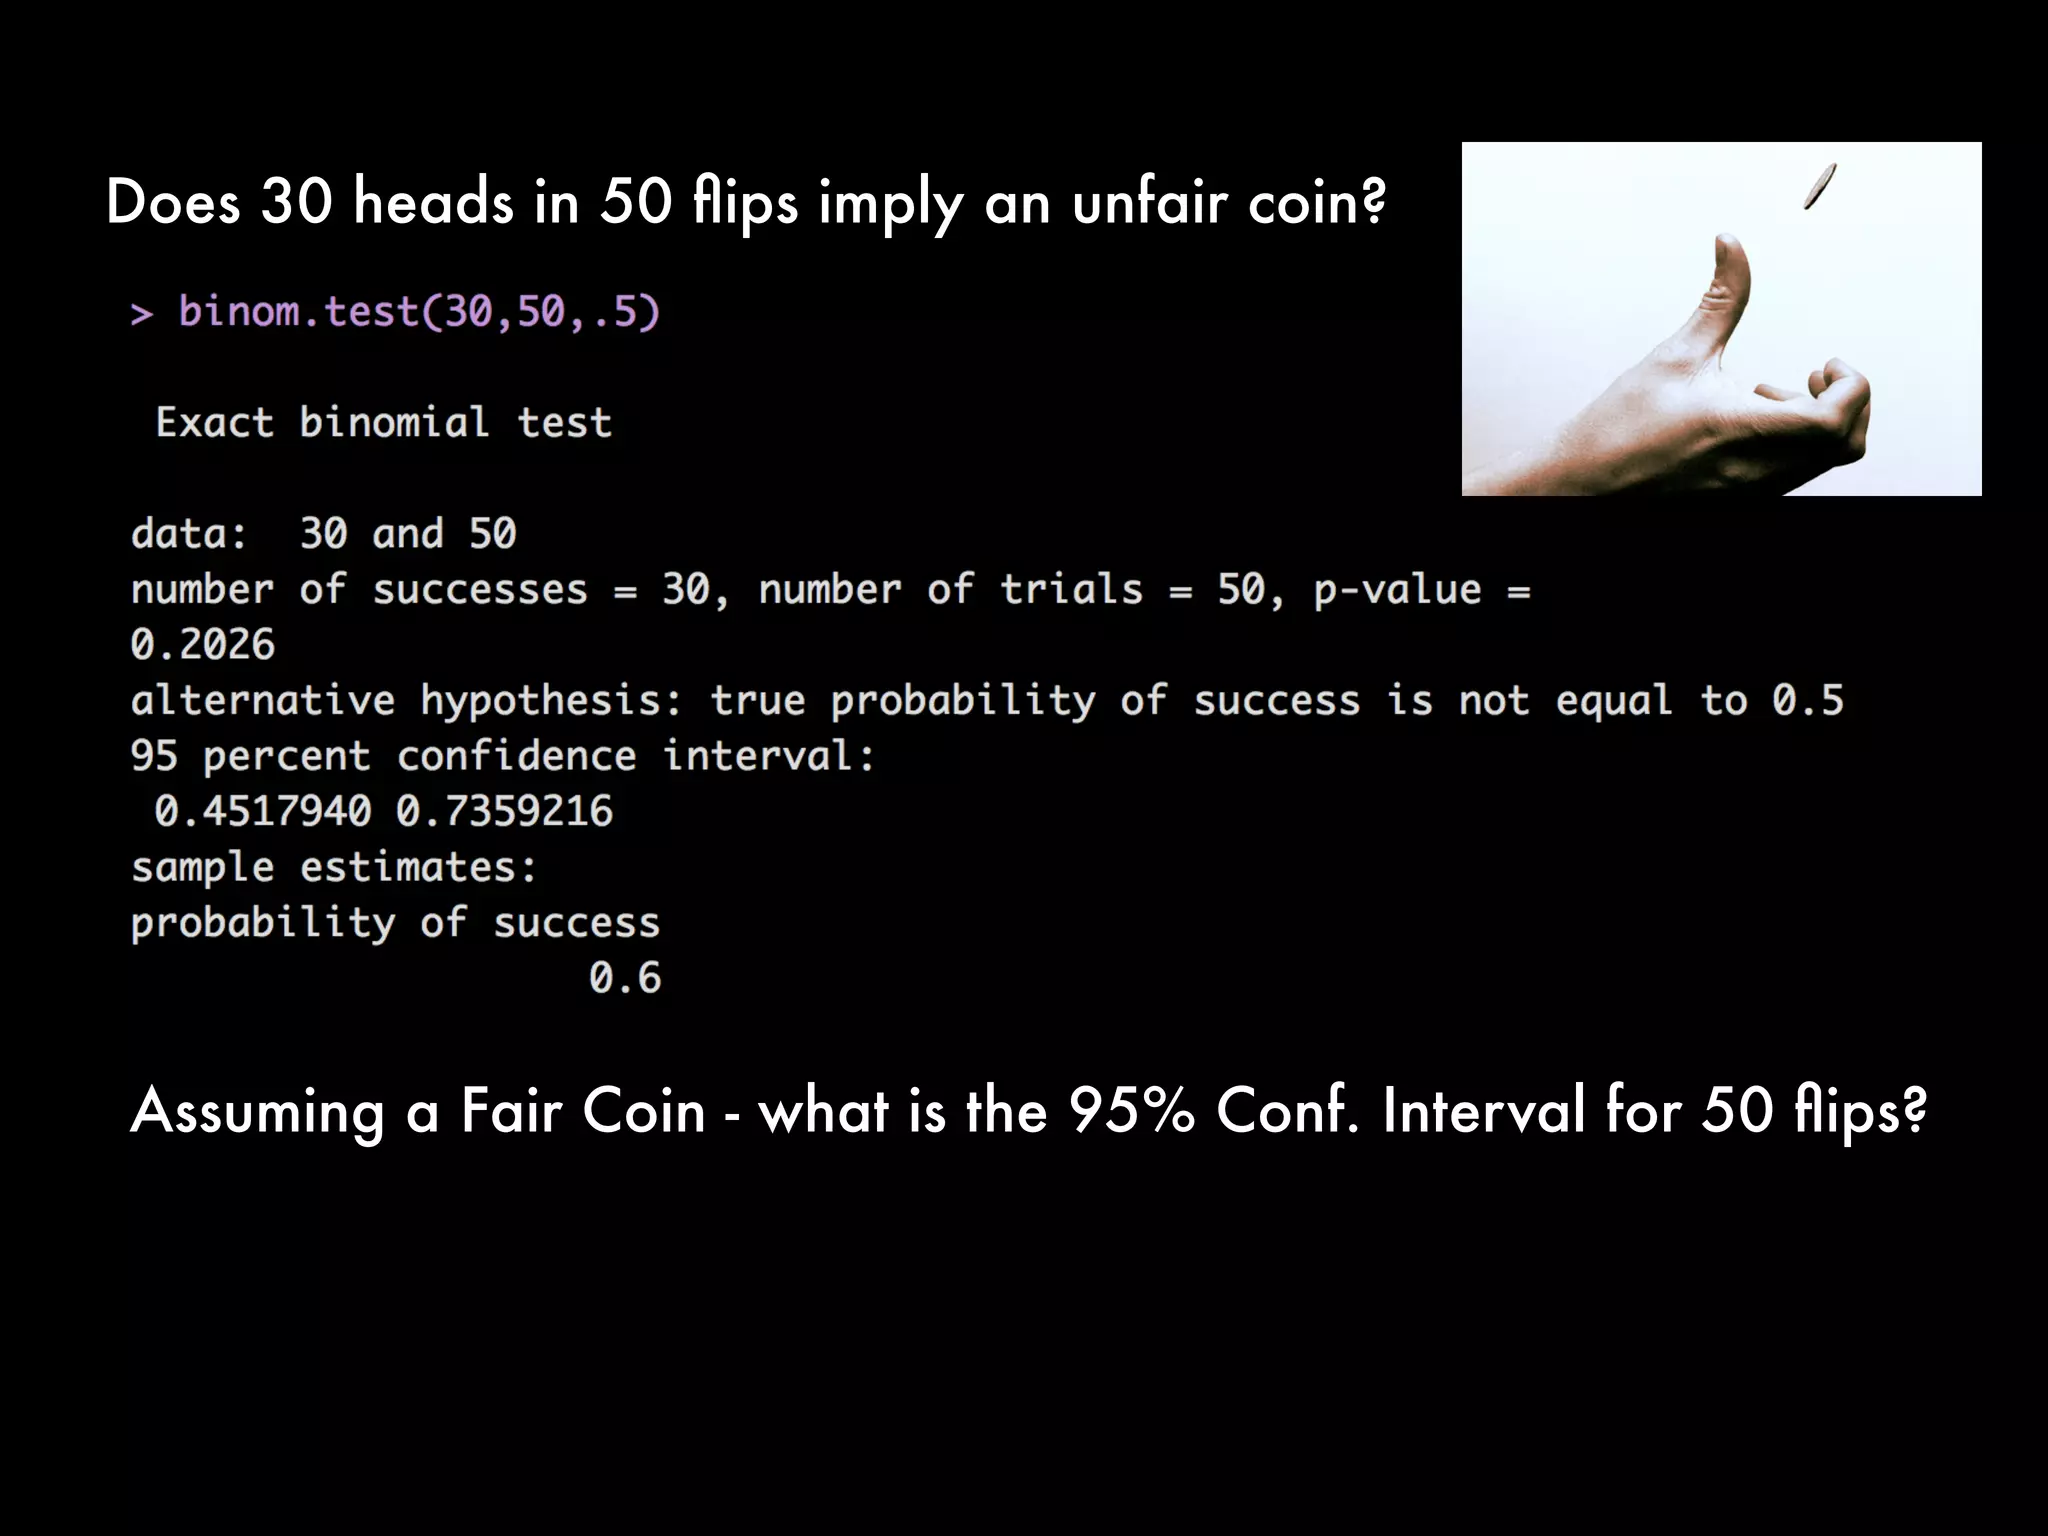
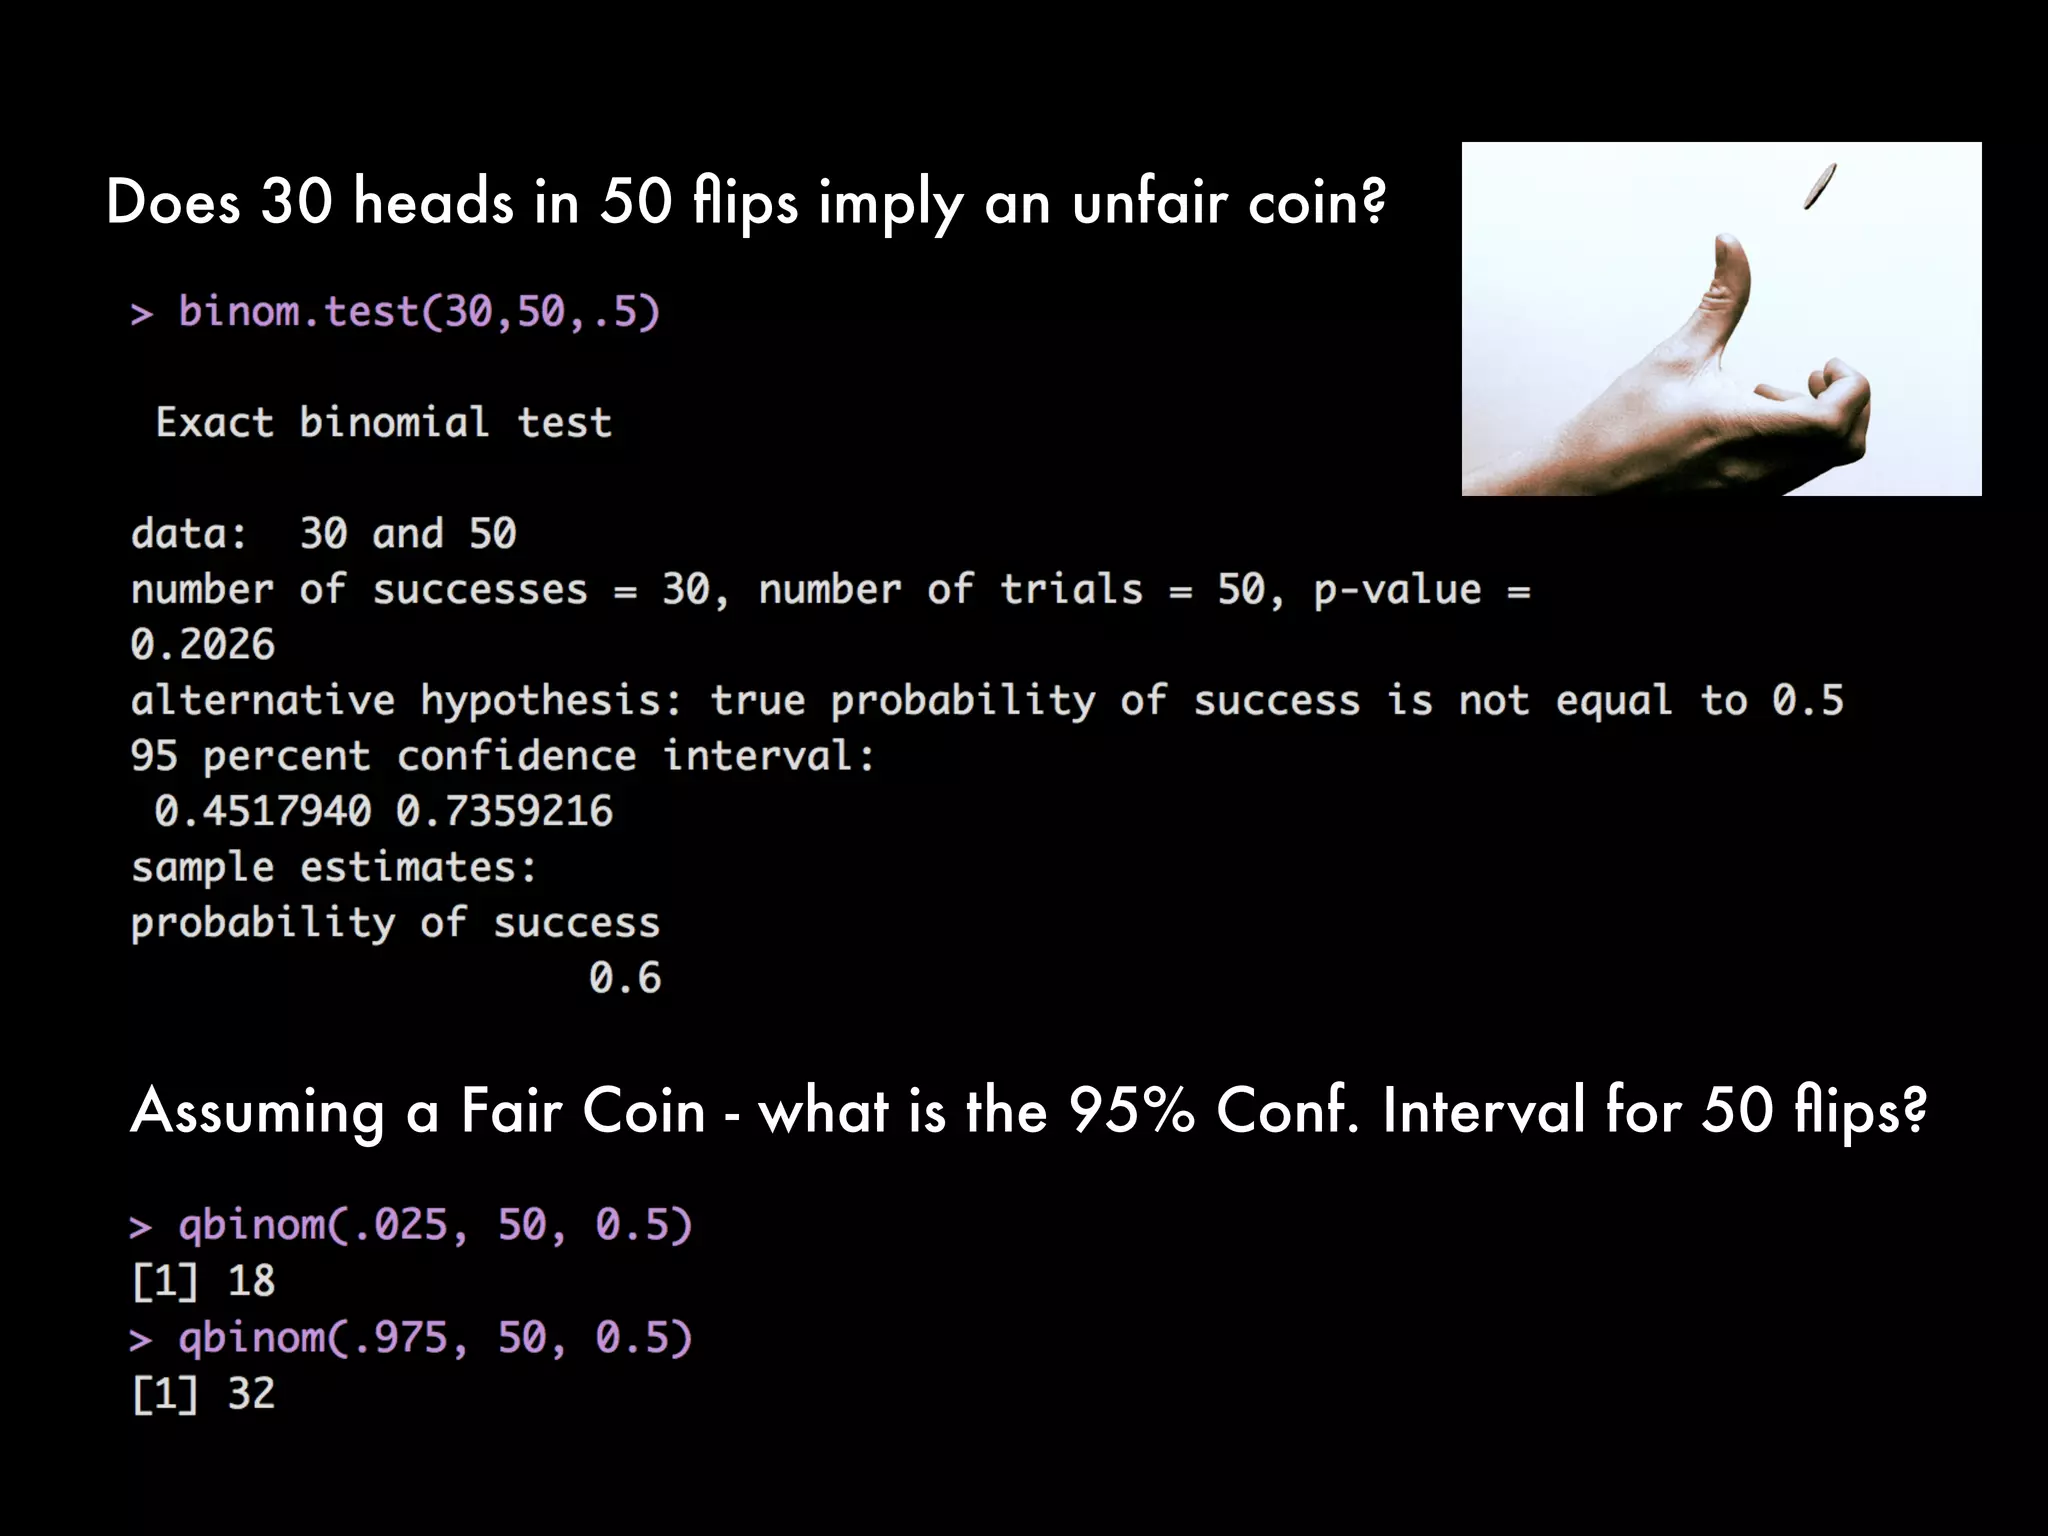
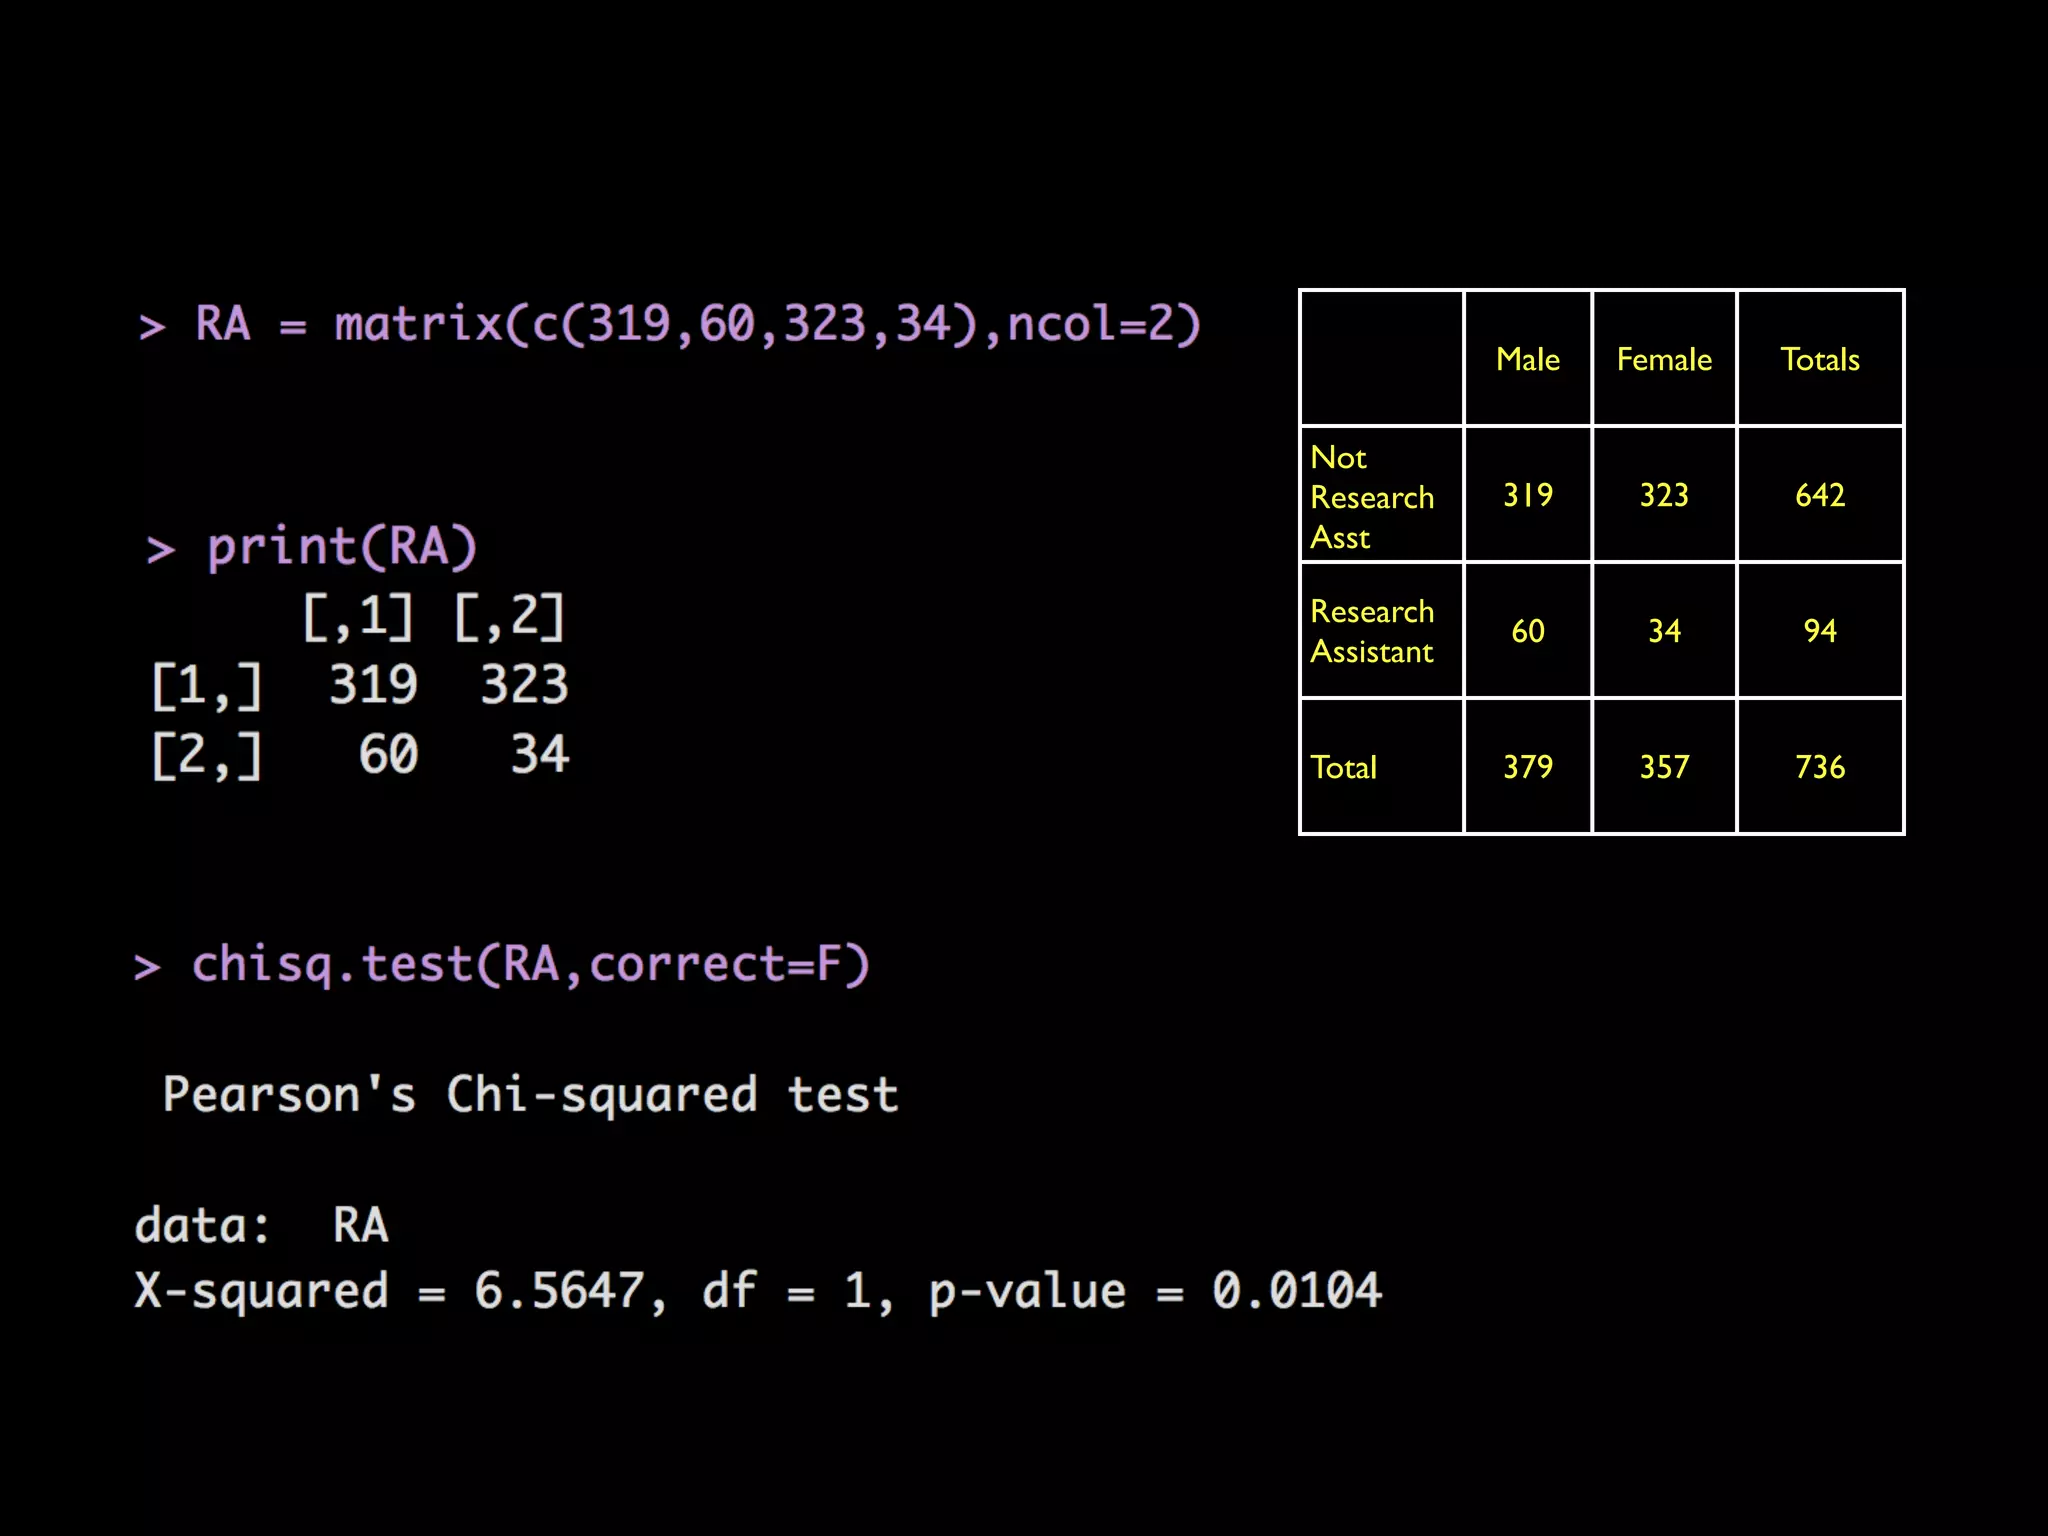
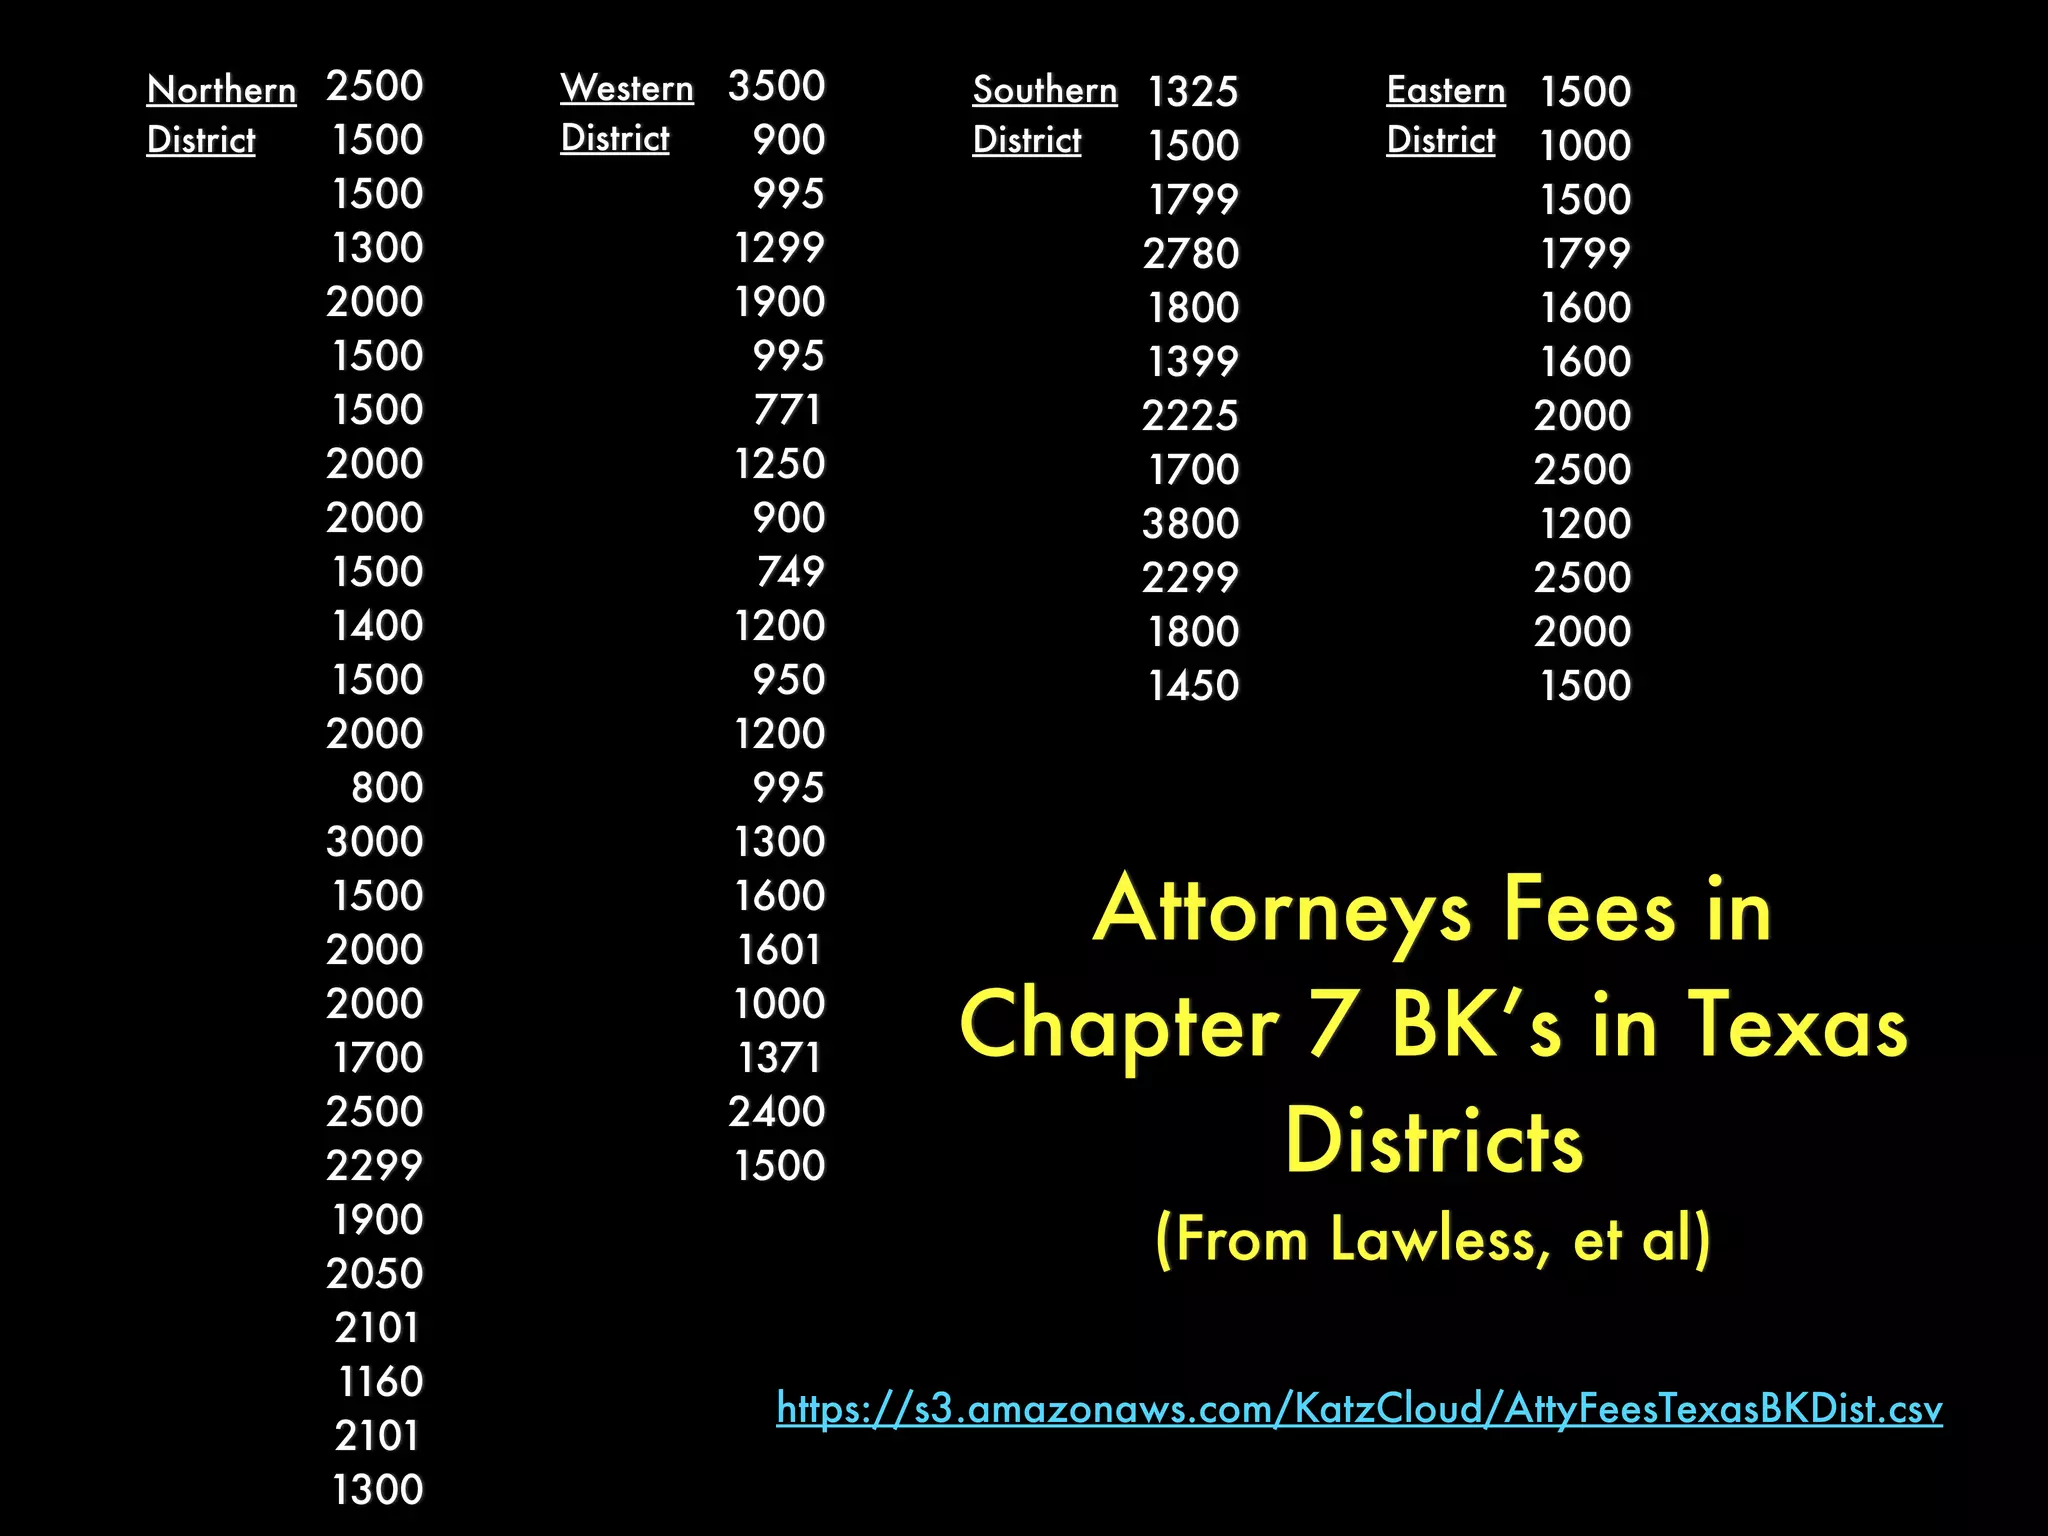
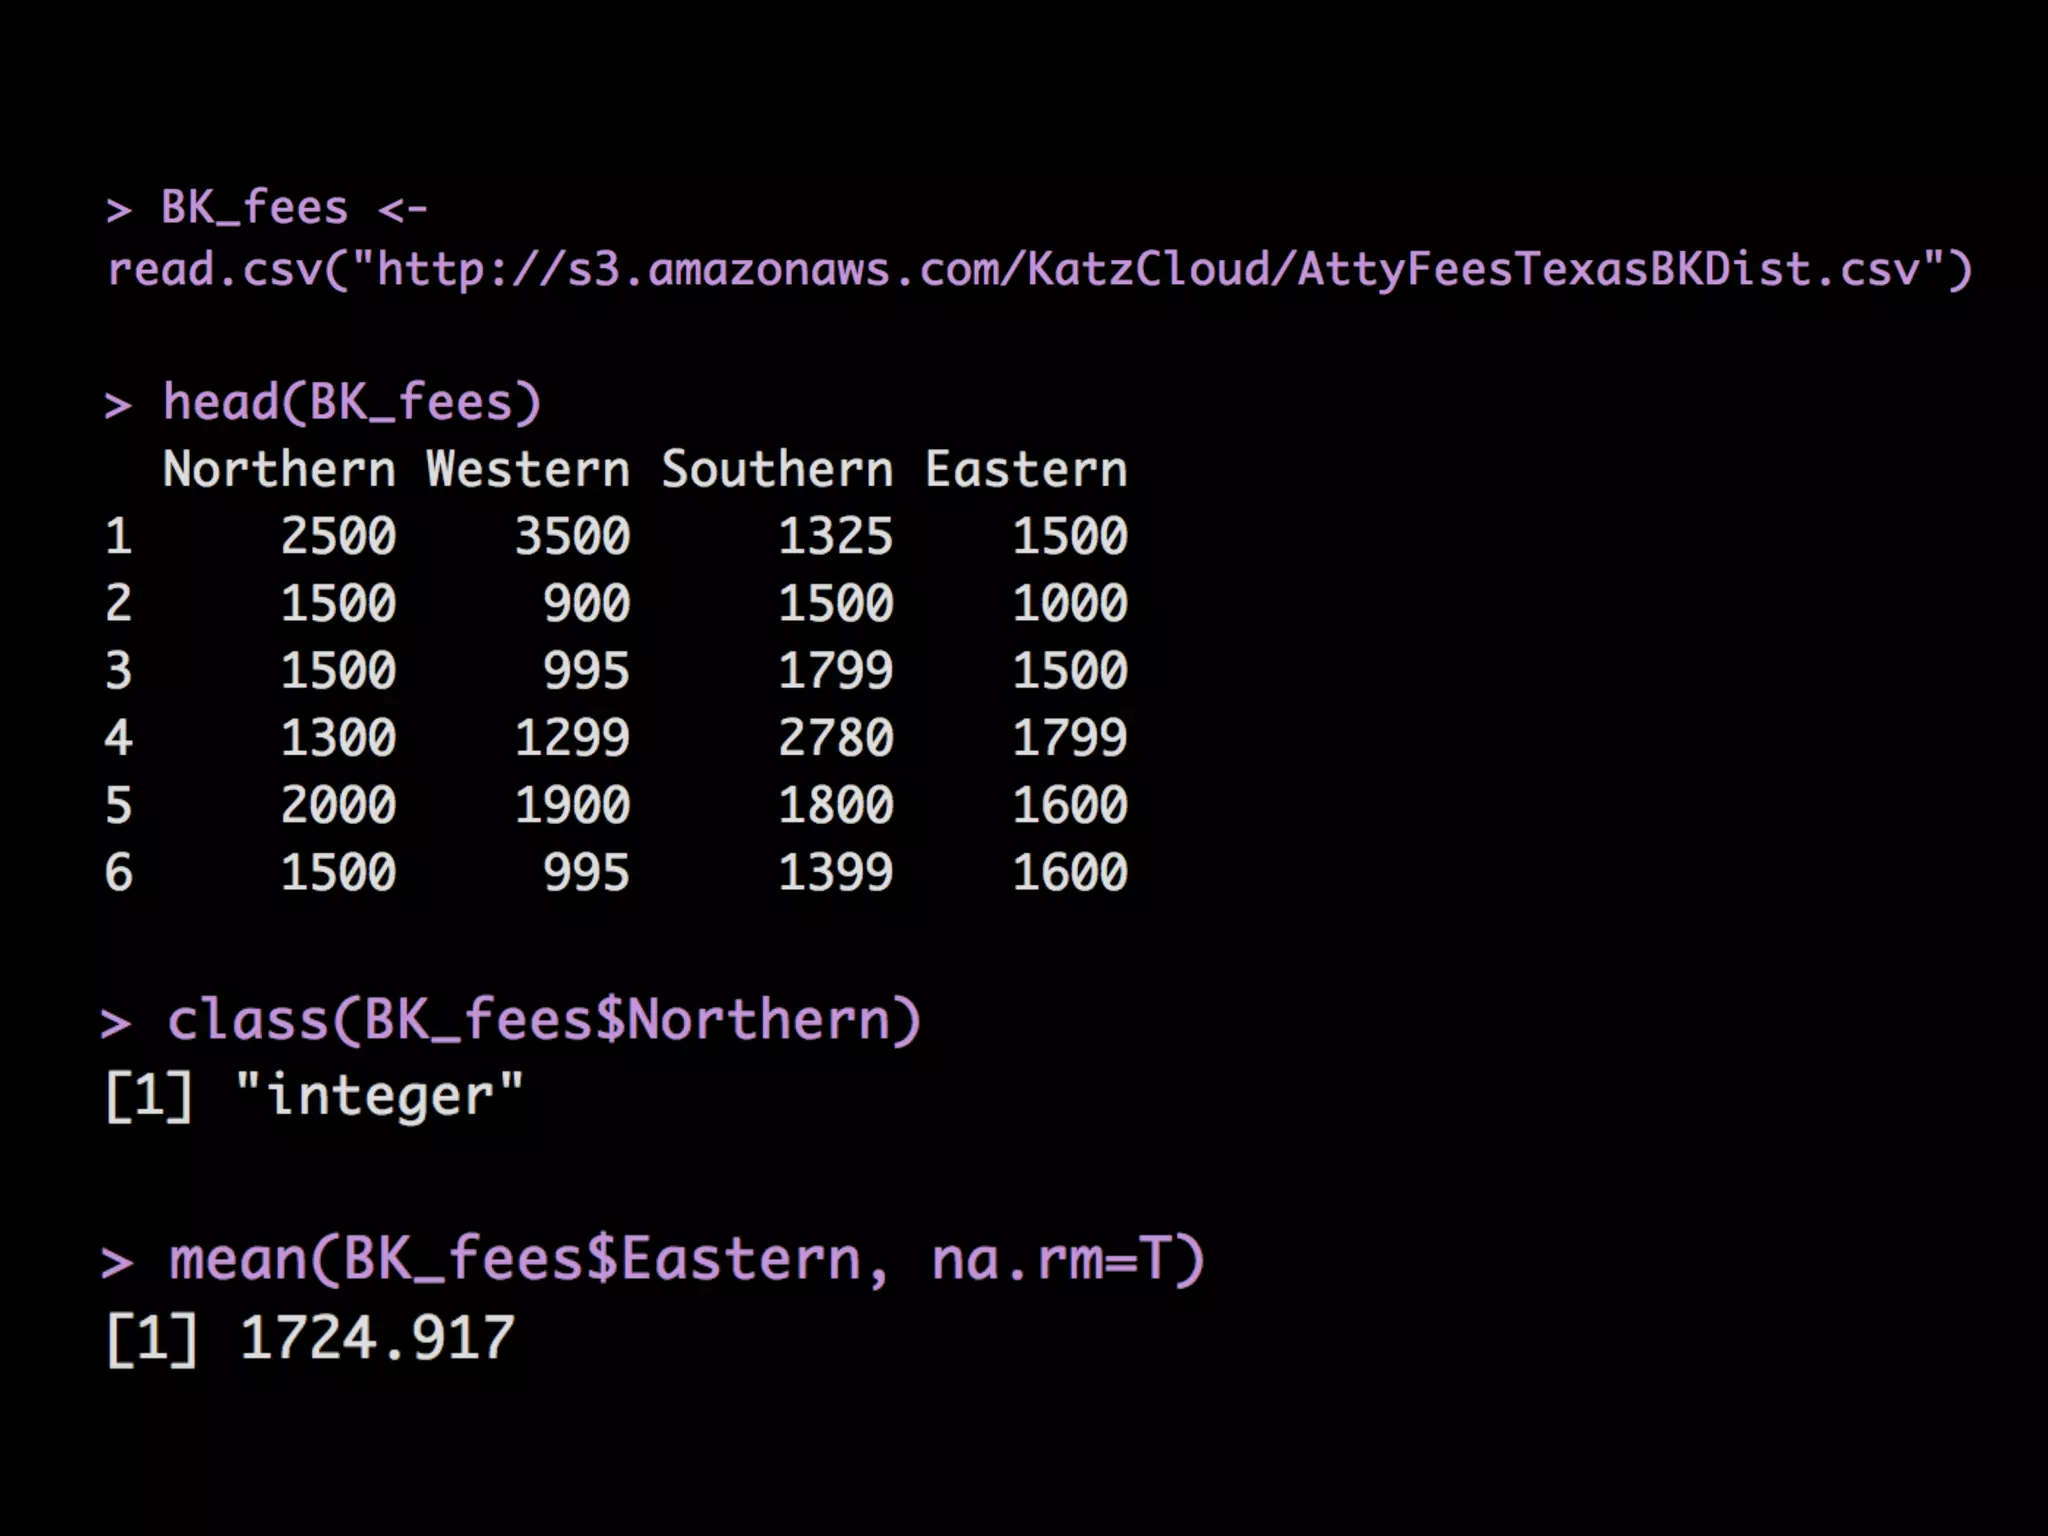
This document provides an overview of statistical tests and calculations using R. It discusses loading and cleaning a dataset, doing basic calculations, and running statistical tests like the binomial distribution, normal distribution, hypothesis testing, chi-squared test, and F test. Examples are provided for each type of analysis, including the R code and interpretation. The goal is to demonstrate how to use R to analyze datasets and evaluate various statistical hypotheses.
Statistical inference: Hypothesis Testing and t-testsEugene Yan Ziyou
This deck was used in the IDA facilitation of the John Hopkins' Data Science Specialization course for Statistical Inference. It covers the topics in week 3 (hypothesis testing and t tests).
The data and R script for the lab session can be found here: https://github.com/eugeneyan/Statistical-Inference
Random Variable
Discrete Probability Distribution
continuous Probability Distribution
Probability Mass Function
Probability Density Function
Expected value
variance
Binomial Distribution
poisson distribution
normal distribution
Please Subscribe to this Channel for more solutions and lectures
http://www.youtube.com/onlineteaching
Chapter 8: Hypothesis Testing
8.3: Testing a Claim About a Mean
Types of Probability Distributions - Statistics IIRupak Roy
Get to know in detail the definitions of the types of probability distributions from binomial, poison, hypergeometric, negative binomial to continuous distribution like t-distribution and much more.
Let me know if anything is required. Ping me at google #bobrupakroy
Probability distribution is a way to shape the sample data to make predictions and draw conclusions about an entire population because most improvement projects and scientific research studies are conducted with sample data rather than with data from an entire population. Probability distribution helps finding all the possible values a random variable can take between the minimum and maximum possible values
Please Subscribe to this Channel for more solutions and lectures
http://www.youtube.com/onlineteaching
Chapter 5: Discrete Probability Distribution
5.2 - Binomial Probability Distributions
inferential statistics, statistical inference, language technology, interval estimation, confidence interval, standard error, confidence level, z critical value, confidence interval for proportion, confidence interval for the mean, multiplier,
Please Subscribe to this Channel for more solutions and lectures
http://www.youtube.com/onlineteaching
Chapter 8: Hypothesis Testing
8.3: Testing a Claim About a Mean
Types of Probability Distributions - Statistics IIRupak Roy
Get to know in detail the definitions of the types of probability distributions from binomial, poison, hypergeometric, negative binomial to continuous distribution like t-distribution and much more.
Let me know if anything is required. Ping me at google #bobrupakroy
Probability distribution is a way to shape the sample data to make predictions and draw conclusions about an entire population because most improvement projects and scientific research studies are conducted with sample data rather than with data from an entire population. Probability distribution helps finding all the possible values a random variable can take between the minimum and maximum possible values
Please Subscribe to this Channel for more solutions and lectures
http://www.youtube.com/onlineteaching
Chapter 5: Discrete Probability Distribution
5.2 - Binomial Probability Distributions
inferential statistics, statistical inference, language technology, interval estimation, confidence interval, standard error, confidence level, z critical value, confidence interval for proportion, confidence interval for the mean, multiplier,
Presentation that I made for my English course. I used data collected using google analytics to compare site effiency before and after my redesign of gelvoc.com. Especially facebook integration appeared to have a huge effect on the number of visitors.
Topic 4 nutrition part 2 : COMPILED from Various resourcesSHAKINAZ DESA
Describe the function of digestive systems in animals.
Identify the needs of nutrition in plants.
Describe the transportation of water and nutrients in plants
The Science Behind Resistance to Change: What the Research Says & How it Can...KaiNexus
Presented by Mark Jaben, MD
In this webinar, you will learn:
How people form opinions about the validity of continuous improvement
Then neuroscience behind why it's so hard to change minds
Why simply getting "buy-in" doesn't always work
What you need to do to sway opinions, increase engagement, and spread improvement
Growth Hacking Mobile Apps: 3 Critical Growth Tactics Urban Airship
So what do we mean by “growth hacking?” Or the more accurate name for it is “growth marketing.” Growth marketing can drive huge returns, and it has a few characteristics.
The way you interact with the product team. Before, marketers are thinking about acquisition, or branding, or email campaigns, or press releases. They aren’t really thinking in terms of the product. But in the growth marketing mindset, they’re sitting with the product team.
Their goals. Growth marketers are evaluating opportunities across the entire funnel and picking the ones that are the most strategically important.
Their use of data. Growth marketing is about challenging that assumption and using data to drive real results. And this is what enables you to be really creative -- that you know what is or isn’t working.
Testing. This is the flipside of data, right? That we use the data to run experiments, to refine our thinking, and to see what’s working and what isn’t.
Use of technology. There are literally thousands of VC-backed companies in the martech space now. But the growth marketing mindset is to view this as an opportunity, not a barrier. If I choose the right content management system for my website, I can make updates faster and my site renders more quickly, which means I rank better in Google. Growth marketers understand and use technology.
AND IT IS NOT JUST STARTUPS
The Future of User Engagement Through Apps and IoT Urban Airship
Develop engaging mobile for the Internet of Things and a seamless experience. Presented by Product Manager of Mobile Engagement, Greg Weinger at Apps World Germany.
Greg shared with the audience:
>The keys to gaining user attention
>Industry examples of recent success
>Utility + personalization - the equation for app growth
>Required APIs for customer engagement
>Apps of the future
To find out more, please visit urbanairship.com or call us at +1 (855) 385-3155, or +44 (0)300 303 8796.
Applying Lean Thinking to Legal-Service Delivery - Lean Process Improvement a...Daniel W. Linna Jr.
Applying Lean Thinking to Legal-Service Delivery - Lean Process Improvement and Agile Project Management - An Initial Presentation by Jim Manley and Daniel W. Linna Jr. at Detroit Legal Innovation and Technology Meetup on 2014-07-15
The Mobile Engagement Playbook - Going from Good to Great Urban Airship
There are strategies to shift from good push notifications to great engagement with loyal brand advocates.
Do you use push notifications in your app? In-app messaging? Are you targeting your mobile messaging to specific users?
There is so much more precision we can use in our messaging today. Consumers have so much more control they can apply to their media consumption.
Learn more here and please reach out to Urban Airship with any questions on mobile engagement marketing or developer strategies.
F ProjHOSPITAL INPATIENT P & L20162017Variance Variance Per DC 20.docxmecklenburgstrelitzh
F ProjHOSPITAL INPATIENT P & L20162017Variance Variance %Per DC 2016Per DC 2017Total Number of Beds149149Maximum Occupancy55,74554,561Total Patient Days37,25037,926Actual Occupancy %ALOSDischarges by PayerMedicare/Medicaid4,9224,989Commercial Ins5,2415,099Private Pay/Bad Debt1,2801,162Total DischargesREVENUEGross Patient Revenue$ 161,325,872$ 135,365,715Contract Allowances, Uncollectables$ (84,696,083)$ (65,680,261) Net Patient RevenueMisc Income$ 378,530$ 303,233 NET REVENUEPatient Care Expenses Salaries $ 18,387,223$ 18,244,610Benefits $ 4,140,146$ 4,211,157Contract Labor $ 1,724,507$ 1,820,377Physician Contract Services$ 6,439,165$ 6,335,188Lab Services $ 1,589,648$ 1,575,808Radiology Services$ 2,336,043$ 2,343,920Rehabilitation Services$ 655,766$ 679,444General Supplies $ 653,941$ 689,766Medical Supplies $ 1,006,220$ 1,029,151Cost of Food $ 576,245$ 612,890Patient Transportation $ 35,324$ 36,031Total Patient Care ExpensesGeneral and Administrative ExpensesSalaries$ 8,450,134$ 8,629,126Benefits$ 2,001,199$ 1,993,174Contract Labor$ 157,925$ 161,015Purchased Services $ 1,285,925$ 1,355,602Medical Director $ 162,909$ 167,207Telephone$ 586,985$ 596,466Meals & Entertainment $ 254,517$ 289,185Travel$ 126,951$ 141,561General Supplies $ 332,069$ 337,874Postage$ 53,760$ 57,383Building Expense$ 2,685,376$ 2,950,379Equipment Rents $ 363,302$ 429,694Repairs and Maintenance $ 337,711$ 366,311Insurance$ 644,384$ 715,563Utilities $ 504,959$ 556,226Total General and Administrative ExpensesNet Operating Expenses NET PROFIT (LOSS) before Interest, Taxes and Depreciation (EBITDA)NET PROFIT (LOSS) %2017CASH FLOW 2016RELEVANT FINANCIAL RATIOS 2016What is your average Daily Revenue?Return on Assets (ROA)Return on Assets (ROA)Assume your AR Days are 55, what is your Total AR?Return on Equity (ROE)Return on Equity (ROE)What is your Average Daily Expense?Current RatioCurrent RatioAssume your AP Days are 35, what is your total AP?Debt RatioDebt RatioBALANCE SHEET 2016ASSETS Cash and EquivalentsAssume 45 days of ExpensesAssume 45 days of Expenses Accounts Receivable$ - 0$ - 0 Inventory All SuppliesAssume 55 days of suppliesAssume 55 days of suppliesTotal Current AssetsFixed Assets:xxxxxxxxxxxxxxxxxxxxxxxxxxxx Bldg and Equipment$ 14,700,779$14,700,779Total AssetsLIABILITIES AND EQUITYCurrent Liabilitiesxxxxxxxxxxxxxxxxxxxxxxxxxxxx Accounts Payable$ - 0$0Long Term Debtxxxxxxxxxxxxxxxxxxxxxxxxxxxx Bldg and Equipment$ 8,149,152$8,149,152Total LiabilitiesEquityTotal Liabilities and EquityITEMSPOINT VALUEOccupany Calcs2Hospital Cols B & C3Variance (2014-2013) $ and %2PPD 2013 - 20142Cash flow 20142Balance Sheet Calculations5Relevant Financial Ratios4Sub-Total20
35879 Topic: Discussion6
Number of Pages: 1 (Double Spaced)
Number of sources: 1
Writing Style: APA
Type of document: Essay
Academic Level:Master
.
Join CMT Level 1, 2 & 3 Program Courses & become a professional Technical Analyst, CMT USA Best COACHING CLASSES. CMT Institute Live Classes by Expert Faculty. Exams are available in India. Best Career in Financial Market.
https://www.ptaindia.com/chartered-market-technician/
35880 Topic Discussion7Number of Pages 1 (Double Spaced).docxdomenicacullison
35880 Topic: Discussion7
Number of Pages: 1 (Double Spaced)
Number of sources: 1
Writing Style: APA
Type of document: Essay
Academic Level:Master
Category: Psychology
Language Style: English (U.S.)
Order Instructions: Attached
I will attach the instruction
Please follow them carefully
Discussion3: Please discuss, elaborate and give example on the topic below. Please use only the reference I attach. Please be careful with grammar and spelling. No running head please.
Author: Jackson, S.L. (2017). Statistics Plain and Simple (4th ed.): Cengage Learning
Topic:
You find out that the average 10th grade math score, for Section 6 of the local high school, is 87 for the 25 students in the class. The average test score for all 10th grade math students across the state is 85 for 1,800 students. The standard deviation for the state is 3.8.
Answer the following questions:
· What z score do you calculate?
· What is the area between the mean and the z score found in Appendix A of the textbook?
· What does this mean about the probability of this test score difference occurring by chance? Is it
less than 0.05?
Reference
Module 9: The Single-Sample z Test
The z Test: What It Is and What It Does
The Sampling Distribution
The Standard Error of the Mean
Calculations for the One-Tailed z Test
Interpreting the One-Tailed z Test
Calculations for the Two-Tailed z Test
Interpreting the Two-Tailed z Test
Statistical Power
Assumptions and Appropriate Use of the z Test
Confidence Intervals Based on the z Distribution
Review of Key Terms
Module Exercises
Critical Thinking Check Answers
Module 10: The Single-Sample t Test
The t Test: What It Is and What It Does
Student's t Distribution
Calculations for the One-Tailed t Test
The Estimated Standard Error of the Mean
Interpreting the One-Tailed t Test
Calculations for the Two-Tailed t Test
Interpreting the Two-Tailed t Test
Assumptions and Appropriate Use of the Single-Sample t Test
Confidence Intervals Based on the t Distribution
Review of Key Terms
Module Exercises
Critical Thinking Check Answers
Chapter 5 Summary and Review
Chapter 5 Statistical Software Resources
In this chapter, we continue our discussion of inferential statistics—procedures for drawing conclusions about a population based on data collected from a sample. We will address two different statistical tests: the z test and t test. After reading this chapter, engaging in the Critical Thinking checks, and working through the problems at the end of each module and at the end of the chapter, you should understand the differences between the two tests covered in this chapter, when to use each test, how to use each to test a hypothesis, and the assumptions of each test.
MODULE 9
The Single-Sample z Test
Learning Objectives
•Explain what a z test is and what it does.
•Calculate a z test.
•Explain what statistical power is and how to make statistical tests more powerful.
•List the assumptions of the z test.
•Calculate confidence intervals usi.
35878 Topic Discussion5Number of Pages 1 (Double Spaced).docxrhetttrevannion
35878 Topic: Discussion5
Number of Pages: 1 (Double Spaced)
Number of sources: 1
Writing Style: APA
Type of document: Essay
Academic Level:Master
Category: Psychology
Language Style: English (U.S.)
Order Instructions: Attached
I will attach the instruction
Please follow them carefully
General Business Page 9
Unit 4
Due Wed 12/12
800-1,000 words / these will be turned into slides and added to your key assignment.
Study the following document: Methods for Managing Differences. Assume this communication strategy has been recommended by your employer for mediation when working with potential and existing business clients and partners.
Consider that there are basically two distinct types of cultures. One type is more cooperative, and the other is more competitive. It has been discovered that there are some conflicts occurring between some of the key players who need to come to agreement on specific critical areas of the deal for it to move forward. The top management would really like this deal to happen.
Imagine being in this situation, and create the scenario as you go through the process using the methods approach from above.
· Describe the steps you would take and any considerations along the way.
· How would you use the recommended method when working with individuals who exhibit a generally competitive culture?
· How would you use the recommended method when working with individuals who exhibit a generally cooperative culture?
· Would this cultural factor change the way you apply this method for managing differences? Why or why not? Explain.
Create Section 4 of your Key Assignment presentation: Global Negotiations. Refer to Unit 1 Discussion Board 2 for a description of this section. Submit a draft of your entire presentation for your instructor to review.
Discussion 2: Discuss, elaborate and give example on the topic below. Please use only the reference I attach. Please be careful with grammar and spelling. No running head Please.
Author: Jackson, S.L. (2017). Statistics Plain and Simple (4th ed.): Cengage Learning
Topic
Review this week’s course materials and learning activities, and reflect on your learning so far this week. Respond to one or more of the following prompts in one to two paragraphs:
1. Provide citation and reference to the material(s) you discuss. Describe what you found interesting regarding this topic, and why.
2. Describe how you will apply that learning in your daily life, including your work life.
3. Describe what may be unclear to you, and what you would like to learn.
Reference:
Module 9: The Single-Sample z Test
The z Test: What It Is and What It Does
The Sampling Distribution
The Standard Error of the Mean
Calculations for the One-Tailed z Test
Interpreting the One-Tailed z Test
Calculations for the Two-Tailed z Test
Interpreting the Two-Tailed z Test
Statistical Power
Assumptions and Appropriate Use of the z Test
Confidence Intervals Based on the z Distribution
Review of Key Term.
35881 DiscussionNumber of Pages 1 (Double Spaced)Number o.docxrhetttrevannion
35881 Discussion
Number of Pages: 1 (Double Spaced)
Number of sources: 1
Writing Style: APA
Type of document: Essay
Academic Level:Master
Category: Psychology
Language Style: English (U.S.)
Order Instructions: Attached
I will attach the instruction
Please follow them carefully
35876 Topic: Discussion3
Number of Pages: 1 (Double Spaced)
Number of sources: 1
Writing Style: APA
Type of document: Essay
Academic Level:Master
Category: Psychology
Language Style: English (U.S.)
Order Instructions: Attached
I will attach the instruction
Please follow them carefully
Discussion: Please discuss, elaborate and give example on the topic. Be careful with grammar and spelling. No running head please. Please Use only the reference I will attach as the professor will not be able to give grade.
Author: (Jackson, S. L. (2017). Statistics plain and simple. (4th ed.). Boston, MA: Cengage Learning.)
Topic
What level of measurement can be used for this test for the independent and dependent variables?
Reference:
Module 9: The Single-Sample z Test
The z Test: What It Is and What It Does
The Sampling Distribution
The Standard Error of the Mean
Calculations for the One-Tailed z Test
Interpreting the One-Tailed z Test
Calculations for the Two-Tailed z Test
Interpreting the Two-Tailed z Test
Statistical Power
Assumptions and Appropriate Use of the z Test
Confidence Intervals Based on the z Distribution
Review of Key Terms
Module Exercises
Critical Thinking Check Answers
Module 10: The Single-Sample t Test
The t Test: What It Is and What It Does
Student's t Distribution
Calculations for the One-Tailed t Test
The Estimated Standard Error of the Mean
Interpreting the One-Tailed t Test
Calculations for the Two-Tailed t Test
Interpreting the Two-Tailed t Test
Assumptions and Appropriate Use of the Single-Sample t Test
Confidence Intervals Based on the t Distribution
Review of Key Terms
Module Exercises
Critical Thinking Check Answers
Chapter 5 Summary and Review
Chapter 5 Statistical Software Resources
In this chapter, we continue our discussion of inferential statistics—procedures for drawing conclusions about a population based on data collected from a sample. We will address two different statistical tests: the z test and t test. After reading this chapter, engaging in the Critical Thinking checks, and working through the problems at the end of each module and at the end of the chapter, you should understand the differences between the two tests covered in this chapter, when to use each test, how to use each to test a hypothesis, and the assumptions of each test.
MODULE 9
The Single-Sample z Test
Learning Objectives
•Explain what a z test is and what it does.
•Calculate a z test.
•Explain what statistical power is and how to make statistical tests more powerful.
•List the assumptions of the z test.
•Calculate confidence intervals using the z distribution.
The z Test: What It Is and What It Does
The z test is a parametric statistical te.
The t Test for Related Samples
Program Transcript
MATT JONES: As its name implies, the independent samples t-test has the
assumption of the independence of observations. But that's not always the case.
Sometimes we take multiple observations of the same unit of analysis, such as a
person, over time. In this case, we'll use a paired sample t-test, sometimes
referred to as the dependent sample t-test. Let's go to SPSS to see how we do
this.
To perform the paired sample t-test in SPSS, we once again go to Analyze,
Compare Means, and down to the Paired Sample T-test. SPSS doesn't require
much information here;; only the pair of variables of which we would like to test.
We have a simulated data set here for statistical anxiety of students. Students
were provided with an instrument that measures their anxiety around statistical
topics on a number of different constructs-- teachers, interpretation, asking for
help, worth, and self-conceptualization.
They were given the test at the beginning of the class and at the conclusion of a
class. Hence, why in the value labels we see pre-test and post-test. As a teacher,
I might have some interest in determining whether students felt more comfortable
with me or had lowering anxiety over time. This is perfect for a paired sample t-
test. To perform this paired sample t-test, we'll go to Analyze, Compare Means,
the Paired Sample T-test.
SPSS doesn't ask for much information;; only the pair of variables of which I
would like to test. In this case, teacher pre-test and teacher post-test. So this is a
classic before and after. The first piece of output I obtain from the paired sample
t-test are some descriptive statistics, specifically around the pairwise comparison
I'm looking at, which is the teacher subscale pre-test and post-test.
I see that there is mean on the pre-test of 17.32 and on the post-test, an 18.44.
So it appears, at least from a descriptive sense, that there is a higher mean on
the post-test than the pre-test. On the instrument, higher scores on an item or the
subscale indicate higher levels of anxiety for that specific attitude. Except for this
specific subscale, fear of statistics teachers, where higher scores actually
indicate lower levels of anxiety.
So if post scores are higher than pre scores, that means on average, students
feel lower levels of anxiety and more positive attitude about their statistics
teacher. I can see here, at least from a descriptive sense, that that appears to be
the case. But from the sample, I am performing a test of statistical significance.
Next to the mean, I'm provided with the sample size 25-- 25 observations pre-test
and 25 observations post-test, all the same person-- the standard deviation for
the pre-test and the post-test, and the standard error of the mean. ...
Chapter 5 part2- Sampling Distributions for Counts and Proportions (Binomial ...nszakir
Mathematics, Statistics, Sampling Distributions for Counts and Proportions, Binomial Distributions for Sample Counts,
Binomial Distributions in Statistical Sampling, Binomial Mean and Standard Deviation, Sample Proportions, Normal Approximation for Counts and Proportions, Binomial Formula
Why We Are Open Sourcing ContraxSuite and Some Thoughts About Legal Tech and ...Daniel Katz
Why We Are Open Sourcing ContraxSuite and Some Thoughts About Legal Tech and the Modern Information Economy - By Michael Bommarito + Daniel Martin Katz from LexPredict
Fin (Legal) Tech – Law’s Future from Finance’s Past (Some Thoughts About the ...Daniel Katz
Fin (Legal) Tech – Law’s Future from Finance’s Past (Some Thoughts About the Financialization of the Law) – Professors Daniel Martin Katz + Michael J Bommarito
Exploring the Physical Properties of Regulatory Ecosystems - Professors Danie...Daniel Katz
Exploring the Physical Properties of Regulatory Ecosystems: Regulatory Dynamics Revealed by Securities Filings — Professors Daniel Martin Katz + Michael J Bommarito
Artificial Intelligence and Law - A Primer Daniel Katz
Artificial Intelligence in Law (and beyond) including Machine Learning as a Service, Quantitative Legal Prediction / Legal Analytics, Experts + Crowds + Algorithms
LexPredict - Empowering the Future of Legal Decision MakingDaniel Katz
LexPredict is an enterprise legal technology and consulting firm, specializing in the application of best-in-class processes and technologies from the technology, financial services, and logistics industries to the practice of law, compliance, insurance, and risk management.
We focus on the goals of prediction, optimization, and risk management to enable holistic organizational changes that empower legal decision-making.
These changes span people and processes, software and data, and execution and education.
Legal Analytics Course - Class 9 - Clustering Algorithms (K-Means & Hierarchical Clustering) - Professor Daniel Martin Katz + Professor Michael J Bommarito
In 2020, the Ministry of Home Affairs established a committee led by Prof. (Dr.) Ranbir Singh, former Vice Chancellor of National Law University (NLU), Delhi. This committee was tasked with reviewing the three codes of criminal law. The primary objective of the committee was to propose comprehensive reforms to the country’s criminal laws in a manner that is both principled and effective.
The committee’s focus was on ensuring the safety and security of individuals, communities, and the nation as a whole. Throughout its deliberations, the committee aimed to uphold constitutional values such as justice, dignity, and the intrinsic value of each individual. Their goal was to recommend amendments to the criminal laws that align with these values and priorities.
Subsequently, in February, the committee successfully submitted its recommendations regarding amendments to the criminal law. These recommendations are intended to serve as a foundation for enhancing the current legal framework, promoting safety and security, and upholding the constitutional principles of justice, dignity, and the inherent worth of every individual.
A "File Trademark" is a legal term referring to the registration of a unique symbol, logo, or name used to identify and distinguish products or services. This process provides legal protection, granting exclusive rights to the trademark owner, and helps prevent unauthorized use by competitors.
Visit Now: https://www.tumblr.com/trademark-quick/751620857551634432/ensure-legal-protection-file-your-trademark-with?source=share
Responsibilities of the office bearers while registering multi-state cooperat...Finlaw Consultancy Pvt Ltd
Introduction-
The process of register multi-state cooperative society in India is governed by the Multi-State Co-operative Societies Act, 2002. This process requires the office bearers to undertake several crucial responsibilities to ensure compliance with legal and regulatory frameworks. The key office bearers typically include the President, Secretary, and Treasurer, along with other elected members of the managing committee. Their responsibilities encompass administrative, legal, and financial duties essential for the successful registration and operation of the society.
NATURE, ORIGIN AND DEVELOPMENT OF INTERNATIONAL LAW.pptxanvithaav
These slides helps the student of international law to understand what is the nature of international law? and how international law was originated and developed?.
The slides was well structured along with the highlighted points for better understanding .
Car Accident Injury Do I Have a Case....Knowyourright
Every year, thousands of Minnesotans are injured in car accidents. These injuries can be severe – even life-changing. Under Minnesota law, you can pursue compensation through a personal injury lawsuit.
Military Commissions details LtCol Thomas Jasper as Detailed Defense CounselThomas (Tom) Jasper
Military Commissions Trial Judiciary, Guantanamo Bay, Cuba. Notice of the Chief Defense Counsel's detailing of LtCol Thomas F. Jasper, Jr. USMC, as Detailed Defense Counsel for Abd Al Hadi Al-Iraqi on 6 August 2014 in the case of United States v. Hadi al Iraqi (10026)
The Main Procedures for Obtaining Cypriot Citizenship
Quantitative Methods for Lawyers - Class #15 - R Boot Camp - Part 2 - Professor Daniel Martin Katz
1. Quantitative
Methods
for
Lawyers
Statistical Tests Using R
R Boot Camp - Part 2
Class #15
@ computational
computationallegalstudies.com
professor daniel martin katz danielmartinkatz.com
lexpredict.com slideshare.net/DanielKatz
2. My Challenge to You
Use R to
Download and
Clean this Simple
DataSet
7. # Here is the Data -
It Looks Okay
# Here is the Problem -
Our Data are Factors not Numeric
8. # Here is the Data -
It Looks Okay
# Here is the Problem -
Our Data are Factors not Numeric
# Thus we get this when trying to
calculate a mean
9. # Here is the Data -
It Looks Okay
# Here is the Problem -
Our Data are Factors not Numeric
# Thus we get this when trying to
calculate a mean
We have two
problems -
(1) the fact that
our data is non
numeric
(2) and the
commas
10. # Here is the Data -
It Looks Okay
# Here is the Problem -
Our Data are Factors not Numeric
# Thus we get this when trying to
calculate a mean
# Okay This Is What We Need
We have two
problems -
(1) the fact that
our data is non
numeric
(2) and the
commas
15. Binomial Distribution
“A binomial experiment (also known as a Bernoulli trial) is a
statistical experiment that has the following properties:
The experiment consists of n repeated trials.
Each trial can result in just two possible outcomes.
The probability of success, denoted by P, is the
same on every trial.
The trials are independent”
16. Example: Coin Flip
Nostradamus
Predicting Coin Flips -
Does you Friend Have the General Ability to
Actually Predict Coin Flips?
How Would You Evaluate This Proposition?
How Many Predictions Would Your Friend Have to Get Right
For You To Believe They Actually Have Real Ability?
17. Example: Coin Flip
Nostradamus
Ho: Cannot Actually Predict Coin Flips
H1: Can Actually Predict Coin Flip
(i.e. do so at a rate greater than chance)
Ho is the Null Hypothesis
H1 is the Alternative Hypothesis
18. Reject the Null versus
Failing to Reject the Null
If We Fail to Reject the Null, we are left with the assumption
of no relationship
In the Coin Flip Example, We might have enough evidence
to reject the null
Remember the default (null) is that there is no
relationship
Although a Relationship might actually exist
19. Example: Coin Flip
Nostradamus
If He Were Guessing - what is the Probability Coin Flip
Nostradamus Predicts at least 3 of 4 Coin Tosses ?
p
probability of success
x
number of successes
n
number of trials
3 or 4 4 1/2
20.
21. Example: Coin Flip
Nostradamus
If He Were Guessing - what is the Probability Coin Flip
Nostradamus Predicts at least 3 of 4 Coin Tosses ?
p
probability of success
x
number of successes
n
number of trials
3 or 4 4 1/2
22. Example: Coin Flip
Nostradamus
If He Were Guessing - what is the Probability Coin Flip
Nostradamus Predicts at least 3 of 4 Coin Tosses ?
#Here We Get Only For X=3
23. Example: Coin Flip
Nostradamus
If He Were Guessing - what is the Probability Coin Flip
Nostradamus Predicts at least 3 of 4 Coin Tosses ?
#Here We Get Only For X=3
#Now We Get a Vector if X=3, X=4
24. Example: Coin Flip
Nostradamus
If He Were Guessing - what is the Probability Coin Flip
Nostradamus Predicts at least 3 of 4 Coin Tosses ?
#Here We Get Only For X=3
#Now We Get The
Sum of X=3, X=4
#Now We Get a Vector if X=3, X=4
27. Does 30 heads in 50 flips imply an unfair coin?
Assuming a Fair Coin - what is the 95% Conf. Interval for 50 flips?
28. Does 30 heads in 50 flips imply an unfair coin?
Assuming a Fair Coin - what is the 95% Conf. Interval for 50 flips?
29. Imagine that I gave out a 15
question multiple choice test
with 5 possible answers per
question.
30. Imagine that I gave out a 15
question multiple choice test
with 5 possible answers per
question.
Using random guessing, what is the probability of
getting exactly 7 questions correct?
31. Imagine that I gave out a 15
question multiple choice test
with 5 possible answers per
question.
p
probability of success
x
number of successes
n
number of trials
7 15 1/5
Using random guessing, what is the probability of
getting exactly 7 questions correct?
32. Imagine that I gave out a 15
question multiple choice test
with 5 possible answers per
question.
p
probability of success
x
number of successes
n
number of trials
7 15 1/5
Using random guessing, what is the probability of
getting exactly 7 questions correct?
33. Imagine that I gave out a 15
question multiple choice test
with 5 possible answers per
question.
p
probability of success
x
number of successes
n
number of trials
7 15 1/5
Using random guessing, what is the probability of
getting exactly 7 questions correct?
This is the exact probability for 7
But What About 7 or Greater?
34. Imagine that I gave out a 15
question multiple choice test
with 5 possible answers per
question.
Using random guessing, what is the probability of
getting greater than 7 questions correct?
This is our prior answer
Here we are summing 7:15
36. Imagine that a population of students
take a test with an average score of 78
and a standard deviation of 9.
Assuming the test scores are normally
distributed, how many students
received a 90 or higher?
37.
38. Imagine that a population 100
Students take a test with an
average score of 78
and a standard deviation of 9.
Assuming the test scores are
normally distributed, how many
students received a 90 or higher?
39. Imagine that a population 100
Students take a test with an
average score of 78
and a standard deviation of 9.
Assuming the test scores are
normally distributed, how many
students received a 90 or higher?
pnorm(q , mean= , sd= , lower.tail=TRUE) This is the Syntax:
40. Imagine that a population 100
Students take a test with an
average score of 78
and a standard deviation of 9.
Assuming the test scores are
normally distributed, how many
students received a 90 or higher?
pnorm(q , mean= , sd= , lower.tail=TRUE) This is the Syntax:
pnorm(90 , mean= 78 , sd=9 , lower.tail=FALSE) What We Want:
because we want upper tail
41. Imagine that a population 100
Students take a test with an
average score of 78
and a standard deviation of 9.
Assuming the test scores are
normally distributed, how many
students received a 90 or higher?
pnorm(q , mean= , sd= , lower.tail=TRUE) This is the Syntax:
pnorm(90 , mean= 78 , sd=9 , lower.tail=FALSE) What We Want:
because we want upper tail
42. In the 2011-2012 year the national
average on the LSAT was 150.66
with a Standard Deviation of
10.19
Assuming those scores are
normally distributed, what
percentage of test takers scored
160 or above? http://www.lsac.org/docs/default-source/
research-%28lsac-resources%29/tr-12-03.pdf
Table 1 on Page 9
43. In the 2011-2012 year the national
average on the LSAT was 150.66
with a Standard Deviation of
10.19
Assuming those scores are
normally distributed, what
percentage of test takers scored
160 or above? http://www.lsac.org/docs/default-source/
research-%28lsac-resources%29/tr-12-03.pdf
Table 1 on Page 9
46. H0: There is No Difference Between the Mean Damage
Award in Bloom County and the Mean Damage Award in
the Rest of the State
Num of Obs. Mean Std. Dev.
GROUP 1
Rest of State
21 $371,621 $289,823
GROUP 2
Bloom County
25 $547,784 $703,314
52. Male Female Totals
Not Research Asst 319 323 642
Research Assistant 60 34 94
Total 379 357 736
RA’s Hired at a School are mostly Men
60 out of 94 RA’s are Men (See Above)
Could this just be chance or is it too large to be
explained by chance?
Chi Square ( ) Statisticχ 2