Downloaded 113 times


![©2007 Pearson Education Asia
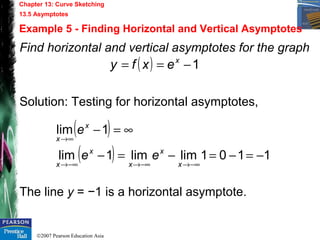
Chapter 13: Curve Sketching
13.2 Absolute Extrema on a Closed Interval
Procedure to Find Absolute Extrema for a
Function f That Is Continuous on [a, b]
1. Find the critical values of f .
2. Evaluate f(x) at the endpoints a and b and at the
critical values in (a, b).
3. The maximum value of f is the greatest value
found in step 2. The minimum value is the least
value found in step 2.](https://image.slidesharecdn.com/introductory-20maths-20analysis-20-20chapter-2013-official-131011125123-phpapp02/85/Introductory-maths-analysis-chapter-13-official-14-320.jpg)
![©2007 Pearson Education Asia
Chapter 13: Curve Sketching
13.2 Absolute Extrema on a Closed Interval
Example 1 - Finding Extreme Values on a Closed Interval
Find absolute extrema for over the
closed interval [1, 4].
Solution:
Step 1:
Step 2:
Step 3:
( ) 542
+−= xxxf
( ) ( )2242' −=−= xxxxf
( )
( ) endpointsatofvalues54
21
ff
f
=
=
( ) ( )41,in2valuecriticalatofvalues12 ff =
( ) ( ) 12isminand54ismax == ff](https://image.slidesharecdn.com/introductory-20maths-20analysis-20-20chapter-2013-official-131011125123-phpapp02/85/Introductory-maths-analysis-chapter-13-official-15-320.jpg)


This document is a chapter from an introductory mathematical analysis textbook. It covers curve sketching, including how to find relative and absolute extrema, determine concavity, use the second derivative test, identify asymptotes, and apply concepts of maxima and minima. The chapter contains learning objectives, an outline of topics, examples of applying techniques to sketch curves and solve optimization problems, and instructional content to introduce these curve sketching concepts.