Download to read offline


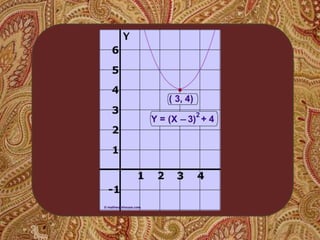


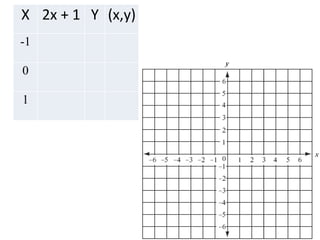


This document discusses key concepts for graphing linear equations including functions, inputs, outputs, domains, ranges, and different types of equations that produce linear, quadratic, or absolute value graphs. It defines linear equations as having variables that are never squared and provides examples of linear equations. It also describes how quadratic equations with squared x and y variables will produce circular graphs while absolute value equations create V-shaped graphs.