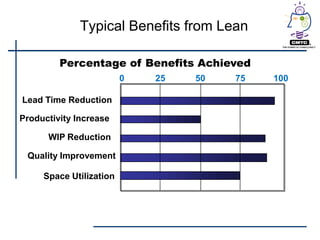
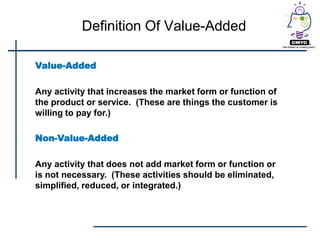
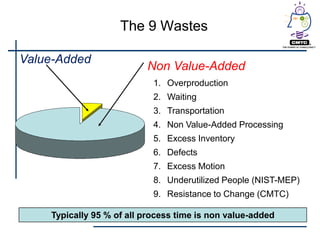
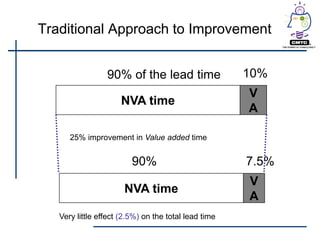
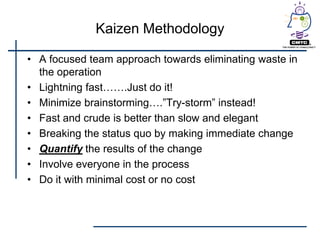
Lean Introduction

Kim Victorine, Senior Consultant
   California Manufacturing
    Technology Consulting
CMTC

         • Private non-profit corporation affiliated with the
           National Institute of Standards & Technology –
           Manufacturing Extension Partnership (NIST-
           MEP)
         • We are in the top 5% in NIST-MEP Client
           Satisfaction
         • Our Mission is to ―Make a Difference in
           California‖ by enhancing manufacturing
         • Our ―Hands On‖ approach is different from other
           consulting organizations
(file path)
Kim Victorine

• Has worked with over 200 client
  organizations since 1998.
• Has conducted over 100 QMS &
  Lean project implementations
• Broad & deep experience:
   – Quality Circle Facilitator
   – JIT, TQM, SPC
   – Zenger Miller certified facilitator/trainer
   – Achieve Global certified facilitator/trainer
   – NIST/MEPU certified Lean
     facilitator/trainer
   – Lean Competency in Value Stream
     Mapping, 5S, Kaizen, TPM, SMED, TWI,
     Problem Solving, and Standard Work
What is Lean?

         • Lean is the identification of waste in our systems
           and processes
         • Lean is a organizational pursuit of the removal
           and prevention of waste (9 types of NVA waste)
         • Lean methodologies were developed at Toyota
           and are known as the Toyota Production System
           (TPS)


(file path)
Defining Lean

Lean is:

“A systematic approach to identifying and eliminating
waste (non-value-added activities) through continuous
improvement by flowing the product at the pull of the
customer in pursuit of perfection.”


                                      The MEP Lean Network
Why Do We Follow the Lean Path?

         • SURVIVAL!
         • Our global economy and growing competition
           requires all organizations to improve
           performance ―rapidly‖


(file path)
What Has Changed to Require
                     Us to Follow a Lean Path?

         • The financial model that all companies have to
           apply in today's environment has changed

         • The Old Equation for Profit
              – Cost + Defined Profit = Sales Price

         • The New Equation for Profit
              – Price (Fixed by Consumer) – Cost = Profit


(file path)
Typical Benefits from Lean

         Percentage of Benefits Achieved
                         0   25   50   75   100

Lead Time Reduction

Productivity Increase

      WIP Reduction

 Quality Improvement

     Space Utilization
Definition Of Value-Added

Value-Added

Any activity that increases the market form or function of
the product or service. (These are things the customer is
willing to pay for.)

Non-Value-Added

Any activity that does not add market form or function or
is not necessary. (These activities should be eliminated,
simplified, reduced, or integrated.)
The 9 Wastes

Value-Added
                          Non Value-Added
                            1. Overproduction
                            2. Waiting
                            3. Transportation
                            4. Non Value-Added Processing
                            5. Excess Inventory
                            6. Defects
                            7. Excess Motion
                            8. Underutilized People (NIST-MEP)
                            9. Resistance to Change (CMTC)

    Typically 95 % of all process time is non value-added
Traditional Approach to Improvement


                 90% of the lead time                 10%
                                                      V
                      NVA time
                                                      A

      25% improvement in Value added time


                         90%                          7.5%
                                                      V
                       NVA time
                                                      A
   Very little effect (2.5%) on the total lead time
Current Approach for Kaizen Improvement

                     90% of the lead time                 10%
                                                          V
                         NVA time
                                                          A
  25% improvement in Non Value added time,


                      67.5%                           33.5%
                                                V     V    V
                  NVA time
                                                A     A    A
  Significant reduction (22.5 %) in total lead time
Continual Improvement

Old Adage:

  “If you always do what you always did, you’ll always get
  what you always got.”

Competitive Corollary:

  “If the other guy gets BETTER, you’re gonna get LESS.”
Why Introduction to Value Stream


• See the sources of waste in the
  Value Stream... basis for an
  implementation plan
• Linkage between information and
  material flow
• Qualitative tool: What you are going
  to do to affect the numbers
• Helps to see and focus on flow with a
  vision of an ideal
Value S              The Value Stream


                    VALUE-STREAM
     PROCESS          PROCESS    PROCESS

       Create art      Molding
                                  Assembly
                                    Cell


 Raw                                         Finished
 Material                                     Product
―Rocks in a Stream‖ or
               Process Flow Optimized
                        How it is today


                                          How it can be


              How it should be

(file path)
Walking the Flow (Muda Walk)

         • The first step in in identifying where things stand
           (your current state) is to ―walk the process or
           flow‖
         • Waste (Muda) walk; Walk the flow looking for
           the 9 types of waste
         • Document what waste is found and where it is
           located


(file path)
What Do We Do Next?

         • Identify areas with the most potential for
           improvement
         • Develop a workplace diagram
         • Go back to the action and collect more data


(file path)
Workplace Diagram

         • Draw a layout of the work area showing points of
           entry/exit, key equipment, storage areas,
           materials
         • Diagram the flow of personnel performing work
         • Measure distance traveled


(file path)
Gather Information: Start with a Map


                                                                  Pallet


                                                                 Worker


                                                     Mobile Equipment

                                                                                  20
                                                                           360v
LE203 Workplace Organization and Standardization —                           SM
                                                                           u
02/02 v1
                                                                           2002
Example: Spaghetti Diagram
Example: Office Area Map

                                   File Cabinet
                                                     Files
                                                             Bookcase          Bookcase


                                                               File
                                                              Boxes

                                 Chair                                                    Table


                                                                        Desk

                                                                        Computer
                      Door                              Bookcase

                                                                                                     22
                                                                                              360v
LE203 Workplace Organization and Standardization —                                              SM
                                                                                              u
02/02 v1
                                                                                              2002
Example: Workplace Scan Display


                                                                     23
                                                              360v
LE203 Workplace Organization and Standardization —              SM
                                                              u
02/02 v1
                                                              2002
Gather Information:
                                                     Take ―Before‖ Photos

       • Photograph major problem areas
                – Photos provide a visual measurement of current
                  and improved conditions
       • Choose strategic locations
       • Remember to mark the locations
       • Record locations and subjects


                                                                                   24
                                                                            360v
LE203 Workplace Organization and Standardization —                            SM
                                                                            u
02/02 v1
                                                                            2002
Example: Workplace Scan
                                           Display, with Photo’s


                                                                          25
                                                                   360v
LE203 Workplace Organization and Standardization —                   SM
                                                                   u
02/02 v1
                                                                   2002
Kaizen Improvement

         • Kaizen = Continual Improvement
         • Kaizen = Rapid Improvement
         • Kaizen = Improvement Driven by Workers


(file path)
Kaizen - A new way of thinking


 What do you see
  when you look at
  this picture?
 Cup Half Empty ?

   Or cup Half Full?
Kaizen - A new way of thinking


   Lean View: There
    is twice as much
    measuring cup as
    is needed to hold
    the water
Traditional Improvement Process


Analyze      Recommend      Decide       Implement     Modify


                     Typically Takes Weeks or Months
Kaizen Improvement Process


Analyze         Try        Modify   Implement


                Kaizen Team


                      Maximum of 5 Days
Kaizen Methodology

• A focused team approach towards eliminating waste in
  the operation
• Lightning fast…….Just do it!
• Minimize brainstorming….‖Try-storm‖ instead!
• Fast and crude is better than slow and elegant
• Breaking the status quo by making immediate change
• Quantify the results of the change
• Involve everyone in the process
• Do it with minimal cost or no cost
Contact Info

         Kim Victorine, Senior Consultant CMTC
         BB: 310-984-0938
         Cell: 951-203-3672
         Email: victorin@cmtc.com
         Email: kdvictorine@aol.com


(file path)

Cmtc Lean Introduction

  • 1.
    Lean Introduction Kim Victorine,Senior Consultant California Manufacturing Technology Consulting
  • 2.
    CMTC • Private non-profit corporation affiliated with the National Institute of Standards & Technology – Manufacturing Extension Partnership (NIST- MEP) • We are in the top 5% in NIST-MEP Client Satisfaction • Our Mission is to ―Make a Difference in California‖ by enhancing manufacturing • Our ―Hands On‖ approach is different from other consulting organizations (file path)
  • 3.
    Kim Victorine • Hasworked with over 200 client organizations since 1998. • Has conducted over 100 QMS & Lean project implementations • Broad & deep experience: – Quality Circle Facilitator – JIT, TQM, SPC – Zenger Miller certified facilitator/trainer – Achieve Global certified facilitator/trainer – NIST/MEPU certified Lean facilitator/trainer – Lean Competency in Value Stream Mapping, 5S, Kaizen, TPM, SMED, TWI, Problem Solving, and Standard Work
  • 4.
    What is Lean? • Lean is the identification of waste in our systems and processes • Lean is a organizational pursuit of the removal and prevention of waste (9 types of NVA waste) • Lean methodologies were developed at Toyota and are known as the Toyota Production System (TPS) (file path)
  • 5.
    Defining Lean Lean is: “Asystematic approach to identifying and eliminating waste (non-value-added activities) through continuous improvement by flowing the product at the pull of the customer in pursuit of perfection.” The MEP Lean Network
  • 6.
    Why Do WeFollow the Lean Path? • SURVIVAL! • Our global economy and growing competition requires all organizations to improve performance ―rapidly‖ (file path)
  • 7.
    What Has Changedto Require Us to Follow a Lean Path? • The financial model that all companies have to apply in today's environment has changed • The Old Equation for Profit – Cost + Defined Profit = Sales Price • The New Equation for Profit – Price (Fixed by Consumer) – Cost = Profit (file path)
  • 8.
    Typical Benefits fromLean Percentage of Benefits Achieved 0 25 50 75 100 Lead Time Reduction Productivity Increase WIP Reduction Quality Improvement Space Utilization
  • 9.
    Definition Of Value-Added Value-Added Anyactivity that increases the market form or function of the product or service. (These are things the customer is willing to pay for.) Non-Value-Added Any activity that does not add market form or function or is not necessary. (These activities should be eliminated, simplified, reduced, or integrated.)
  • 10.
    The 9 Wastes Value-Added Non Value-Added 1. Overproduction 2. Waiting 3. Transportation 4. Non Value-Added Processing 5. Excess Inventory 6. Defects 7. Excess Motion 8. Underutilized People (NIST-MEP) 9. Resistance to Change (CMTC) Typically 95 % of all process time is non value-added
  • 11.
    Traditional Approach toImprovement 90% of the lead time 10% V NVA time A 25% improvement in Value added time 90% 7.5% V NVA time A Very little effect (2.5%) on the total lead time
  • 12.
    Current Approach forKaizen Improvement 90% of the lead time 10% V NVA time A 25% improvement in Non Value added time, 67.5% 33.5% V V V NVA time A A A Significant reduction (22.5 %) in total lead time
  • 13.
    Continual Improvement Old Adage: “If you always do what you always did, you’ll always get what you always got.” Competitive Corollary: “If the other guy gets BETTER, you’re gonna get LESS.”
  • 14.
    Why Introduction toValue Stream • See the sources of waste in the Value Stream... basis for an implementation plan • Linkage between information and material flow • Qualitative tool: What you are going to do to affect the numbers • Helps to see and focus on flow with a vision of an ideal
  • 15.
    Value S The Value Stream VALUE-STREAM PROCESS PROCESS PROCESS Create art Molding Assembly Cell Raw Finished Material Product
  • 16.
    ―Rocks in aStream‖ or Process Flow Optimized How it is today How it can be How it should be (file path)
  • 17.
    Walking the Flow(Muda Walk) • The first step in in identifying where things stand (your current state) is to ―walk the process or flow‖ • Waste (Muda) walk; Walk the flow looking for the 9 types of waste • Document what waste is found and where it is located (file path)
  • 18.
    What Do WeDo Next? • Identify areas with the most potential for improvement • Develop a workplace diagram • Go back to the action and collect more data (file path)
  • 19.
    Workplace Diagram • Draw a layout of the work area showing points of entry/exit, key equipment, storage areas, materials • Diagram the flow of personnel performing work • Measure distance traveled (file path)
  • 20.
    Gather Information: Startwith a Map Pallet Worker Mobile Equipment 20 360v LE203 Workplace Organization and Standardization — SM u 02/02 v1 2002
  • 21.
  • 22.
    Example: Office AreaMap File Cabinet Files Bookcase Bookcase File Boxes Chair Table Desk Computer Door Bookcase 22 360v LE203 Workplace Organization and Standardization — SM u 02/02 v1 2002
  • 23.
    Example: Workplace ScanDisplay 23 360v LE203 Workplace Organization and Standardization — SM u 02/02 v1 2002
  • 24.
    Gather Information: Take ―Before‖ Photos • Photograph major problem areas – Photos provide a visual measurement of current and improved conditions • Choose strategic locations • Remember to mark the locations • Record locations and subjects 24 360v LE203 Workplace Organization and Standardization — SM u 02/02 v1 2002
  • 25.
    Example: Workplace Scan Display, with Photo’s 25 360v LE203 Workplace Organization and Standardization — SM u 02/02 v1 2002
  • 26.
    Kaizen Improvement • Kaizen = Continual Improvement • Kaizen = Rapid Improvement • Kaizen = Improvement Driven by Workers (file path)
  • 27.
    Kaizen - Anew way of thinking  What do you see when you look at this picture?  Cup Half Empty ?  Or cup Half Full?
  • 28.
    Kaizen - Anew way of thinking  Lean View: There is twice as much measuring cup as is needed to hold the water
  • 29.
    Traditional Improvement Process Analyze Recommend Decide Implement Modify Typically Takes Weeks or Months
  • 30.
    Kaizen Improvement Process Analyze Try Modify Implement Kaizen Team Maximum of 5 Days
  • 31.
    Kaizen Methodology • Afocused team approach towards eliminating waste in the operation • Lightning fast…….Just do it! • Minimize brainstorming….‖Try-storm‖ instead! • Fast and crude is better than slow and elegant • Breaking the status quo by making immediate change • Quantify the results of the change • Involve everyone in the process • Do it with minimal cost or no cost
  • 32.
    Contact Info Kim Victorine, Senior Consultant CMTC BB: 310-984-0938 Cell: 951-203-3672 Email: victorin@cmtc.com Email: kdvictorine@aol.com (file path)