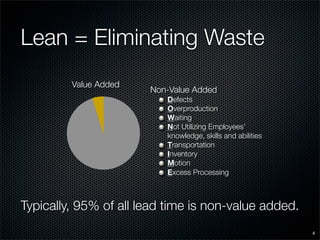
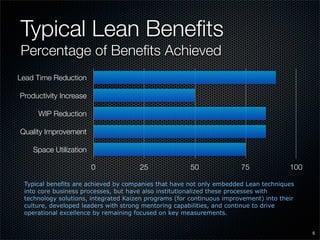
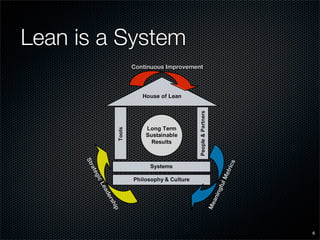
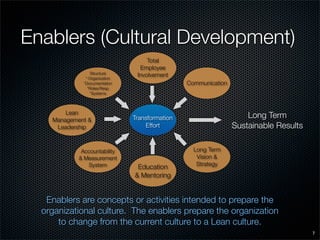
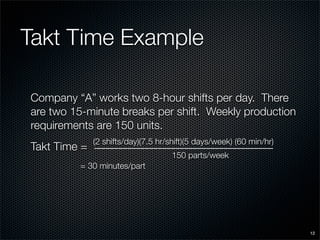
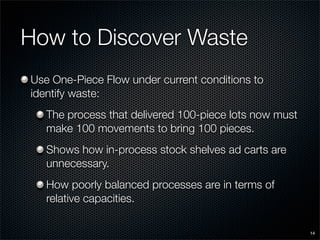
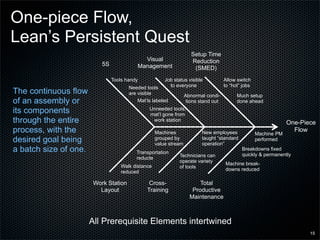
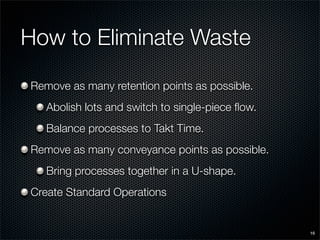
Joint presentation to SME members on the benefits of Lean, a overview of Lean terminology, and how sequencing operations in a balanced flow reduces Lead Time.
1. Lean Transformations
What is it? How do we do it?
Kelly Davis, Utah Manufacturing Extension Partnership
Scott Kisling, Kisling Consultants, LLC
2. Agenda
Typical Benefits
Culture Change / Transformation Model
Basic Definitions
Little’s Law
Overview of Lean Tools
Planning a Lean Event
Lessons from the Field
2
3. What is Lean?
“A systematic approach to identifying and
eliminating waste (non-value added activities)
through continuous improvement by flowing
the product at the pull of the customer in
pursuit of perfection.”
The MEP Lean Network
3
4. Lean = Eliminating Waste
Value Added
Non-Value Added
Defects
Overproduction
Waiting
Not Utilizing Employees’
knowledge, skills and abilities
Transportation
Inventory
Motion
Excess Processing
Typically, 95% of all lead time is non-value added.
4
5. Typical Lean Benefits
Percentage of Benefits Achieved
Lead Time Reduction
Productivity Increase
WIP Reduction
Quality Improvement
Space Utilization
0 25 50 75 100
Typical benefits are achieved by companies that have not only embedded Lean techniques
into core business processes, but have also institutionalized these processes with
technology solutions, integrated Kaizen programs (for continuous improvement) into their
culture, developed leaders with strong mentoring capabilities, and continue to drive
operational excellence by remaining focused on key measurements.
5
6. Lean is a System
Continuous Improvement
Str
s
tric
a
teg
Me
ic
ful
Le
ing
ad
ers
an
Me
hip
6
7. Enablers (Cultural Development)
Total
Employee
Structure
Involvement
* Organization
Communication
*Documentation
*Roles/Resp
*Systems
Lean
Long Term
Transformation
Management &
Sustainable Results
Effort
Leadership
Long Term
Accountability
Vision &
& Measurement
Strategy
System Education
& Mentoring
Enablers are concepts or activities intended to prepare the
organizational culture. The enablers prepare the organization
to change from the current culture to a Lean culture.
7
8. Requirements for Transformation
Compelling reason to change.
A shift in thinking across the organization.
Strategic Leadership & involvement from Senior Management.
Clearly defined and communicated long term vision.
Specific transformation plan.
Clearly defined process objectives linked to overall objectives.
Support systems (communications, reward & recognition, promotion, etc.)
A measurement system to monitor progress and motivate behavior.
Clearly defined roles and responsibilities.
Enlisting the hearts and minds of the entire workforce.
Proven tools & techniques.
Time, patience, and perseverance.
Workforce education.
8
9. “To improve is
to change.
To be perfect is
to change often.”
Winston Churchill
9
10. Basic Time Definitions
Cycle Time, Operation 2
Cycle Time, Operation 1
Lead Time
= Value Added Time = Non-Value Added Time
10
11. Takt Time
The frequency at which a complete unit must
come off the line.
Available Production Time
Takt Time =
Customer Demand
11
12. Takt Time Example
Company “A” works two 8-hour shifts per day. There
are two 15-minute breaks per shift. Weekly production
requirements are 150 units.
(2 shifts/day)(7.5 hr/shift)(5 days/week) (60 min/hr)
Takt Time =
150 parts/week
= 30 minutes/part
12
13. Takt Time / Cycle Time Chart
40
Takt Time = 30 minutes
30
Cycle (minutes)
20
10
0
Turn Bore Drill Spot Face Clean Deburr Assemble Inspect Pack
Operations
13
14. How to Discover Waste
Use One-Piece Flow under current conditions to
identify waste:
The process that delivered 100-piece lots now must
make 100 movements to bring 100 pieces.
Shows how in-process stock shelves ad carts are
unnecessary.
How poorly balanced processes are in terms of
relative capacities.
14
15. One-piece Flow,
Lean’s Persistent Quest
Setup Time
Visual Reduction
5S Management (SMED)
Tools handy Job status visible Allow switch
to everyone to “hot” jobs
Needed tools
The continuous flow are visible Abnormal condi- Much setup
of an assembly or Mat’ls labeled tions stand out done ahead
its components Unneeded tools,
mat’l gone from
through the entire work station
One-Piece
process, with the Flow
New employees
Machines Machine PM
desired goal being taught “standard
grouped by performed
operation”
value stream
a batch size of one. Breakdowns fixed
Transportation quickly & permanently
Technicians can
reducte
operate variety
Machine break-
Walk distance of tools
downs reduced
reduced
Work Station Cross- Total
Layout Training Productive
Maintenance
All Prerequisite Elements intertwined
15
16. How to Eliminate Waste
Remove as many retention points as possible.
Abolish lots and switch to single-piece flow.
Balance processes to Takt Time.
Remove as many conveyance points as possible.
Bring processes together in a U-shape.
Create Standard Operations
16
17. Why Is Inventory Bad?
Each piece of Work in Process will cost one
Takt Time’s worth of Lead Time
Op1 Op2 Op3 Op4 Op5 Op6 Op7 Op8 Op9 Op1 Op2 Op3 Op4 Op5 Op6 Op7 Op8 Op9
30 pc 30 pc 30 pc 30 pc 30 pc 30 pc 30 pc 30 pc 30 pc 10 pc 1 pc 1 pc 15 pc 3 pc 15 pc 15 pc 15 pc 15 pc
Output = 30 pieces per day Output = 30 pieces per day
Cycle Time = WIP/Output = 270 pieces/30 pieces per day Cycle Time = WIP/Output = 90 pieces/30 pieces per day
= 9 days = 3 days
Little’s Law: Cycle Time = WIP / Output
17
18. Value Stream Map – Current
Takt Time = 30 minutes
Op 1 Op 2 Op 3 Op 4 Op 5 Op 6 Op 7 Op 8 Op 9
Spot
Turn Bore Drill Clean Pack
Inspect
Deburr Assemble
I I I I I I I I I
Face
30 30 30 30 30 30 30 30 30
C/T = 17 C/T = 3 C/T = 7 C/T = 33 C/T = 5 C/T = 22 C/T = 35 C/T = 37 C/T = 3
C/O = C/O = C/O = C/O = C/O = C/O = C/O = C/O = C/O =
Uptime = Uptime = Uptime = Uptime = Uptime = Uptime = Uptime = Uptime = Uptime =
# Shifts = # Shifts = # Shifts = # Shifts = # Shifts = # Shifts = # Shifts = # Shifts = # Shifts =
15 hr. 17 min. 15 hr. 3 min. 15 hr. 7 min. 15 hr. 9 min. 15 hr. 5 min. 15 hr. 22 min. 15 hr. 17 min. 15 hr. 37 min. 15 hr. 9 min.
Queue Time
Production Lead Time = 126 min. = 2 hr.
Time something waits
Processing Time = 137 hr.
to be processed
Process Efficiency = 1.5%
Cycle Time…
Time it takes to
perform the process 18
19. Value Stream Map – New
Op 1 Op 2 Op 3 Op 4 Op 5 Op 6 Op 7 Op 8 Op 9
Spot
Turn Bore Drill Clean Pack
Inspect
Deburr Assemble
I I I I I I I I I
Face
10 1 1 15 3 15 15 15 15
C/T = 17 C/T = 3 C/T = 7 C/T = 33 C/T = 5 C/T = 22 C/T = 35 C/T = 37 C/T = 3
C/O = C/O = C/O = C/O = C/O = C/O = C/O = C/O = C/O =
Uptime = Uptime = Uptime = Uptime = Uptime = Uptime = Uptime = Uptime = Uptime =
# Shifts = # Shifts = # Shifts = # Shifts = # Shifts = # Shifts = # Shifts = # Shifts = # Shifts =
5 hr. 17 min. .5 hr 3 min. .5 hr 7 min. 7.5 hr 9 min. 1.5 hr 5 min. 7.5 hr 22 min. 7.5 hr 17 min. 7.5 hr 37 min. 7.5 hr 9 min.
Takt Time = 30 minutes Production Lead Time = 126 min. = 2 hr.
Processing Time = 47 hr.
Process Efficiency = 4.4%
19
20. Value Stream Map – Entitlement
Op 1 Op 2 Op 3 Op 4 Op 5 Op 6 Op 7 Op 8 Op 9
Spot
Turn Bore Drill Clean Pack
Inspect
Deburr Assemble
I I I I I I I I I
Face
1 1 0 1 1 0 0 1 0
C/T = 17 C/T = 3 C/T = 7 C/T = 33 C/T = 5 C/T = 22 C/T = 35 C/T = 37 C/T = 3
C/O = C/O = C/O = C/O = C/O = C/O = C/O = C/O = C/O =
Uptime = Uptime = Uptime = Uptime = Uptime = Uptime = Uptime = Uptime = Uptime =
# Shifts = # Shifts = # Shifts = # Shifts = # Shifts = # Shifts = # Shifts = # Shifts = # Shifts =
.5 hr. 17 min. .5 hr 3 min. 0 hr 7 min. .5 hr 9 min. .5 hr 5 min. 0 hr 22 min. 0 hr 17 min. .5 hr 37 min. 0 hr 9 min.
Takt Time = 30 minutes Production Lead Time = 126 min. = 2 hr.
Processing Time = 4.5 hr.
Process Efficiency = 44%
20
21. Takt Time / Cycle Time Chart
40
Takt Time = 30 minutes
30
Cycle (minutes)
20
10
0
Turn Bore Drill Spot Face Clean Deburr Assemble Inspect Pack
Operations
22. Takt Time / Cycle Time Chart
40
Kaizen to
below TT
Takt Time = 30 minutes
30
Cycle (minutes)
20
10
0
Turn, Bore Drill Spot Face Clean,Deburr Assemble Inspect Pack
Operations
22
23. Takt Time / Cycle Time Chart
40
Kaizen to
below TT
Takt Time = 30 minutes
30
Cycle (minutes)
20
10
0
Spot Face,
Turn, Bore, Drill Clean,Deburr Assemble Inspect Pack
Operations
23
24. Standard Work Combination Sheet
Machinist #1
ELEMENT TIME
Minutes
CYCLIC WORK ELEMENTS VA = Value Added
NVA = Non-Value Added
(VA) (NVA) Total
ID DESCRIPTION OF MACHINE Manual Manual Manual Automatic (NVA) Wait for
OPERATOR WORK CAPACITY Operation Operation Time Walking Cycle
Time
1 Turn 1 12.0 5.0 17.0 0.0 0.0 0.0
2 Bore 1 0.0 3.0 3.0 25.0 0.0 17.0
3 Drill 1 7.0 0.3 7.3 0.0 0.0 20.0
19.0 8.3 0.0 0.0 0 30 33.75
TOTAL TIME BY CATEGORY==> .
11.25 22.50 45.00
70% 30% 0% 0%
% OPERATOR TIME BY CATEGORY==>
T/T
27.3
TOTAL CYCLICAL TIME==>
24
25. Standard Work
Production Line Operator
Cell 2
1 1 2nd Qtr. ‘09
New / Rev Page of Date
Part Number
MSV10S
Organization Area Supervisor
Part Name
Standard Work Sheet MSV Stem
Fern Bissonnette
Valves CFM Cell
Must include: 3 2 1
4
Drill Bore Turn
Spot Face
Sequence
Takt Time
Outside Cell
FPI
X-Ray
5 EDM
Clean
Standard WIP
8
6 9
7
Inspect
Deburr Pack
Assemble
Takt/Rate
Total Manual & Travel Time
Scope of Operations Standard
Standard
Quality Safety Time
Work-in-Process Operator Man/Travel Time
Check Precaution Work-in-Process 30 min.
151 / 30 = 5
Raw material
From:
Turns DPUs
Finished Goods
To:
25
27. A lean event is a process
4 Wks Prior 3 Wks Prior 2 Wks Prior 1 Wk Prior Event Week Present
Kickoff
Meeting
Define Project; CTQs; VOC
Goals & Objectives
The Event
Gathered Data and define
Hi-level process map;
Set initial target sheet;
Conduct Analysis to further
define Scope
Finalize Setup Needs;
Finalize Analysis
LEAN EVENT
Follow-up Items
Continuous Training and Information Sharing/Updates; Team Meetings
D DM M A AI IC
The Lean Event is the “I” in DMAIC
27
28. Kaizen Event Forms
Team members T/T C/T Bar Chart Takt Time - Cycle Time
TEAM MEMBERS
listed showing bar chart completed
T/T
internal vs. external for area to be worked.
to area being worked. Must reflect actual data.
A B C D
1
4
A
Show at least 1
B
C
Std. Work Sheet
Narrow focus of D
standard work
2 - 3 key goals & 3
sheet depicting
2
objectives for
Goals & Objectives 1
a major process
4
the week.
in the area. Others
6
5
can be done during
week with team.
2
5
A
Show at least 1
B
Fill the target C
Std. Wk. Comb.
TARGET SHEET D standard work
Sheet out with T/T
combination
Current status data
sheet depicting
of the CTQ’s for the
the major process
Workout.
shown on page 5.
Others can be done
3
during week with team.
6
Other Forms may be useful depending on the situation.
28
30. Lessons from the Field
Implementing a sustaining Culture is step one.
“Yeah buts...” become the topic of future Kaizen teams.
Training on a few operations at a time resonates well.
Lean is a Journey, not a Destination.
Kelly Davis 801-592-4364
Scott Kisling 801-467-1287 30