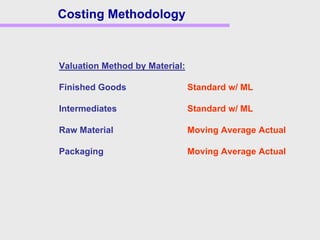
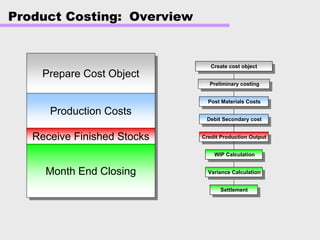
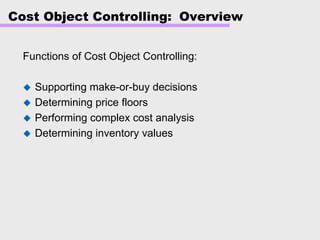
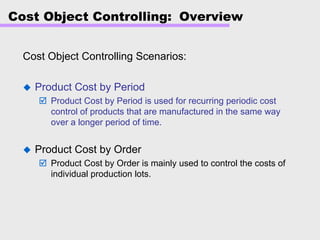
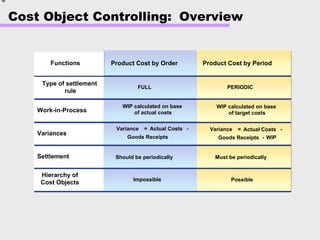
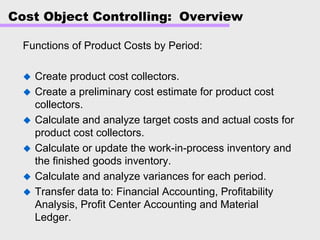
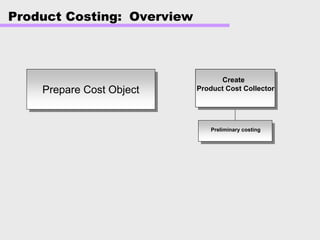
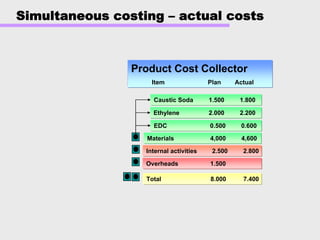
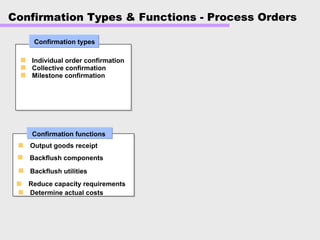
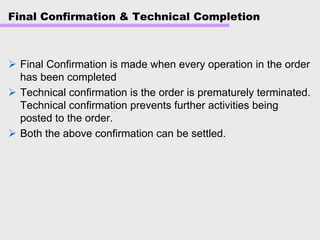
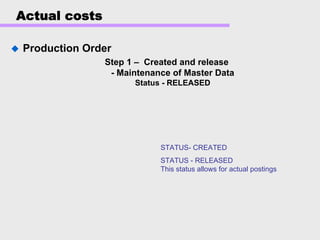
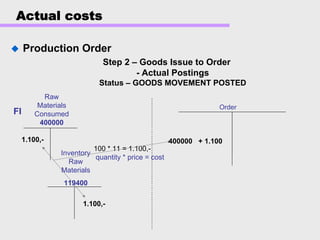
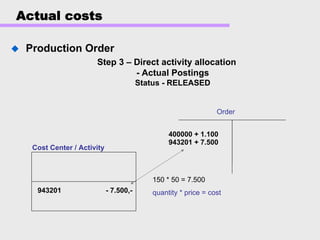
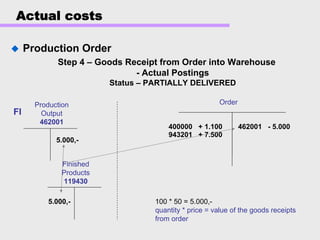
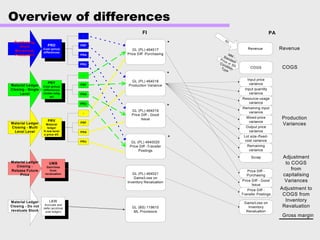
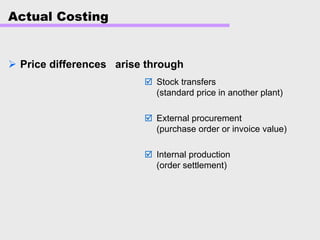
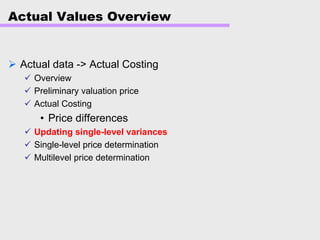
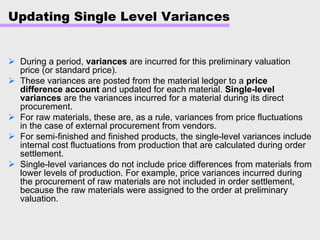
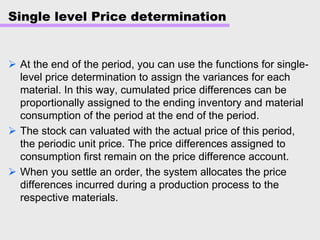
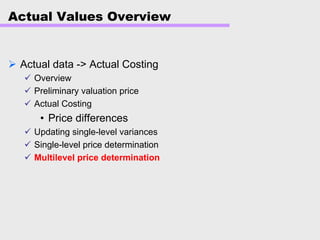
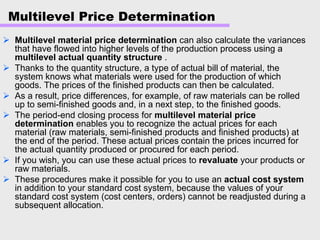
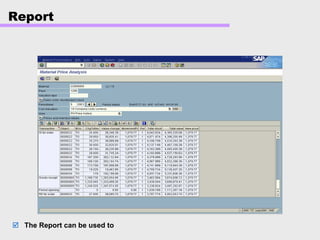
Product costing and material ledger documentation was summarized as follows:
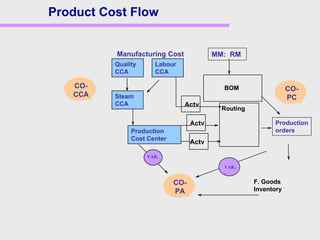
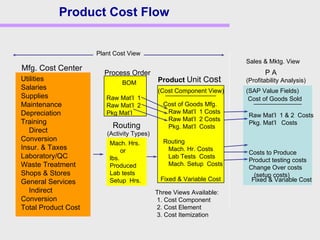
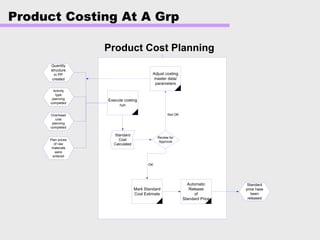
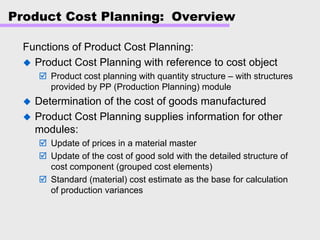
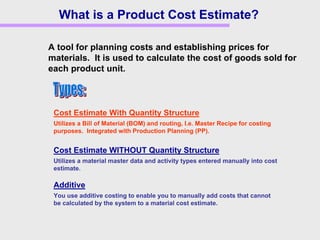
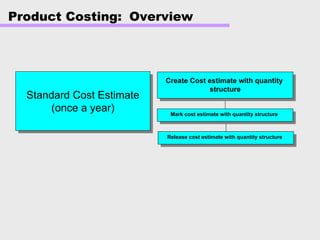
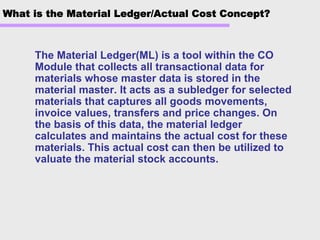
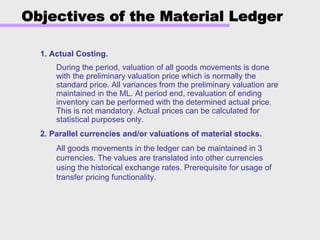
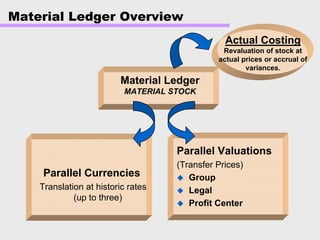
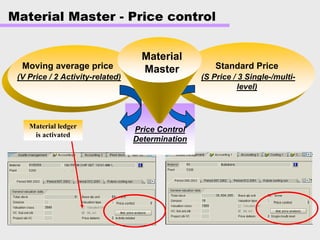
[1] Product costing allows companies to plan, track, and analyze product costs from raw materials procurement through production to the final cost of goods sold. The material ledger provides actual costing functionality to revalue inventory costs.
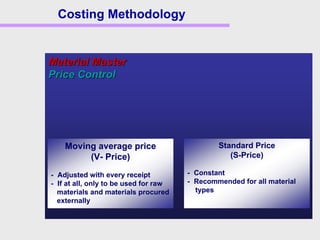
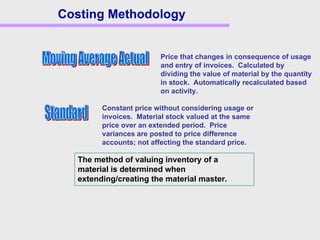
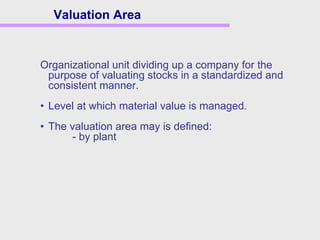
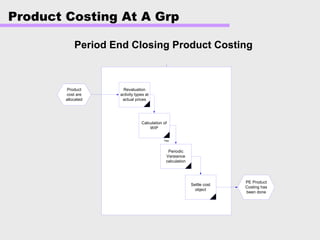
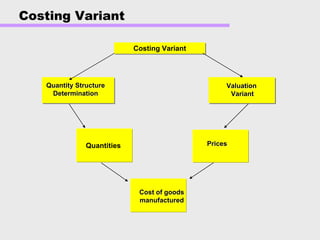
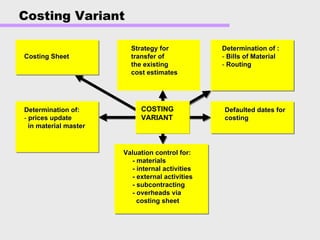
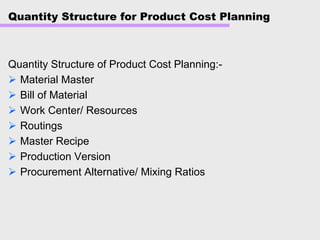
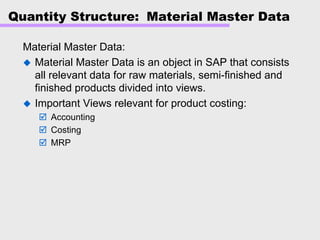
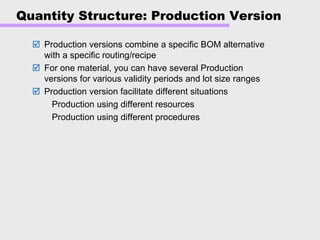
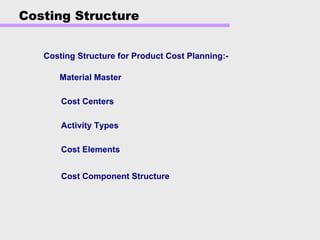
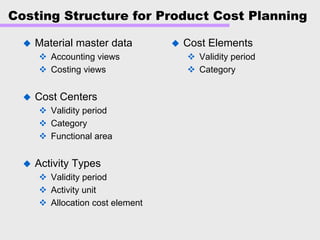
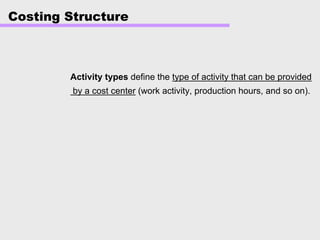
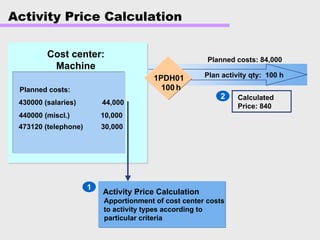
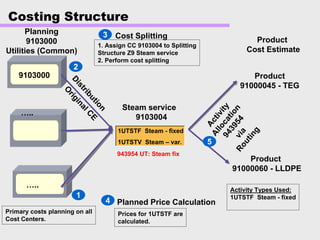
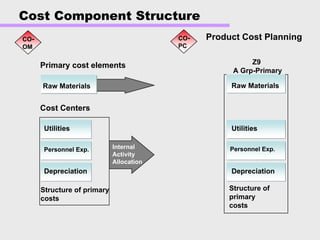
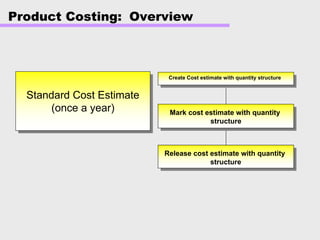
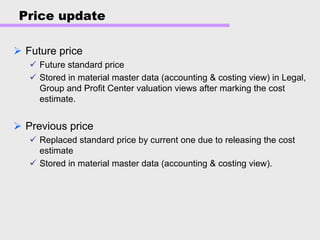
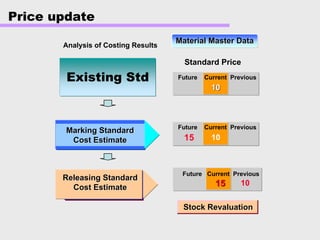
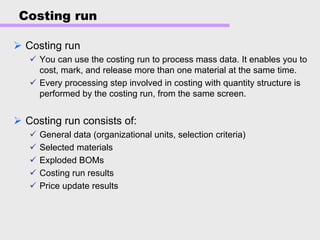
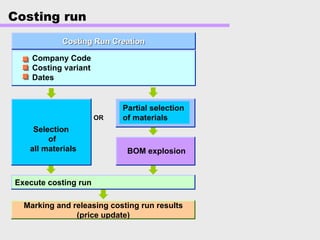
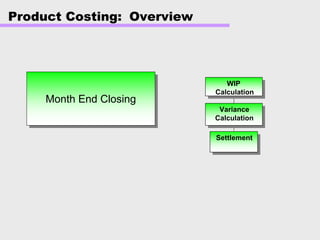
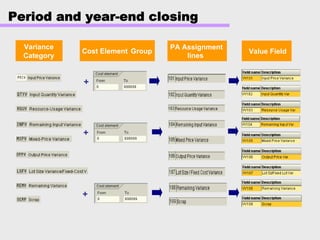
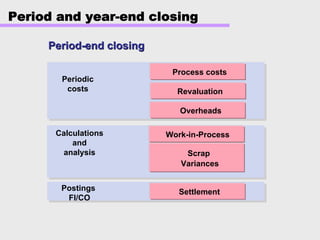
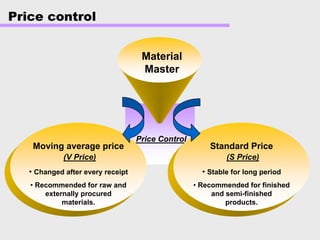
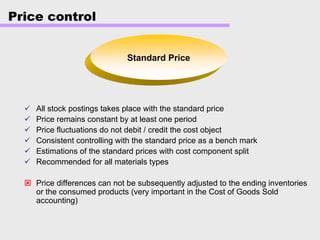
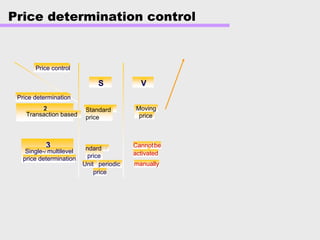
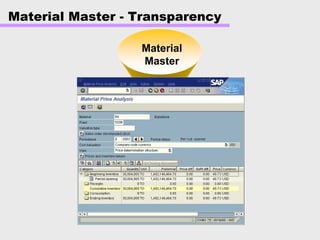
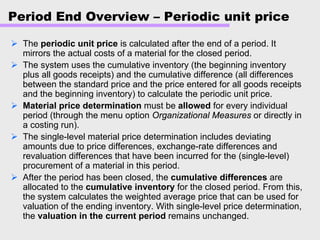
[2] Key aspects of product costing include establishing standard costs, performing costing runs to calculate costs, and updating material master prices. The costing structure includes activity types, cost elements, and cost centers.
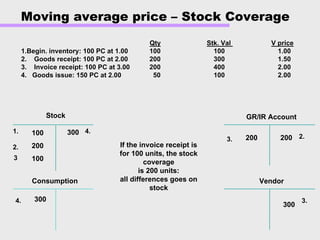
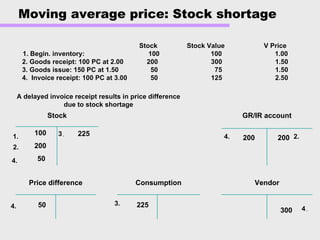
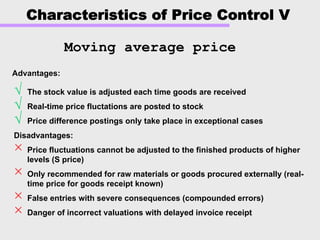
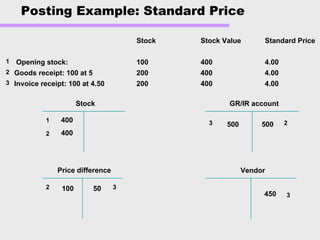
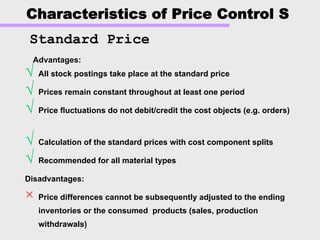
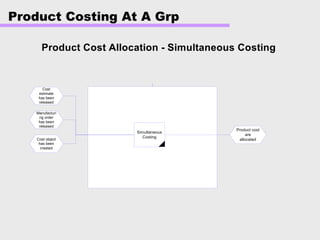
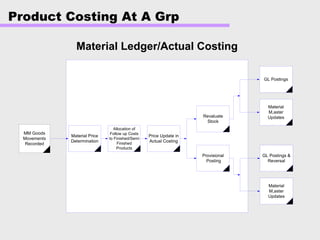
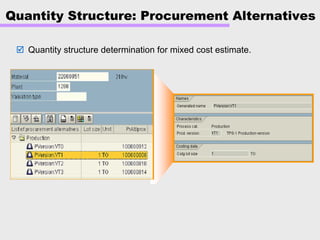
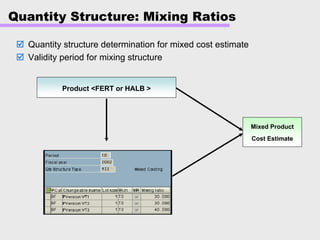
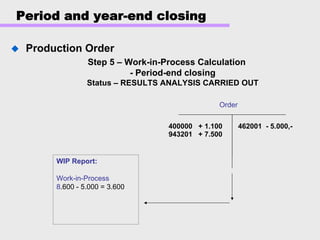
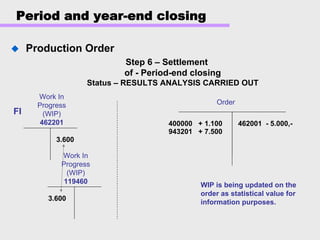
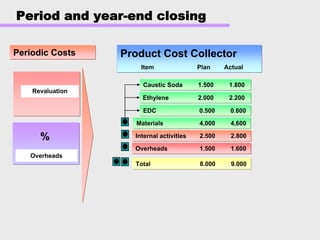
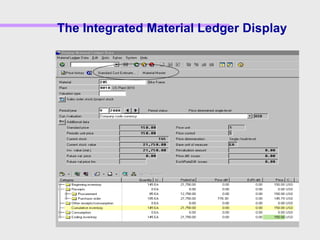
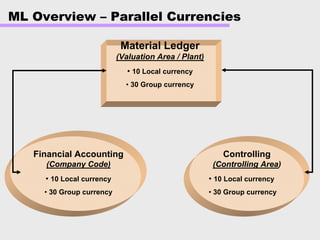
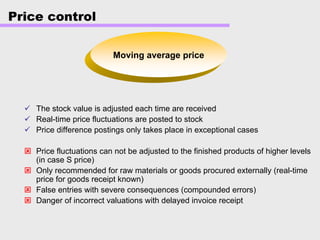
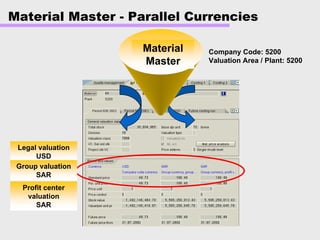
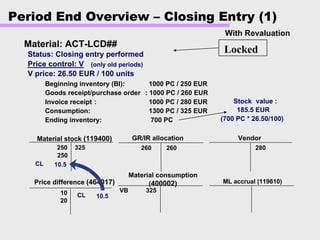
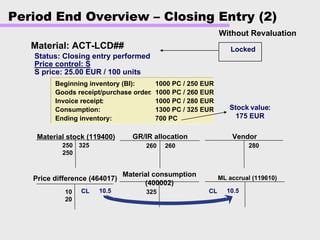
[3] The material ledger allows companies to determine actual costs for materials and revalue inventory using methods like moving average or standard price valuation.


![Getting Started with Apache Spark: Big Data Made Simple [Free Meetup]](https://cdn.slidesharecdn.com/ss_thumbnails/apachesparkgettingstarted-260203175547-8361bcc3-thumbnail.jpg?width=640&height=640&fit=bounds)


