SlideShare a Scribd company logo
1 of 19
Download to read offline
2-1
Integrated ABC in R/3 2Chapter 2
Integrated ABC in R/3
This chapter clarifies the concept of integrated Activity-Based Costing (ABC) in
the SAP system and its implementation in the R/3 CO component.
The Integrated ABC in the SAP Business Framework
The integrated ABC in the
SAP World
The SAP Business Framework, which is shown in its simple form in Figure 2-1,
includes the R/3 system with its application components; these are namely Fi-
nancial Accounting (FI), Controlling (CO), and logistical applications such as Pro-
duction Planning (PP) or Sales and Delivery (SD). There are new SAP products,
which are not part of the R/3 core system. Nevertheless, these are integrated with
the R/3 system through interfaces. These products include the Business Informa-
tion Warehouse (BW) and Strategic Enterprise Management (SEM). The impor-
tance of ABC for these products is clarified in the initial chapter.
Fig. 2-1: SAP Business Framework.
The ABC application (labeled ABC in the figure) uses all parts of the R/3 CO component.
Important for ABC is the fact that components FI and CO are integrated. This
means that the type and value of expenses posted in FI appear in CO as well.
Thus, the controlling component always compiles from current, operational cost
data. Integrated ABC works out of the CO component and uses all of its applica-
tions (CO-OM, CO-ABC, CO-PC and CO-PA), which are briefly described in the
first chapter.
Value Flow in R/3 COCost Center Accounting (CO-OM-CCA) normally dispenses all costs of a firm’s
resources to cost centers, which are structured according to areas of responsibility.
The remaining CO applications build on CO-OM-CCA.
2-2
2 Integrated ABC in R/3
Fig. 2-2: Integrated ABC with R/3 CO
CO-ABC offers the business process as a complete controlling object that can be allocated to cost
objects as well as to market segments.
CO-ABC provides the business processes that can also be applied across cost centers.
This means that a business process can utilize several resources from different cost
centerssimultaneously.Businessprocessescanalsobedebitedwithcostsdirectlyfrom
financial accounting. However, this approach can make the accountability for such
costs unclear within the organization. This might be a sensible approach for some
costs, like operating materials or supplies (lubricants for a maintenance process), that
abusinessprocessconsumes.Productrelatedbusinessprocesscostscanbeaccurately
assigned to products or jobs, like orders or projects. This occurs through the Product
Costing application (CO-PC). Thereby, process costs flow like material or direct pro-
duction costs into the manufacturing costs of the product. This makes it possible to
identify the process costs within the manufacturing costs, and therefore to include
process costs in stock valuations. Business processes not related to production are
assigned to the relevant market segments through the Profitability Analysis (CO-PA)
application, where you can find the corresponding revenue figures. Process costs that
are a part of production costs are automatically released to CO-PA, as direct costs are.
Master Data and Structures
Following is an overview of the master data and structures, which are important
for ABC, as well as their essential characteristics .
Cost Centers and Activity Types (CO-OM-CCA)
Resources Different resources from a cost center (which can be similar to a department) are
defined through various cost center activity types. The resources provided by a
cost center are utilized through the consumption of activity types from one cost
center by other cost centers, orders or processes. The quantity utilized is priced
retroactively from rates based on existing costing policies. This allows the system
to accurately assign costs to the responsible processes depending on the resources
actually consumed.
2-3
Integrated ABC in R/3 2
Below are examples of activity types for cost centers from various branches:
u Production: drilling hours, wages hours, and so on.
u Service: plant maintenance hours, inspections hours, and so on
u Administration: clerical hours, sales hours, and so on
It is important that the activity quantity of an activity type be linked to a cost
center. An view across cost centers is not possible with activity types.
Business Processes (CO-ABC)
Business processes represent cross-functional procedures within an enterprise (for
example, material procurement). Usually multiple cost centers participate in the
execution of a business process. Business processes utilize various resources, which
are made available by cost centers (for example, clerical hours in the purchasing
and quality management cost centers, as well as wage hours of stock workers
from the stock/inventory cost center).
Organizational Assignment
of Processes
As with a cost center, a business process is defined within a controlling area for a
particular company code (which is assigned to the aforementioned controlling area).
This ensures that the process assignments reconcile with financial accounting.
Process Characterization
through Attributes
You can classify your business processes through particular process attributes, which
are specified in master data. For example, order processing can be partitioned into
price quoting, order validation and shipping. These are labeled with different grades
of value added as appropriate. You may create as many attributes as necessary.
The following attributes are delivered with the standard package. The values that
these attributes can assume are set in customizing.
u External Value-Added:
External value-added specifies how much a process raises the product value
externally (for example, for a customer). A possible classification is low, mid-
dle, and high value-added. An example of an external value added process is
the delivery of goods to the customers that one could give a high classification
to in a Just-In-Time industry.
u Internal Value-Added:
Internal value-added processes bring marginal satisfaction to the customer,
but are crucial for internal operations. The logistics required to prepare mate-
rials for production would be one instance.
u Business Process Type:
The business process type specifies to which area of the enterprise the process
is assigned; for example, sales, development or production.
u Cost Behavior:
The cost behavior indicates from what the process costs are dependent (for
example, the number of lots or batches, or the volume of production).
u Attribute 1 and Attribute 2:
The firm can set these attributes completely separately.
Business process attributes can provide important information on how to opti-
mize processes. For example, one can make a broad attempt to eliminate process-
es that add only marginal value.
2-4
2 Integrated ABC in R/3
Products and Jobs (CO-PC, CO-OM)
Material Master Record Products are normally defined in the material master record of the R/3 system.
This master record contains numerous control parameters for logistics. This is how
parameters are defined in the master record; these parameters determine the meth-
od used to calculate the overhead cost assignment for the respective product . The
master record also contains the calculation results in the form of standard costs for
the product. These standard costs are used to determine stock levels, among other
things.
Cost Objects The R/3 system represents tasks as cost objects (for example, production orders,
customer orders, internal orders, and others). You can couple a cost object with a
product (for example, production order for a specific product), or a certain job
description, which is independent of a product (for example, a trade fair order).
Plan costs are recorded on cost objects, and periodically compared with incurred
actual or target costs. This makes job costing possible at the cost object level.
Market Segments, Characteristics and Value Fields (CO-PA)
Multi-Dimensional Market
Segments
To analyze corporate performance, it is not enough to implement job costing at the
product level. Of more interest are multi-dimensional market segments that distin-
guish themselves through a myriad of characteristics. You can analyze the profit-
ability of a product in a specific region, customer group and distribution channel
simultaneously. This multi-dimensionality is especially meaningful for the service
industries, which often see their products as much more than one-dimensional.
Multi-Level Contribution
Margin Accounting
You can log revenues, sales deductions, discounts and returns, and costs of any
kind as well as quantity key figures for each market segment in the respective
value field. You can build up information for multi-level contribution margin ac-
counting through the proper structuring of profitability reports according to val-
ue field.
Statistical Key Figures (CO)
Resources and
Process Drivers
Statistical key figures are used in CO to generally characterize cost centers or pro-
cesses. They also enable the entry of driver quantity data. They can serve as re-
source or process drivers. The resource driver describes the amount of resources
utilized, and the process driver gives the number of process executions (for exam-
ple, number of orders, palette movements, and more).
Information Structures in the Logistic Information System (LIS)
Automatic Recording of
Driver Quantities
Alarge number of processes would make the periodic updating of driver quantity
calculations very labor intensive. The Logistic Information System (LIS) makes it
possible to record numerous drivers automatically. The update of driver quanti-
ties occurs during the execution of R/3 transactions in the LIS information struc-
ture. For instance, this allows the R/3 system to calculate the number of config-
urable order items when a customer order is created, and to save this in an appro-
priate information structure at the level of ”Customer, Product, Distribution Chan-
nel” as a LIS key figure. This information can later be used by CO-ABC to assign
process ”Product Configuration” to the corresponding market segments. This func-
tionality is especially important for an efficient ABC solution.
2-5
Integrated ABC in R/3 2
Methods of Integrated ABC
In general, there are two techniques for assigning cost center resources to business
processes (via resource drivers), and assigning business processes to the corre-
sponding receiver objects (via process drivers). We refer to these methods as push
and pull respectively, and describe them below. Deciding for one of the two ap-
proaches has far reaching consequences regarding the capacity of ABC as a man-
agement tool in your organization. In principle, it is possible to apply both meth-
ods in parallel in one ABC model. Management will use the pull approach, which
offers more capacity, or the other based on its needs.
The Push Approach
Simple cost distributionThe push approach is one of ”simple cost distribution”. Costs from the cost center
resources are distributed over the business processes based on the resource driver.
The resulting process costs are then assigned to the respective products, custom-
ers, or other objects, in a second step (see Figure 2-3). The process driver in the
push approach is used solely as a tracing factor to distribute costs to the receiver
objects, such as cost objects, market segments, and others. To implement the push
approach, the R/3 system offers assessment and distribution, which are described
below. The assessment posts costs under a secondary cost element, and is thus
suited to clarify what costs are used for, when assigned through the assessment.
On the other hand, the originating primary cost elements (for example, wages,
salary, and raw material) are preserved by the receiver during the distribution. It
is useful when the origins of costs are more interesting than their causes. As of
release 4.5, it is also possible to layer costs under several cost elements when using
the assessment technology. This enables the user to regroup primary cost elements
into a few meaningful secondary cost elements.
Fig. 2-3: The Push Approach
Costs originate from cost centers and are distributed to business processes through resource
drivers, and later to products, customers or other objects through process drivers.
2-6
2 Integrated ABC in R/3
Resource Consumption
Tracing Factors as
Resource Drivers
Both methods can be used to assign cost center resources to processes. The tracing
factor represents the resource driver in the assessment and distribution cycles in both
cases (see Figure 2-4). For example, the resource driver can appear as a statistical key
figure of a business process representing a measurement for the resource consump-
tion. This statistical key figure can be taken, when necessary, from the Logistics Infor-
mation System (LIS) by establishing a link between the LIS key figure relevant to the
resource driver, and the statistical key figure of the business process. As an example,
the ”Number of Purchase Orders” can be logged automatically in a LIS information
structure whenever the relevant transaction is executed. You can also assign resourc-
es to business processes using fixed percentages or some other distribution key. The
push approach is unable to identify variable cost components in a business process.
Fig. 2-4: Cost Center Assessment and Distribution
Resources from the cost center Quality Management can be assessed or distributed to the respec-
tive business processes through the resource driver labor hours.
Process Consumption
Business Process Assessment To assign business processes to receiver objects, the R/3 System offers the assess-
ment method because in ABC the cause of consumption costs for the receiver is
normally the dominant issue. Process drivers appear as tracing factors in the as-
sessment cycle just like the resource drivers do. The LIS can thereby serve as a
source of relevant cost driver information for process drivers, as it did for resource
drivers in the scenario described above. If you make a process assessment directly
on to the profitability segments in the Profitability Analysis component (CO-PA),
the value fields in the operating concern serve as the tracing factors. In order to
create a causal relationship between profitability segment and process consump-
tion, you can transfer the cost driver information from the LIS to the correspond-
ing value fields (see Figure 2-5). For process costs taken from the assessment, no
variable cost portions are identified in the receiver object.
2-7
Integrated ABC in R/3 2
Fig. 2-5: Process Assessment
Process costs from the purchasing process are directly assessed onto the corresponding profit-
ability segments by means of the process driver ”Number of Orders”. The system automatically
logs the process driver quantity in the LIS originally.
Completely Crediting SenderThe cost center distribution, cost center assessment and the process assessment
are purely value calculations that ultimately completely credit the sender object.
Assessments are also made in order to transport cost center or processes variances
to the profitability analysis.
Push Approach used for Full
Cost Absorption
The push approach is easy to implement, but allows for limited analysis. The push
approach ”method” of value calculation merely allocates costs from sender to re-
ceiver. The driver used in the assignments are not posted. The assignment of fixed
and variable costs is not possible because the quantity flow is not measured. Fully
absorbed costs are allocated in each case. The operating rate and capacity utiliza-
tion of the sender object cannot be identified through the sender object. You could
carry out a variance analysis in this case only through a plan / actual comparison
at the cost element level.
This relatively imprecise method is used often because it is easy to implement also
in non-integrated systems.
The Pull Approach
Quantity Based Cost
Assignment
Highly integrated systems support the more precise quantity based cost assign-
ment. It provides the basis for the pull approach. The underlying quantity flow is
an objective measure for the activities performed for the various cost perspectives
of the enterprise, independent of the valuation of quantities. The term pull em-
phasizes that this method calculates quantities utilized retroactively, and does not
distribute or push costs fowards. Quantities are actively pulled by the receiver
objects and evaluated with costs in a second step. The following example of an
enterprise planning cycle clarifies this method. However, it is valid for the assign-
ment of actual quantities and costs as well.
2-8
2 Integrated ABC in R/3
Fig. 2-6: The Pull Approach.
Starting with the sales plan, process and resource quantities to be made available are ”pulled”
based on a causal driver relationship. Primary cost planning occurs in cost centers on this foun-
dation. The resulting price calculation for resources and processes valuates the entire quantity
structure with costs.
Building a Quantity Structure The pull approach begins at the end of the value adding chain (see Figure 2-6).
Operations and sales plans make up the foundation. Process driver relationships
describe the causal relationship between the planned sales quantity for various
market segments and the process quantities to be utilized. If after executing the
planned process quantity assignment, the planned process quantities are known,
the system uses these to calculate the resource quantities. Normally, resource driver
relationships are used in the form of average quantities for the resource consump-
tion per process execution. A realistic primary cost plan is now possible through
the known resource quantities. From this point, a continuous plan quantity struc-
ture exists for the firm.
Valuating Quantity Structures The plan prices for the various resources (activity types) can now be automatical-
ly calculated based on capacity or planned quantity. Manually set prices are also
possible to allow management to valuate activities as it sees appropriate. The meth-
od chosen to calculate prices basically determines how powerful ABC will be as
an information tool. The consequences are discussed in another section. Resource
quantities used by the processes are valuated with the prices. This influences the
cost flow from cost centers to processes. The process cost and quantity make up
the process price, which valuates the quantities utilized by the market segments
or products. This makes the assignment of costs to the receiver accurate. The price
calculation and valuation of the quantity structure is an iterative process that guar-
antees the correct handling of circular relationships in this structure. For the valu-
2-9
Integrated ABC in R/3 2
ation of the actual quantity structure, the system uses the plan prices. The actual
activity price calculation, based on posted actual costs and quantities supports the
calculation of prices at period end, and completely credits the cost centers. Thus,
while seasonal price changes are normally accepted, this is not the case from the
perspective of ABC.
Resource Consumption
The methods supported by the R/3 system to assign resources to processes based
on quantities are the direct and indirect activity allocations, the target=actual as-
signment as well as the structured process.
Direct Activity AllocationWith direct activity allocation, the resource driver is manifested by an activity type
that represents the output produced by a cost center resource (such as employee
hours or kilowatt-hours, among others). This form of resource assignment is the
most accurate approach, but at the same time the most time-consuming because
you must measure and enter the exact quantities of resource outputs consumed.
This usually occurs as a manual confirmation of quantities on both the sender and
the receiver sides. If a manual time confirmation of resources is set through CATS
(Cross Application Time Sheet), the system carries out a corresponding direct activ-
ity allocation in the background. The process is thus one of the possible receivers in
CATS. Data from other systems can also be posted in the R/3 for driver quantity
entries as direct activity allocations through BAPI’s (BusinessApplication Program-
ming Interface) or through the batch input method. All validations of the direct
activity allocations go through this automatic allocation in the background.
Fig. 2-7: Direct Activity Allocation.
The resource quantities utilized are either manually or automatically allocated to the processes,
and then valuated with the corresponding price.
2-10
2 Integrated ABC in R/3
The indirect activity allocation uses the tracing factor of a corresponding cycle as
resource driver, as it does with both push approachs. The difference, however, lies
in the fact that the resource driver is not used for cost distribution, but rather as
the basis for assignments of quantities. Indirect activity allocation can be applied
in two variations. With the manual variant, you assign the known resource quan-
tities from the cost center to the business processes in relation to the resource driv-
ers (tracing factors). With the retroactive variant, the resource driver quantity (for
example, number of orders) is multiplied with the standard quantity (for exam-
ple, 2 min. per order); this ultimately determines the resource quantity utilized by
the process. The total of all resource quantities consumed by business processes
equals the total output of the resource by the cost center (see Figure 2-8).
Fig. 2-8: Inverse Indirect Activity Allocation.
The driver quantities for the number of orders are known for both purchasing processes. On
average, each inland order takes 0.1 clerk hours (the sender value of the cost center/activity
type). An international order is twice as expensive, which comes to a receiver weight factor of 2.
Both processes require a total of 1,400 clerk hours from the purchasing cost center. This repre-
sents 84,000- in resource costs. This gives a price of 60-/hr that is used to value the quantities
consumed by the respective processes.
Target=Actual The target=actual allocation also uses an inverse approach to determine resource
consumption, but returns actual quantities only. The R/3 System uses individual-
ly confirmed actual process quantities and considers the corresponding plan quan-
tities to calculate an operating rate. If resource outputs are difficult to measure,
plan quantities consumed by processes are multiplied by the operating rate to
calculate target quantities. Assuming that the execution of individual processes
can be standardized, and that the relationship between the planned resource con-
sumption and process quantities are realistic, then the target quantities determined
beforehand are set as the actual quantities.
Indirect Activity Allocation
2-11
Integrated ABC in R/3 2
Structured processes offer the greatest flexibility to assign output quantities of the
cost center resources to business processes. The template, or process template,
which is attached to the master record of a process, explicitly describes the struc-
ture of this process. Similar to a routing for direct activities, the template describes
the indirect activities that occur during each execution of a business process. It
defines which cost center resources are consumed by the business process and in
which quantities. The template is a highly flexible tool because it allows you to
determine what resources are consumed and calculates consumed quantities dy-
namically. This means you can model complex resource drivers by means of func-
tions and formulas. The template also allows you to distinguish between variable
and fixed quantities consumed (see Figure 2-9, Process Order Configuration). The
variable quantity factor represents an average quantity for each business process
execution, which when multiplied by the process output equals the variable out-
put quantity of the resource consumed by the process. The fixed resource quantity
utilized is independent of the process output and can therefore be compared with
a ”stand-by” resource. The process uses this, even when it is not carried out. The
costs consumed with the structured process approach can be divided into fixed
and variable portions.
Fig. 2-9: Templates for Structured Processes
Structured Processes
2-12
2 Integrated ABC in R/3
Process models with several layers can be implemented through the structured
process since sub-processes can be included in the template next to the tasks/jobs
at the cost center level; these portions of processes can in turn have a structure
(template) (see Figure 2-9, process order processing). With multi-step business
process models, note that you must ensure a causal relationship between the pro-
cess drivers of the main business process and the process drivers of the sub-pro-
cesses as well as the resource drivers at the task level. Only if you ensure propor-
tionality between the drivers at the various levels will the allocations of the result-
ing resource inputs make sense solely via the cost driver of the primary business
process.
Tasks represent a link between cost center accounting andABC because they make
up the base of both functional and process oriented structures. On the one hand,
tasks represent the lowest level of the process segmentation. On the other hand,
they correspond to the activity types of the cost centers (see Figure 2-10). The
relationship between the activity types and the task produces a task catalog con-
taining the average quantity of an activity type that is required when executing a
task. The resources consumed by tasks are valued through the utilization of activ-
ity types; here, the cost center is credited, and the process or sub-process is debit-
ed. No costs are assigned at the tasks level because these are known through the
activity type price and standard activity type quantity for the task.
Fig. 2-10: Tasks as Links between Functional and Process Oriented Structures
Process Consumption
In order to assign business processes to receiver objects based on quantities, you
can use all the described methods of quantity assignment for resource consump-
tion. Instead of resource drivers, the process driver serves as the measurement for
consumption of overhead business processes by the receivers. The methods of
direct and indirect process allocation, and target=actual allocation will therefore
not be described in detail here.
Tasks
2-13
Integrated ABC in R/3 2
Fig. 2-11: Template for Product/Cost Object
Through functions, the templates access process driver relevant information from the cost object
environment. User defined formulas allow a dynamic calculation of the quantities pulled by the
cost object, and valuated with the process price.
In addition to the structured processes, the dynamic process allocation is another
method that supports the use of the template. With this method, processes are
equitably assigned to cost objects or market segments over the appropriate pro-
cess driver. The functionality for processes introduced below is also available for
the activity types of the cost centers.
Template for Cost Objects
The template can dynamically (automatically) ascertain the processes relevant for
a cost object. The R/3 System automatically calculates the process quantities uti-
lized at the time of costing using process driver relevant data in the environment
of the cost object (see Figure 2-11). A wide spectrum of functions, as well as user-
defined formulas, allows you to model complex process drivers. The process quan-
tities consumed by the cost objects are posted differently to allow the process costs
accepted by the cost object to include both variable and fixed amounts. The pro-
cess costs of a cost object can also be identified in aggregate form in the profit
analysis through the cost component split.
Dynamic Process Allocation
2-14
2 Integrated ABC in R/3
The template represents a general description of processes and process quantities
independent of the costing object. You can use the template to determine quanti-
ty-based utilization of business processes by cost objects. It consists mainly of four
columns: the object (process), the driver quantity, the activation, and the alloca-
tion event (see Figure 2-12). The individual columns answer the questions: which
process, under which conditions and with what quantity is assigned to the cost
object at what time. The following example concerning material movement pro-
cesses underscores the high flexibility of the template in determining driver quan-
tities. This flexibility and the resulting high degree of automation for quantity
based assignments makes the template a key tool for the pull approach.
Format and Function of the
Template in Costing
Fig. 2-12: Format of the Template for Cost Objects
Which Process? The template can identify the utilized processes during the calculation. A user
defined approach to find a material movement process can be structured around
the following logic. An enterprise is made up of several plants. Each plant has a
materials movement process that supplies the necessary stock materials for the
production line. For this process, each plant uses various resources, resulting in
various process prices at the separate plants. Each process carries with it an orga-
nizational attribute containing the plant. All materials movement processes are
summarized in a process group. The costed product in question here is produced
in plant A. The user-defined approach automatically identifies all material move-
ment processes from the process group that match the plant attributes of produc-
tion plant A.
Under which conditions? The quantity and activation columns each distinguish plan and actual data. The
activation columns contain conditions under which the process is executed. With
the previously mentioned example concerning material movement processes, you
can check whether the costed product is completely or partially produced in-house.
Outsourced products deactivate the process. Usually, an activation condition in
plan agrees with that in actual.
2-15
Integrated ABC in R/3 2
Which process quantities in
plan and actual?
However, this does not pertain to driver quantity calculations. Though the pro-
cess driver in plan and actual are identical (for example, the number of palette
movements for a material movement process), the corresponding driver quanti-
ties in plan and actual are calculated differently. The calculation of palette move-
ments for a specific production order in plan must comply with a model based on
master data values because during the plan calculation, no movement data exists
(see Figure 2-13). On the other hand, the number of material movements that in
fact occurred can be deduced from the posted material voucher. Of course, you
can also use fixed standard quantities, utilized by a cost object (for example, pro-
duction order), in the respective columns. You can enter an order planning pro-
cess quantity of 1 in the plan as well as in the actual if this process is always
utilized only once per production order.
Fig. 2-13: Template Formula for Dynamic Driver Quantity Determination.
The formulas for the driver quantity determination in the plan can vary from the actual formulas.
Flexible Functions for Com-
plex Drivers
With the flexible template functions you can implement in the R/3 system your
choice of firm specific driver formulas which are based on R/3 table structures. In
our example, we will now see how the calculation of the number of palette move-
ments for the manufacture of one product type with a specific lot size can be ef-
fected in the plan through a flexible function (see Figure 2-14). The flexible func-
tion used here is from the standard R/3, and runs through all BOM items (BOM
table) of the material that is in manufacturing. For each item, the system carries
out the user defined algorithms that calculate the number of palette movements
for the respective BOM component. The calculated quantity of a component need-
ed is the product of the BOM quantity (standard function) and the production lot
size (standard function). This is subsequently divided by the number of compo-
nents (standard function) contained in a palette (listed in the material master record
of the component). Because an entire palette must be moved even when only a
portion of its contents is needed, the quotient is rounded to the next whole num-
2-16
2 Integrated ABC in R/3
ber. To complete the calculation, the flexible function adds the results at the item
level and offers the sum of the palette movements for this product as the driver
quantity.
Fig. 2-14: Flexible Function.
The total number of palette movements for the material consists of the sum of the palette move-
ments corresponding to each component. The values for the components come from the material
BOM’s and the material master records of the components.
When does the
allocation occur?
Because cost objects imply controlling jobs that may exist over various periods,
the right time frame to assign the process to the cost object becomes an issue. The
column for the allocation event allows you to control events like the start or deliv-
ery of an order. The processes are then assigned to the cost objects only within the
respective period containing the desired event. This column is therefore only rel-
evant for the assignment of the actual driver quantity. It can play an important
role for the WIP calculation. Many functions for the actual quantity calculation
automatically supply period relevant results. For such functions, no allocation
event control is needed.
Reusable Template A template can be used for many cost objects. The template for the concrete object
(product) is automatically identified and valued when the product costing is run.
You can use the same template for many, or even all products. The template does
not have to be maintained for each product, as is the case with the routing and the
BOM. The ability of the template to determine the process and to calculate process
quantities dynamically makes it a powerful tool since a single definition can be
reused any number of times; for example, the same formula used to calculate the
palette movements is valid for all products, but needs defining only once. You can
make existing templates subordinate to main ones, and thus extend the usability
of these templates even further, and simultaneously reduce the time needed to
create or adjust main templates.
2-17
Integrated ABC in R/3 2
The costing of the cost object occurs at various points during its life cycle (see
Figure 2-15). This makes job costing comprehensive enough to include process
costing. The planning activity for a cost object begins with the non-order-generat-
ed product costing which determines the standard price for the product. Opening
an order initiates preliminary costing. Actual costs that are entered during pro-
duction are constantly controlled. At the conclusion of specific periods various
milestones or reporting points, actual quantities, material consumption or pro-
cesses can be confirmed; this helps check the compliance of the cost estimates. The
conclusion of an order finalizes the costing, which calculates the actual order costs
and compares these with the planned ones; this guarantees the controlling of costs
for each order at any time.
Calculation Occurrences
Fig. 2-15: Overview of Costing Methods at Various Times
Templates for Market Segments
Processes not driven by production, but rather by customers, distribution chan-
nels, regions or other items, can be assigned directly to the corresponding market
segments in the profit analysis according to their quantitative consumption with
the help the template The template referenced here and the one used for cost ob-
jects differ only marginally.
Process Drivers of the Market
Segments
Template functions can automatically calculate process driver quantities based on
the profitability analysis information. The LIS and external systems can also serve
as sources for this information (see Figure 2-16). For example, the system calculates
the plan driver quantity for process ”order taking” based on the sales quantities per
customer and product planned in CO-PA. The system can calculate the driver quan-
tity ”number of order items taken” by assuming an average order quantity per or-
der item and making the number of order items taken equal the planned sales quan-
tity divided by the average ordered quantity per order item. The LIS can serve as a
data source to calculate the corresponding actual driver quantity. The system can
automaticallylogthenumberofactualorderitemspercustomerandproductthrough
a LIS information structure. The template directly accesses the corresponding LIS
key figure of the information structure whose characteristic values correspond to
the market segment, which consumes the process as receiver object.
2-18
2 Integrated ABC in R/3
Fig. 2-16: Templates for Market segments
The driver quantities can be available directly in the of the value fields of CO-PA as well as in the
LIS or external system.
Template Assignment and
Assignment Levels
The template for market segments can also be reused. The search approach in this
case is tied to characteristics of the market sector. This allows you to assign a tem-
plate at a high level (for example, to a region), or at a more detailed level (for
example, to customer groups or product groups). The higher the defined assign-
ment level is, the more often you can reuse the template because the higher levels
encompass all the market segments of the respective detailed levels. It is impor-
tant that the level of the template assignment be different from that of the process
assignment. The assignment can be controlled by all means through the region or
the sales organization. The assignment occurs at the customer group / product
group levels and even at the customer / product levels.
Push versus Pull
The effect that the chosen method has on how the firm is controlled is discussed
below.
Consequences of the Push
Approach: Full Cost
Absorption
Pure cost distribution methods make it possible to realistically assign overhead costs
to their originating receiver objects with the appropriate driver (such as products and
customers), which is not possible with traditional overhead costing. Nevertheless,
this is solely an assignment of all occurring costs that does not take the true activity
quantities consumed into account. You thus cannot answer questions dealing with
the productivity of overhead processes, or with the costs of idle resource capacity.
Consequences of the Pull
Approach: Variance Analysis
The technique of the pull approach requires more input than that of the value
accounting since an analytical plan and a measurement of the actual quantities are
necessary. The quality of ABC depends on the quality and measurability of the
drivers. The knowledge that the utilization of a procurement process depends on
the complexity of the materials to be procured is useless if this complexity is not
measurable. The results of a process assignment are questionable if they are based
on rough percentages due to a lack of ascertainable measures. Manual measures
are normally unfeasible for prolonged ABC use. Many of the necessary measures
are already available in the SAP R/3 system in the statistical data. The use of this
data in an integrated ABC is facilitated by existing mechanisms, like the template.
2-19
Integrated ABC in R/3 2
An advantage is that now an operating rate can be calculated with the known
actual quantity and an underlying planning quantity. This makes it possible to
compare the plan with actual and target with actual of costs and quantities. Vari-
ances can be analyzed and differentiated according to various categories. Ques-
tions regarding the productivity of the overhead processes can thus be addressed.
Fair Cost AssignmentThe pull approach makes it possible to examine a resource quantity or process quan-
tity flow throughout the entire value added chain of an organization. This remains
the case as long as the user selects the appropriate resource and cost drivers and
makes appropriate assignments of overhead costs to their originating receiver ob-
jects (such as products and customers). The advantage of this pull approach is the
use of only those quantities actually consumed by the receiver objects. Costs due to
unused capacity remain in the cost center when resource prices are calculated based
on capacity. The pull approach guarantees fair cost assignments to products and
customers since no penalties are made due to unused capacity costs.
Activity-Based BudgetingThrough the inverse method described, the pull approach allows you to transfer
plan sales quantities automatically to the existing process and resource quantities
of the cost center resources.The R/3 system utilizes the resource and process driver
relationship established by the user. For the backflush calculation of the quantity
flow it is important to distinguish between fixed and variable quantities. Only
variable quantities are adjusted to the changed sales quantities in the integrated
planning. The integrated planning supports Activity-Based Budgeting, and helps
identify unused or under capacity of the cost center resources. These overhead
resources can then be redistributed if necessary.
Simultaneous Use of Push
and Pull
The user of the integrated ABC in R/3 is not forced to use only one of the ap-
proaches. Both approaches can be implemented simultaneously (see Figure 2-17).
Depending on the situation in the enterprise, it may still be necessary to apply the
more informative pull approach with specific resources and processes.
Fig. 2-17: Simultaneous Use of Push and Pull Approaches in the Integrated ABC

More Related Content

What's hot

Co pa power point
Co pa power pointCo pa power point
Co pa power pointkrnprjp
 
Co product costing detailed trng
Co product costing detailed trngCo product costing detailed trng
Co product costing detailed trngVenkat Reddy
 
Accounting entries from production to finished stock
Accounting entries from production to finished stockAccounting entries from production to finished stock
Accounting entries from production to finished stockRavindra Jain
 
SAP CO-PA (Controlling-Profitability Analysis)
SAP CO-PA (Controlling-Profitability Analysis)SAP CO-PA (Controlling-Profitability Analysis)
SAP CO-PA (Controlling-Profitability Analysis)Stridely Solutions
 
A guide to functional areas and cost of sales P&L reporting in the SAP® Gener...
A guide to functional areas and cost of sales P&L reporting in the SAP® Gener...A guide to functional areas and cost of sales P&L reporting in the SAP® Gener...
A guide to functional areas and cost of sales P&L reporting in the SAP® Gener...John Jordan
 
SAP CO Configuration Guide - Exclusive Document
SAP CO Configuration Guide - Exclusive DocumentSAP CO Configuration Guide - Exclusive Document
SAP CO Configuration Guide - Exclusive Documentsapdocs. info
 
Etm equipment and_tools management
Etm equipment and_tools managementEtm equipment and_tools management
Etm equipment and_tools managementPiyush Bose
 
Vertex Configuration Guide. A to Z Steps with Description.
Vertex Configuration Guide. A to Z Steps with Description.Vertex Configuration Guide. A to Z Steps with Description.
Vertex Configuration Guide. A to Z Steps with Description.Keyur Mistry
 
55811936 product-costing-cost-estimation-in-sap
55811936 product-costing-cost-estimation-in-sap55811936 product-costing-cost-estimation-in-sap
55811936 product-costing-cost-estimation-in-sapPepa Pencheva
 
SAP CO overview
SAP CO overview SAP CO overview
SAP CO overview Peter Ezzat
 
SAP Controlling overview
SAP Controlling overviewSAP Controlling overview
SAP Controlling overviewMohamed Hani
 
SAP Accounting powered by SAP HANA – Moving controlling and finance closer to...
SAP Accounting powered by SAP HANA – Moving controlling and finance closer to...SAP Accounting powered by SAP HANA – Moving controlling and finance closer to...
SAP Accounting powered by SAP HANA – Moving controlling and finance closer to...John Jordan
 
GST_Configuration Document_GANESH_SAPSD
GST_Configuration Document_GANESH_SAPSD GST_Configuration Document_GANESH_SAPSD
GST_Configuration Document_GANESH_SAPSD Ganesh Tarlana
 
New GL parallel ledgers in asset accounting
New GL parallel ledgers in asset accounting New GL parallel ledgers in asset accounting
New GL parallel ledgers in asset accounting Hari Krishna
 
SAP-CO-PC - Product Cost Cycle
SAP-CO-PC - Product Cost CycleSAP-CO-PC - Product Cost Cycle
SAP-CO-PC - Product Cost CycleIntelligroup, Inc.
 

What's hot (20)

Co pa power point
Co pa power pointCo pa power point
Co pa power point
 
Org structure SAP
Org structure SAPOrg structure SAP
Org structure SAP
 
Co product costing detailed trng
Co product costing detailed trngCo product costing detailed trng
Co product costing detailed trng
 
Accounting entries from production to finished stock
Accounting entries from production to finished stockAccounting entries from production to finished stock
Accounting entries from production to finished stock
 
SAP CO-PA (Controlling-Profitability Analysis)
SAP CO-PA (Controlling-Profitability Analysis)SAP CO-PA (Controlling-Profitability Analysis)
SAP CO-PA (Controlling-Profitability Analysis)
 
A guide to functional areas and cost of sales P&L reporting in the SAP® Gener...
A guide to functional areas and cost of sales P&L reporting in the SAP® Gener...A guide to functional areas and cost of sales P&L reporting in the SAP® Gener...
A guide to functional areas and cost of sales P&L reporting in the SAP® Gener...
 
Sap co pa planning
Sap co pa planningSap co pa planning
Sap co pa planning
 
SAP CO Configuration Guide - Exclusive Document
SAP CO Configuration Guide - Exclusive DocumentSAP CO Configuration Guide - Exclusive Document
SAP CO Configuration Guide - Exclusive Document
 
Etm equipment and_tools management
Etm equipment and_tools managementEtm equipment and_tools management
Etm equipment and_tools management
 
Vertex Configuration Guide. A to Z Steps with Description.
Vertex Configuration Guide. A to Z Steps with Description.Vertex Configuration Guide. A to Z Steps with Description.
Vertex Configuration Guide. A to Z Steps with Description.
 
CO PA PowerPoint
CO PA PowerPointCO PA PowerPoint
CO PA PowerPoint
 
55811936 product-costing-cost-estimation-in-sap
55811936 product-costing-cost-estimation-in-sap55811936 product-costing-cost-estimation-in-sap
55811936 product-costing-cost-estimation-in-sap
 
SAP CO overview
SAP CO overview SAP CO overview
SAP CO overview
 
SAP Controlling overview
SAP Controlling overviewSAP Controlling overview
SAP Controlling overview
 
Cutover activities
Cutover activitiesCutover activities
Cutover activities
 
SAP Accounting powered by SAP HANA – Moving controlling and finance closer to...
SAP Accounting powered by SAP HANA – Moving controlling and finance closer to...SAP Accounting powered by SAP HANA – Moving controlling and finance closer to...
SAP Accounting powered by SAP HANA – Moving controlling and finance closer to...
 
GST_Configuration Document_GANESH_SAPSD
GST_Configuration Document_GANESH_SAPSD GST_Configuration Document_GANESH_SAPSD
GST_Configuration Document_GANESH_SAPSD
 
SAP MM Essential Master Data
SAP MM Essential Master DataSAP MM Essential Master Data
SAP MM Essential Master Data
 
New GL parallel ledgers in asset accounting
New GL parallel ledgers in asset accounting New GL parallel ledgers in asset accounting
New GL parallel ledgers in asset accounting
 
SAP-CO-PC - Product Cost Cycle
SAP-CO-PC - Product Cost CycleSAP-CO-PC - Product Cost Cycle
SAP-CO-PC - Product Cost Cycle
 

Viewers also liked

Activity based management fall 2016
Activity based management fall 2016 Activity based management fall 2016
Activity based management fall 2016 Stephen Brian Salter
 
Activity based costing
Activity based costingActivity based costing
Activity based costingRahul Kumar
 
Activity based costing & activity based management
Activity  based costing & activity based managementActivity  based costing & activity based management
Activity based costing & activity based managementPiyush Gaur
 
Activity Based Costing
Activity Based CostingActivity Based Costing
Activity Based CostingVikas Gupta
 
Activity based costing
Activity based costingActivity based costing
Activity based costingsachdevkkapil
 

Viewers also liked (8)

In The Library (Bus)
In The Library (Bus)In The Library (Bus)
In The Library (Bus)
 
Activity based management fall 2016
Activity based management fall 2016 Activity based management fall 2016
Activity based management fall 2016
 
Activity based costing
Activity based costingActivity based costing
Activity based costing
 
Activity based costing & activity based management
Activity  based costing & activity based managementActivity  based costing & activity based management
Activity based costing & activity based management
 
Activity based costing
Activity based costingActivity based costing
Activity based costing
 
Activity Based Costing
Activity Based CostingActivity Based Costing
Activity Based Costing
 
Activity based costing
Activity based costingActivity based costing
Activity based costing
 
Activity-Based Costing System
Activity-Based Costing SystemActivity-Based Costing System
Activity-Based Costing System
 

Similar to Integrated ABC in R/3 - Concept, Implementation and Master Data

Co interview questions and asnwers.
Co interview questions and asnwers.Co interview questions and asnwers.
Co interview questions and asnwers.Rajeev Kumar
 
Caclubindia.com sap cofi for beginners
Caclubindia.com sap cofi for beginnersCaclubindia.com sap cofi for beginners
Caclubindia.com sap cofi for beginnersabc
 
SAP Finance & Controlling_ Cost_center_accounting.ppt
SAP Finance & Controlling_ Cost_center_accounting.pptSAP Finance & Controlling_ Cost_center_accounting.ppt
SAP Finance & Controlling_ Cost_center_accounting.pptSrinivas Gudimella
 
Controlling management
Controlling managementControlling management
Controlling managementbadityaa
 
Important Interview questions in SAP CO
Important Interview questions in SAP COImportant Interview questions in SAP CO
Important Interview questions in SAP COMuhammad Umer Farooq
 
Important Interview question in SAP CO
Important Interview question in SAP COImportant Interview question in SAP CO
Important Interview question in SAP COMuhammad Umer Farooq
 
Chapter 11 : Activity Based Costing and Accounting Information
Chapter 11 : Activity Based Costing and Accounting InformationChapter 11 : Activity Based Costing and Accounting Information
Chapter 11 : Activity Based Costing and Accounting InformationPeleZain
 
how to create Cost center creation.ppt
how to create   Cost center creation.ppthow to create   Cost center creation.ppt
how to create Cost center creation.pptChiragJuneja15
 
Q.2 steps required to implement ABC within the companyABC Costing .pdf
Q.2 steps required to implement ABC within the companyABC Costing .pdfQ.2 steps required to implement ABC within the companyABC Costing .pdf
Q.2 steps required to implement ABC within the companyABC Costing .pdfanjalipub
 
Lecture 3Introduction to SAP Controlling (CO)FIN419 .docx
Lecture 3Introduction to SAP Controlling (CO)FIN419 .docxLecture 3Introduction to SAP Controlling (CO)FIN419 .docx
Lecture 3Introduction to SAP Controlling (CO)FIN419 .docxsmile790243
 
What is copa master data
What is copa master dataWhat is copa master data
What is copa master dataRajeev Kumar
 
Activity Based Costing System
Activity Based Costing SystemActivity Based Costing System
Activity Based Costing SystemAmar Keshari
 
Sap controlling doc=venu+venu
Sap controlling doc=venu+venuSap controlling doc=venu+venu
Sap controlling doc=venu+venuuvenu
 
Mass to Lean to Six Sigma Path
Mass to Lean to Six Sigma PathMass to Lean to Six Sigma Path
Mass to Lean to Six Sigma PathJohnHamman
 

Similar to Integrated ABC in R/3 - Concept, Implementation and Master Data (20)

Co interview questions and asnwers.
Co interview questions and asnwers.Co interview questions and asnwers.
Co interview questions and asnwers.
 
Caclubindia.com sap cofi for beginners
Caclubindia.com sap cofi for beginnersCaclubindia.com sap cofi for beginners
Caclubindia.com sap cofi for beginners
 
SAP Finance & Controlling_ Cost_center_accounting.ppt
SAP Finance & Controlling_ Cost_center_accounting.pptSAP Finance & Controlling_ Cost_center_accounting.ppt
SAP Finance & Controlling_ Cost_center_accounting.ppt
 
Controlling management
Controlling managementControlling management
Controlling management
 
Important Interview questions in SAP CO
Important Interview questions in SAP COImportant Interview questions in SAP CO
Important Interview questions in SAP CO
 
Important Interview question in SAP CO
Important Interview question in SAP COImportant Interview question in SAP CO
Important Interview question in SAP CO
 
Chapter 11 : Activity Based Costing and Accounting Information
Chapter 11 : Activity Based Costing and Accounting InformationChapter 11 : Activity Based Costing and Accounting Information
Chapter 11 : Activity Based Costing and Accounting Information
 
how to create Cost center creation.ppt
how to create   Cost center creation.ppthow to create   Cost center creation.ppt
how to create Cost center creation.ppt
 
Q.2 steps required to implement ABC within the companyABC Costing .pdf
Q.2 steps required to implement ABC within the companyABC Costing .pdfQ.2 steps required to implement ABC within the companyABC Costing .pdf
Q.2 steps required to implement ABC within the companyABC Costing .pdf
 
Activity based costing
Activity based costingActivity based costing
Activity based costing
 
Copa 2
Copa 2Copa 2
Copa 2
 
Lecture 3Introduction to SAP Controlling (CO)FIN419 .docx
Lecture 3Introduction to SAP Controlling (CO)FIN419 .docxLecture 3Introduction to SAP Controlling (CO)FIN419 .docx
Lecture 3Introduction to SAP Controlling (CO)FIN419 .docx
 
Activity Based Costing
Activity Based CostingActivity Based Costing
Activity Based Costing
 
Isu crm facts 01.doc
Isu crm facts 01.docIsu crm facts 01.doc
Isu crm facts 01.doc
 
What is copa master data
What is copa master dataWhat is copa master data
What is copa master data
 
Activity based costing
Activity based costingActivity based costing
Activity based costing
 
Activity Based Costing System
Activity Based Costing SystemActivity Based Costing System
Activity Based Costing System
 
Sap controlling doc=venu+venu
Sap controlling doc=venu+venuSap controlling doc=venu+venu
Sap controlling doc=venu+venu
 
logistic costing
logistic costinglogistic costing
logistic costing
 
Mass to Lean to Six Sigma Path
Mass to Lean to Six Sigma PathMass to Lean to Six Sigma Path
Mass to Lean to Six Sigma Path
 

Recently uploaded

ASML's Taxonomy Adventure by Daniel Canter
ASML's Taxonomy Adventure by Daniel CanterASML's Taxonomy Adventure by Daniel Canter
ASML's Taxonomy Adventure by Daniel Cantervoginip
 
毕业文凭制作#回国入职#diploma#degree澳洲中央昆士兰大学毕业证成绩单pdf电子版制作修改#毕业文凭制作#回国入职#diploma#degree
毕业文凭制作#回国入职#diploma#degree澳洲中央昆士兰大学毕业证成绩单pdf电子版制作修改#毕业文凭制作#回国入职#diploma#degree毕业文凭制作#回国入职#diploma#degree澳洲中央昆士兰大学毕业证成绩单pdf电子版制作修改#毕业文凭制作#回国入职#diploma#degree
毕业文凭制作#回国入职#diploma#degree澳洲中央昆士兰大学毕业证成绩单pdf电子版制作修改#毕业文凭制作#回国入职#diploma#degreeyuu sss
 
RA-11058_IRR-COMPRESS Do 198 series of 1998
RA-11058_IRR-COMPRESS Do 198 series of 1998RA-11058_IRR-COMPRESS Do 198 series of 1998
RA-11058_IRR-COMPRESS Do 198 series of 1998YohFuh
 
vip Sarai Rohilla Call Girls 9999965857 Call or WhatsApp Now Book
vip Sarai Rohilla Call Girls 9999965857 Call or WhatsApp Now Bookvip Sarai Rohilla Call Girls 9999965857 Call or WhatsApp Now Book
vip Sarai Rohilla Call Girls 9999965857 Call or WhatsApp Now Bookmanojkuma9823
 
Indian Call Girls in Abu Dhabi O5286O24O8 Call Girls in Abu Dhabi By Independ...
Indian Call Girls in Abu Dhabi O5286O24O8 Call Girls in Abu Dhabi By Independ...Indian Call Girls in Abu Dhabi O5286O24O8 Call Girls in Abu Dhabi By Independ...
Indian Call Girls in Abu Dhabi O5286O24O8 Call Girls in Abu Dhabi By Independ...dajasot375
 
专业一比一美国俄亥俄大学毕业证成绩单pdf电子版制作修改
专业一比一美国俄亥俄大学毕业证成绩单pdf电子版制作修改专业一比一美国俄亥俄大学毕业证成绩单pdf电子版制作修改
专业一比一美国俄亥俄大学毕业证成绩单pdf电子版制作修改yuu sss
 
Call Girls in Defence Colony Delhi 💯Call Us 🔝8264348440🔝
Call Girls in Defence Colony Delhi 💯Call Us 🔝8264348440🔝Call Girls in Defence Colony Delhi 💯Call Us 🔝8264348440🔝
Call Girls in Defence Colony Delhi 💯Call Us 🔝8264348440🔝soniya singh
 
9654467111 Call Girls In Munirka Hotel And Home Service
9654467111 Call Girls In Munirka Hotel And Home Service9654467111 Call Girls In Munirka Hotel And Home Service
9654467111 Call Girls In Munirka Hotel And Home ServiceSapana Sha
 
Beautiful Sapna Vip Call Girls Hauz Khas 9711199012 Call /Whatsapps
Beautiful Sapna Vip  Call Girls Hauz Khas 9711199012 Call /WhatsappsBeautiful Sapna Vip  Call Girls Hauz Khas 9711199012 Call /Whatsapps
Beautiful Sapna Vip Call Girls Hauz Khas 9711199012 Call /Whatsappssapnasaifi408
 
How we prevented account sharing with MFA
How we prevented account sharing with MFAHow we prevented account sharing with MFA
How we prevented account sharing with MFAAndrei Kaleshka
 
Predictive Analysis - Using Insight-informed Data to Determine Factors Drivin...
Predictive Analysis - Using Insight-informed Data to Determine Factors Drivin...Predictive Analysis - Using Insight-informed Data to Determine Factors Drivin...
Predictive Analysis - Using Insight-informed Data to Determine Factors Drivin...ThinkInnovation
 
办理(Vancouver毕业证书)加拿大温哥华岛大学毕业证成绩单原版一比一
办理(Vancouver毕业证书)加拿大温哥华岛大学毕业证成绩单原版一比一办理(Vancouver毕业证书)加拿大温哥华岛大学毕业证成绩单原版一比一
办理(Vancouver毕业证书)加拿大温哥华岛大学毕业证成绩单原版一比一F La
 
dokumen.tips_chapter-4-transient-heat-conduction-mehmet-kanoglu.ppt
dokumen.tips_chapter-4-transient-heat-conduction-mehmet-kanoglu.pptdokumen.tips_chapter-4-transient-heat-conduction-mehmet-kanoglu.ppt
dokumen.tips_chapter-4-transient-heat-conduction-mehmet-kanoglu.pptSonatrach
 
Effects of Smartphone Addiction on the Academic Performances of Grades 9 to 1...
Effects of Smartphone Addiction on the Academic Performances of Grades 9 to 1...Effects of Smartphone Addiction on the Academic Performances of Grades 9 to 1...
Effects of Smartphone Addiction on the Academic Performances of Grades 9 to 1...limedy534
 
Call Girls In Dwarka 9654467111 Escorts Service
Call Girls In Dwarka 9654467111 Escorts ServiceCall Girls In Dwarka 9654467111 Escorts Service
Call Girls In Dwarka 9654467111 Escorts ServiceSapana Sha
 
EMERCE - 2024 - AMSTERDAM - CROSS-PLATFORM TRACKING WITH GOOGLE ANALYTICS.pptx
EMERCE - 2024 - AMSTERDAM - CROSS-PLATFORM  TRACKING WITH GOOGLE ANALYTICS.pptxEMERCE - 2024 - AMSTERDAM - CROSS-PLATFORM  TRACKING WITH GOOGLE ANALYTICS.pptx
EMERCE - 2024 - AMSTERDAM - CROSS-PLATFORM TRACKING WITH GOOGLE ANALYTICS.pptxthyngster
 
VIP Call Girls Service Miyapur Hyderabad Call +91-8250192130
VIP Call Girls Service Miyapur Hyderabad Call +91-8250192130VIP Call Girls Service Miyapur Hyderabad Call +91-8250192130
VIP Call Girls Service Miyapur Hyderabad Call +91-8250192130Suhani Kapoor
 
꧁❤ Greater Noida Call Girls Delhi ❤꧂ 9711199171 ☎️ Hard And Sexy Vip Call
꧁❤ Greater Noida Call Girls Delhi ❤꧂ 9711199171 ☎️ Hard And Sexy Vip Call꧁❤ Greater Noida Call Girls Delhi ❤꧂ 9711199171 ☎️ Hard And Sexy Vip Call
꧁❤ Greater Noida Call Girls Delhi ❤꧂ 9711199171 ☎️ Hard And Sexy Vip Callshivangimorya083
 
Consent & Privacy Signals on Google *Pixels* - MeasureCamp Amsterdam 2024
Consent & Privacy Signals on Google *Pixels* - MeasureCamp Amsterdam 2024Consent & Privacy Signals on Google *Pixels* - MeasureCamp Amsterdam 2024
Consent & Privacy Signals on Google *Pixels* - MeasureCamp Amsterdam 2024thyngster
 

Recently uploaded (20)

ASML's Taxonomy Adventure by Daniel Canter
ASML's Taxonomy Adventure by Daniel CanterASML's Taxonomy Adventure by Daniel Canter
ASML's Taxonomy Adventure by Daniel Canter
 
毕业文凭制作#回国入职#diploma#degree澳洲中央昆士兰大学毕业证成绩单pdf电子版制作修改#毕业文凭制作#回国入职#diploma#degree
毕业文凭制作#回国入职#diploma#degree澳洲中央昆士兰大学毕业证成绩单pdf电子版制作修改#毕业文凭制作#回国入职#diploma#degree毕业文凭制作#回国入职#diploma#degree澳洲中央昆士兰大学毕业证成绩单pdf电子版制作修改#毕业文凭制作#回国入职#diploma#degree
毕业文凭制作#回国入职#diploma#degree澳洲中央昆士兰大学毕业证成绩单pdf电子版制作修改#毕业文凭制作#回国入职#diploma#degree
 
RA-11058_IRR-COMPRESS Do 198 series of 1998
RA-11058_IRR-COMPRESS Do 198 series of 1998RA-11058_IRR-COMPRESS Do 198 series of 1998
RA-11058_IRR-COMPRESS Do 198 series of 1998
 
vip Sarai Rohilla Call Girls 9999965857 Call or WhatsApp Now Book
vip Sarai Rohilla Call Girls 9999965857 Call or WhatsApp Now Bookvip Sarai Rohilla Call Girls 9999965857 Call or WhatsApp Now Book
vip Sarai Rohilla Call Girls 9999965857 Call or WhatsApp Now Book
 
Indian Call Girls in Abu Dhabi O5286O24O8 Call Girls in Abu Dhabi By Independ...
Indian Call Girls in Abu Dhabi O5286O24O8 Call Girls in Abu Dhabi By Independ...Indian Call Girls in Abu Dhabi O5286O24O8 Call Girls in Abu Dhabi By Independ...
Indian Call Girls in Abu Dhabi O5286O24O8 Call Girls in Abu Dhabi By Independ...
 
专业一比一美国俄亥俄大学毕业证成绩单pdf电子版制作修改
专业一比一美国俄亥俄大学毕业证成绩单pdf电子版制作修改专业一比一美国俄亥俄大学毕业证成绩单pdf电子版制作修改
专业一比一美国俄亥俄大学毕业证成绩单pdf电子版制作修改
 
Call Girls in Defence Colony Delhi 💯Call Us 🔝8264348440🔝
Call Girls in Defence Colony Delhi 💯Call Us 🔝8264348440🔝Call Girls in Defence Colony Delhi 💯Call Us 🔝8264348440🔝
Call Girls in Defence Colony Delhi 💯Call Us 🔝8264348440🔝
 
9654467111 Call Girls In Munirka Hotel And Home Service
9654467111 Call Girls In Munirka Hotel And Home Service9654467111 Call Girls In Munirka Hotel And Home Service
9654467111 Call Girls In Munirka Hotel And Home Service
 
Beautiful Sapna Vip Call Girls Hauz Khas 9711199012 Call /Whatsapps
Beautiful Sapna Vip  Call Girls Hauz Khas 9711199012 Call /WhatsappsBeautiful Sapna Vip  Call Girls Hauz Khas 9711199012 Call /Whatsapps
Beautiful Sapna Vip Call Girls Hauz Khas 9711199012 Call /Whatsapps
 
E-Commerce Order PredictionShraddha Kamble.pptx
E-Commerce Order PredictionShraddha Kamble.pptxE-Commerce Order PredictionShraddha Kamble.pptx
E-Commerce Order PredictionShraddha Kamble.pptx
 
How we prevented account sharing with MFA
How we prevented account sharing with MFAHow we prevented account sharing with MFA
How we prevented account sharing with MFA
 
Predictive Analysis - Using Insight-informed Data to Determine Factors Drivin...
Predictive Analysis - Using Insight-informed Data to Determine Factors Drivin...Predictive Analysis - Using Insight-informed Data to Determine Factors Drivin...
Predictive Analysis - Using Insight-informed Data to Determine Factors Drivin...
 
办理(Vancouver毕业证书)加拿大温哥华岛大学毕业证成绩单原版一比一
办理(Vancouver毕业证书)加拿大温哥华岛大学毕业证成绩单原版一比一办理(Vancouver毕业证书)加拿大温哥华岛大学毕业证成绩单原版一比一
办理(Vancouver毕业证书)加拿大温哥华岛大学毕业证成绩单原版一比一
 
dokumen.tips_chapter-4-transient-heat-conduction-mehmet-kanoglu.ppt
dokumen.tips_chapter-4-transient-heat-conduction-mehmet-kanoglu.pptdokumen.tips_chapter-4-transient-heat-conduction-mehmet-kanoglu.ppt
dokumen.tips_chapter-4-transient-heat-conduction-mehmet-kanoglu.ppt
 
Effects of Smartphone Addiction on the Academic Performances of Grades 9 to 1...
Effects of Smartphone Addiction on the Academic Performances of Grades 9 to 1...Effects of Smartphone Addiction on the Academic Performances of Grades 9 to 1...
Effects of Smartphone Addiction on the Academic Performances of Grades 9 to 1...
 
Call Girls In Dwarka 9654467111 Escorts Service
Call Girls In Dwarka 9654467111 Escorts ServiceCall Girls In Dwarka 9654467111 Escorts Service
Call Girls In Dwarka 9654467111 Escorts Service
 
EMERCE - 2024 - AMSTERDAM - CROSS-PLATFORM TRACKING WITH GOOGLE ANALYTICS.pptx
EMERCE - 2024 - AMSTERDAM - CROSS-PLATFORM  TRACKING WITH GOOGLE ANALYTICS.pptxEMERCE - 2024 - AMSTERDAM - CROSS-PLATFORM  TRACKING WITH GOOGLE ANALYTICS.pptx
EMERCE - 2024 - AMSTERDAM - CROSS-PLATFORM TRACKING WITH GOOGLE ANALYTICS.pptx
 
VIP Call Girls Service Miyapur Hyderabad Call +91-8250192130
VIP Call Girls Service Miyapur Hyderabad Call +91-8250192130VIP Call Girls Service Miyapur Hyderabad Call +91-8250192130
VIP Call Girls Service Miyapur Hyderabad Call +91-8250192130
 
꧁❤ Greater Noida Call Girls Delhi ❤꧂ 9711199171 ☎️ Hard And Sexy Vip Call
꧁❤ Greater Noida Call Girls Delhi ❤꧂ 9711199171 ☎️ Hard And Sexy Vip Call꧁❤ Greater Noida Call Girls Delhi ❤꧂ 9711199171 ☎️ Hard And Sexy Vip Call
꧁❤ Greater Noida Call Girls Delhi ❤꧂ 9711199171 ☎️ Hard And Sexy Vip Call
 
Consent & Privacy Signals on Google *Pixels* - MeasureCamp Amsterdam 2024
Consent & Privacy Signals on Google *Pixels* - MeasureCamp Amsterdam 2024Consent & Privacy Signals on Google *Pixels* - MeasureCamp Amsterdam 2024
Consent & Privacy Signals on Google *Pixels* - MeasureCamp Amsterdam 2024
 

Integrated ABC in R/3 - Concept, Implementation and Master Data

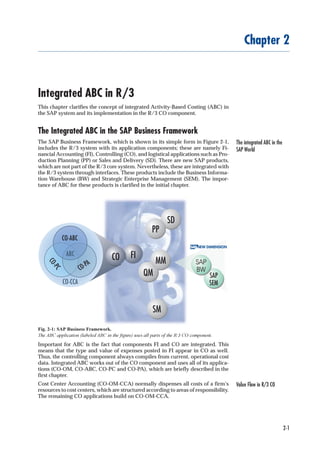
  • 1. 2-1 Integrated ABC in R/3 2Chapter 2 Integrated ABC in R/3 This chapter clarifies the concept of integrated Activity-Based Costing (ABC) in the SAP system and its implementation in the R/3 CO component. The Integrated ABC in the SAP Business Framework The integrated ABC in the SAP World The SAP Business Framework, which is shown in its simple form in Figure 2-1, includes the R/3 system with its application components; these are namely Fi- nancial Accounting (FI), Controlling (CO), and logistical applications such as Pro- duction Planning (PP) or Sales and Delivery (SD). There are new SAP products, which are not part of the R/3 core system. Nevertheless, these are integrated with the R/3 system through interfaces. These products include the Business Informa- tion Warehouse (BW) and Strategic Enterprise Management (SEM). The impor- tance of ABC for these products is clarified in the initial chapter. Fig. 2-1: SAP Business Framework. The ABC application (labeled ABC in the figure) uses all parts of the R/3 CO component. Important for ABC is the fact that components FI and CO are integrated. This means that the type and value of expenses posted in FI appear in CO as well. Thus, the controlling component always compiles from current, operational cost data. Integrated ABC works out of the CO component and uses all of its applica- tions (CO-OM, CO-ABC, CO-PC and CO-PA), which are briefly described in the first chapter. Value Flow in R/3 COCost Center Accounting (CO-OM-CCA) normally dispenses all costs of a firm’s resources to cost centers, which are structured according to areas of responsibility. The remaining CO applications build on CO-OM-CCA.
  • 2. 2-2 2 Integrated ABC in R/3 Fig. 2-2: Integrated ABC with R/3 CO CO-ABC offers the business process as a complete controlling object that can be allocated to cost objects as well as to market segments. CO-ABC provides the business processes that can also be applied across cost centers. This means that a business process can utilize several resources from different cost centerssimultaneously.Businessprocessescanalsobedebitedwithcostsdirectlyfrom financial accounting. However, this approach can make the accountability for such costs unclear within the organization. This might be a sensible approach for some costs, like operating materials or supplies (lubricants for a maintenance process), that abusinessprocessconsumes.Productrelatedbusinessprocesscostscanbeaccurately assigned to products or jobs, like orders or projects. This occurs through the Product Costing application (CO-PC). Thereby, process costs flow like material or direct pro- duction costs into the manufacturing costs of the product. This makes it possible to identify the process costs within the manufacturing costs, and therefore to include process costs in stock valuations. Business processes not related to production are assigned to the relevant market segments through the Profitability Analysis (CO-PA) application, where you can find the corresponding revenue figures. Process costs that are a part of production costs are automatically released to CO-PA, as direct costs are. Master Data and Structures Following is an overview of the master data and structures, which are important for ABC, as well as their essential characteristics . Cost Centers and Activity Types (CO-OM-CCA) Resources Different resources from a cost center (which can be similar to a department) are defined through various cost center activity types. The resources provided by a cost center are utilized through the consumption of activity types from one cost center by other cost centers, orders or processes. The quantity utilized is priced retroactively from rates based on existing costing policies. This allows the system to accurately assign costs to the responsible processes depending on the resources actually consumed.
  • 3. 2-3 Integrated ABC in R/3 2 Below are examples of activity types for cost centers from various branches: u Production: drilling hours, wages hours, and so on. u Service: plant maintenance hours, inspections hours, and so on u Administration: clerical hours, sales hours, and so on It is important that the activity quantity of an activity type be linked to a cost center. An view across cost centers is not possible with activity types. Business Processes (CO-ABC) Business processes represent cross-functional procedures within an enterprise (for example, material procurement). Usually multiple cost centers participate in the execution of a business process. Business processes utilize various resources, which are made available by cost centers (for example, clerical hours in the purchasing and quality management cost centers, as well as wage hours of stock workers from the stock/inventory cost center). Organizational Assignment of Processes As with a cost center, a business process is defined within a controlling area for a particular company code (which is assigned to the aforementioned controlling area). This ensures that the process assignments reconcile with financial accounting. Process Characterization through Attributes You can classify your business processes through particular process attributes, which are specified in master data. For example, order processing can be partitioned into price quoting, order validation and shipping. These are labeled with different grades of value added as appropriate. You may create as many attributes as necessary. The following attributes are delivered with the standard package. The values that these attributes can assume are set in customizing. u External Value-Added: External value-added specifies how much a process raises the product value externally (for example, for a customer). A possible classification is low, mid- dle, and high value-added. An example of an external value added process is the delivery of goods to the customers that one could give a high classification to in a Just-In-Time industry. u Internal Value-Added: Internal value-added processes bring marginal satisfaction to the customer, but are crucial for internal operations. The logistics required to prepare mate- rials for production would be one instance. u Business Process Type: The business process type specifies to which area of the enterprise the process is assigned; for example, sales, development or production. u Cost Behavior: The cost behavior indicates from what the process costs are dependent (for example, the number of lots or batches, or the volume of production). u Attribute 1 and Attribute 2: The firm can set these attributes completely separately. Business process attributes can provide important information on how to opti- mize processes. For example, one can make a broad attempt to eliminate process- es that add only marginal value.
  • 4. 2-4 2 Integrated ABC in R/3 Products and Jobs (CO-PC, CO-OM) Material Master Record Products are normally defined in the material master record of the R/3 system. This master record contains numerous control parameters for logistics. This is how parameters are defined in the master record; these parameters determine the meth- od used to calculate the overhead cost assignment for the respective product . The master record also contains the calculation results in the form of standard costs for the product. These standard costs are used to determine stock levels, among other things. Cost Objects The R/3 system represents tasks as cost objects (for example, production orders, customer orders, internal orders, and others). You can couple a cost object with a product (for example, production order for a specific product), or a certain job description, which is independent of a product (for example, a trade fair order). Plan costs are recorded on cost objects, and periodically compared with incurred actual or target costs. This makes job costing possible at the cost object level. Market Segments, Characteristics and Value Fields (CO-PA) Multi-Dimensional Market Segments To analyze corporate performance, it is not enough to implement job costing at the product level. Of more interest are multi-dimensional market segments that distin- guish themselves through a myriad of characteristics. You can analyze the profit- ability of a product in a specific region, customer group and distribution channel simultaneously. This multi-dimensionality is especially meaningful for the service industries, which often see their products as much more than one-dimensional. Multi-Level Contribution Margin Accounting You can log revenues, sales deductions, discounts and returns, and costs of any kind as well as quantity key figures for each market segment in the respective value field. You can build up information for multi-level contribution margin ac- counting through the proper structuring of profitability reports according to val- ue field. Statistical Key Figures (CO) Resources and Process Drivers Statistical key figures are used in CO to generally characterize cost centers or pro- cesses. They also enable the entry of driver quantity data. They can serve as re- source or process drivers. The resource driver describes the amount of resources utilized, and the process driver gives the number of process executions (for exam- ple, number of orders, palette movements, and more). Information Structures in the Logistic Information System (LIS) Automatic Recording of Driver Quantities Alarge number of processes would make the periodic updating of driver quantity calculations very labor intensive. The Logistic Information System (LIS) makes it possible to record numerous drivers automatically. The update of driver quanti- ties occurs during the execution of R/3 transactions in the LIS information struc- ture. For instance, this allows the R/3 system to calculate the number of config- urable order items when a customer order is created, and to save this in an appro- priate information structure at the level of ”Customer, Product, Distribution Chan- nel” as a LIS key figure. This information can later be used by CO-ABC to assign process ”Product Configuration” to the corresponding market segments. This func- tionality is especially important for an efficient ABC solution.
  • 5. 2-5 Integrated ABC in R/3 2 Methods of Integrated ABC In general, there are two techniques for assigning cost center resources to business processes (via resource drivers), and assigning business processes to the corre- sponding receiver objects (via process drivers). We refer to these methods as push and pull respectively, and describe them below. Deciding for one of the two ap- proaches has far reaching consequences regarding the capacity of ABC as a man- agement tool in your organization. In principle, it is possible to apply both meth- ods in parallel in one ABC model. Management will use the pull approach, which offers more capacity, or the other based on its needs. The Push Approach Simple cost distributionThe push approach is one of ”simple cost distribution”. Costs from the cost center resources are distributed over the business processes based on the resource driver. The resulting process costs are then assigned to the respective products, custom- ers, or other objects, in a second step (see Figure 2-3). The process driver in the push approach is used solely as a tracing factor to distribute costs to the receiver objects, such as cost objects, market segments, and others. To implement the push approach, the R/3 system offers assessment and distribution, which are described below. The assessment posts costs under a secondary cost element, and is thus suited to clarify what costs are used for, when assigned through the assessment. On the other hand, the originating primary cost elements (for example, wages, salary, and raw material) are preserved by the receiver during the distribution. It is useful when the origins of costs are more interesting than their causes. As of release 4.5, it is also possible to layer costs under several cost elements when using the assessment technology. This enables the user to regroup primary cost elements into a few meaningful secondary cost elements. Fig. 2-3: The Push Approach Costs originate from cost centers and are distributed to business processes through resource drivers, and later to products, customers or other objects through process drivers.
  • 6. 2-6 2 Integrated ABC in R/3 Resource Consumption Tracing Factors as Resource Drivers Both methods can be used to assign cost center resources to processes. The tracing factor represents the resource driver in the assessment and distribution cycles in both cases (see Figure 2-4). For example, the resource driver can appear as a statistical key figure of a business process representing a measurement for the resource consump- tion. This statistical key figure can be taken, when necessary, from the Logistics Infor- mation System (LIS) by establishing a link between the LIS key figure relevant to the resource driver, and the statistical key figure of the business process. As an example, the ”Number of Purchase Orders” can be logged automatically in a LIS information structure whenever the relevant transaction is executed. You can also assign resourc- es to business processes using fixed percentages or some other distribution key. The push approach is unable to identify variable cost components in a business process. Fig. 2-4: Cost Center Assessment and Distribution Resources from the cost center Quality Management can be assessed or distributed to the respec- tive business processes through the resource driver labor hours. Process Consumption Business Process Assessment To assign business processes to receiver objects, the R/3 System offers the assess- ment method because in ABC the cause of consumption costs for the receiver is normally the dominant issue. Process drivers appear as tracing factors in the as- sessment cycle just like the resource drivers do. The LIS can thereby serve as a source of relevant cost driver information for process drivers, as it did for resource drivers in the scenario described above. If you make a process assessment directly on to the profitability segments in the Profitability Analysis component (CO-PA), the value fields in the operating concern serve as the tracing factors. In order to create a causal relationship between profitability segment and process consump- tion, you can transfer the cost driver information from the LIS to the correspond- ing value fields (see Figure 2-5). For process costs taken from the assessment, no variable cost portions are identified in the receiver object.
  • 7. 2-7 Integrated ABC in R/3 2 Fig. 2-5: Process Assessment Process costs from the purchasing process are directly assessed onto the corresponding profit- ability segments by means of the process driver ”Number of Orders”. The system automatically logs the process driver quantity in the LIS originally. Completely Crediting SenderThe cost center distribution, cost center assessment and the process assessment are purely value calculations that ultimately completely credit the sender object. Assessments are also made in order to transport cost center or processes variances to the profitability analysis. Push Approach used for Full Cost Absorption The push approach is easy to implement, but allows for limited analysis. The push approach ”method” of value calculation merely allocates costs from sender to re- ceiver. The driver used in the assignments are not posted. The assignment of fixed and variable costs is not possible because the quantity flow is not measured. Fully absorbed costs are allocated in each case. The operating rate and capacity utiliza- tion of the sender object cannot be identified through the sender object. You could carry out a variance analysis in this case only through a plan / actual comparison at the cost element level. This relatively imprecise method is used often because it is easy to implement also in non-integrated systems. The Pull Approach Quantity Based Cost Assignment Highly integrated systems support the more precise quantity based cost assign- ment. It provides the basis for the pull approach. The underlying quantity flow is an objective measure for the activities performed for the various cost perspectives of the enterprise, independent of the valuation of quantities. The term pull em- phasizes that this method calculates quantities utilized retroactively, and does not distribute or push costs fowards. Quantities are actively pulled by the receiver objects and evaluated with costs in a second step. The following example of an enterprise planning cycle clarifies this method. However, it is valid for the assign- ment of actual quantities and costs as well.
  • 8. 2-8 2 Integrated ABC in R/3 Fig. 2-6: The Pull Approach. Starting with the sales plan, process and resource quantities to be made available are ”pulled” based on a causal driver relationship. Primary cost planning occurs in cost centers on this foun- dation. The resulting price calculation for resources and processes valuates the entire quantity structure with costs. Building a Quantity Structure The pull approach begins at the end of the value adding chain (see Figure 2-6). Operations and sales plans make up the foundation. Process driver relationships describe the causal relationship between the planned sales quantity for various market segments and the process quantities to be utilized. If after executing the planned process quantity assignment, the planned process quantities are known, the system uses these to calculate the resource quantities. Normally, resource driver relationships are used in the form of average quantities for the resource consump- tion per process execution. A realistic primary cost plan is now possible through the known resource quantities. From this point, a continuous plan quantity struc- ture exists for the firm. Valuating Quantity Structures The plan prices for the various resources (activity types) can now be automatical- ly calculated based on capacity or planned quantity. Manually set prices are also possible to allow management to valuate activities as it sees appropriate. The meth- od chosen to calculate prices basically determines how powerful ABC will be as an information tool. The consequences are discussed in another section. Resource quantities used by the processes are valuated with the prices. This influences the cost flow from cost centers to processes. The process cost and quantity make up the process price, which valuates the quantities utilized by the market segments or products. This makes the assignment of costs to the receiver accurate. The price calculation and valuation of the quantity structure is an iterative process that guar- antees the correct handling of circular relationships in this structure. For the valu-
  • 9. 2-9 Integrated ABC in R/3 2 ation of the actual quantity structure, the system uses the plan prices. The actual activity price calculation, based on posted actual costs and quantities supports the calculation of prices at period end, and completely credits the cost centers. Thus, while seasonal price changes are normally accepted, this is not the case from the perspective of ABC. Resource Consumption The methods supported by the R/3 system to assign resources to processes based on quantities are the direct and indirect activity allocations, the target=actual as- signment as well as the structured process. Direct Activity AllocationWith direct activity allocation, the resource driver is manifested by an activity type that represents the output produced by a cost center resource (such as employee hours or kilowatt-hours, among others). This form of resource assignment is the most accurate approach, but at the same time the most time-consuming because you must measure and enter the exact quantities of resource outputs consumed. This usually occurs as a manual confirmation of quantities on both the sender and the receiver sides. If a manual time confirmation of resources is set through CATS (Cross Application Time Sheet), the system carries out a corresponding direct activ- ity allocation in the background. The process is thus one of the possible receivers in CATS. Data from other systems can also be posted in the R/3 for driver quantity entries as direct activity allocations through BAPI’s (BusinessApplication Program- ming Interface) or through the batch input method. All validations of the direct activity allocations go through this automatic allocation in the background. Fig. 2-7: Direct Activity Allocation. The resource quantities utilized are either manually or automatically allocated to the processes, and then valuated with the corresponding price.
  • 10. 2-10 2 Integrated ABC in R/3 The indirect activity allocation uses the tracing factor of a corresponding cycle as resource driver, as it does with both push approachs. The difference, however, lies in the fact that the resource driver is not used for cost distribution, but rather as the basis for assignments of quantities. Indirect activity allocation can be applied in two variations. With the manual variant, you assign the known resource quan- tities from the cost center to the business processes in relation to the resource driv- ers (tracing factors). With the retroactive variant, the resource driver quantity (for example, number of orders) is multiplied with the standard quantity (for exam- ple, 2 min. per order); this ultimately determines the resource quantity utilized by the process. The total of all resource quantities consumed by business processes equals the total output of the resource by the cost center (see Figure 2-8). Fig. 2-8: Inverse Indirect Activity Allocation. The driver quantities for the number of orders are known for both purchasing processes. On average, each inland order takes 0.1 clerk hours (the sender value of the cost center/activity type). An international order is twice as expensive, which comes to a receiver weight factor of 2. Both processes require a total of 1,400 clerk hours from the purchasing cost center. This repre- sents 84,000- in resource costs. This gives a price of 60-/hr that is used to value the quantities consumed by the respective processes. Target=Actual The target=actual allocation also uses an inverse approach to determine resource consumption, but returns actual quantities only. The R/3 System uses individual- ly confirmed actual process quantities and considers the corresponding plan quan- tities to calculate an operating rate. If resource outputs are difficult to measure, plan quantities consumed by processes are multiplied by the operating rate to calculate target quantities. Assuming that the execution of individual processes can be standardized, and that the relationship between the planned resource con- sumption and process quantities are realistic, then the target quantities determined beforehand are set as the actual quantities. Indirect Activity Allocation
  • 11. 2-11 Integrated ABC in R/3 2 Structured processes offer the greatest flexibility to assign output quantities of the cost center resources to business processes. The template, or process template, which is attached to the master record of a process, explicitly describes the struc- ture of this process. Similar to a routing for direct activities, the template describes the indirect activities that occur during each execution of a business process. It defines which cost center resources are consumed by the business process and in which quantities. The template is a highly flexible tool because it allows you to determine what resources are consumed and calculates consumed quantities dy- namically. This means you can model complex resource drivers by means of func- tions and formulas. The template also allows you to distinguish between variable and fixed quantities consumed (see Figure 2-9, Process Order Configuration). The variable quantity factor represents an average quantity for each business process execution, which when multiplied by the process output equals the variable out- put quantity of the resource consumed by the process. The fixed resource quantity utilized is independent of the process output and can therefore be compared with a ”stand-by” resource. The process uses this, even when it is not carried out. The costs consumed with the structured process approach can be divided into fixed and variable portions. Fig. 2-9: Templates for Structured Processes Structured Processes
  • 12. 2-12 2 Integrated ABC in R/3 Process models with several layers can be implemented through the structured process since sub-processes can be included in the template next to the tasks/jobs at the cost center level; these portions of processes can in turn have a structure (template) (see Figure 2-9, process order processing). With multi-step business process models, note that you must ensure a causal relationship between the pro- cess drivers of the main business process and the process drivers of the sub-pro- cesses as well as the resource drivers at the task level. Only if you ensure propor- tionality between the drivers at the various levels will the allocations of the result- ing resource inputs make sense solely via the cost driver of the primary business process. Tasks represent a link between cost center accounting andABC because they make up the base of both functional and process oriented structures. On the one hand, tasks represent the lowest level of the process segmentation. On the other hand, they correspond to the activity types of the cost centers (see Figure 2-10). The relationship between the activity types and the task produces a task catalog con- taining the average quantity of an activity type that is required when executing a task. The resources consumed by tasks are valued through the utilization of activ- ity types; here, the cost center is credited, and the process or sub-process is debit- ed. No costs are assigned at the tasks level because these are known through the activity type price and standard activity type quantity for the task. Fig. 2-10: Tasks as Links between Functional and Process Oriented Structures Process Consumption In order to assign business processes to receiver objects based on quantities, you can use all the described methods of quantity assignment for resource consump- tion. Instead of resource drivers, the process driver serves as the measurement for consumption of overhead business processes by the receivers. The methods of direct and indirect process allocation, and target=actual allocation will therefore not be described in detail here. Tasks
  • 13. 2-13 Integrated ABC in R/3 2 Fig. 2-11: Template for Product/Cost Object Through functions, the templates access process driver relevant information from the cost object environment. User defined formulas allow a dynamic calculation of the quantities pulled by the cost object, and valuated with the process price. In addition to the structured processes, the dynamic process allocation is another method that supports the use of the template. With this method, processes are equitably assigned to cost objects or market segments over the appropriate pro- cess driver. The functionality for processes introduced below is also available for the activity types of the cost centers. Template for Cost Objects The template can dynamically (automatically) ascertain the processes relevant for a cost object. The R/3 System automatically calculates the process quantities uti- lized at the time of costing using process driver relevant data in the environment of the cost object (see Figure 2-11). A wide spectrum of functions, as well as user- defined formulas, allows you to model complex process drivers. The process quan- tities consumed by the cost objects are posted differently to allow the process costs accepted by the cost object to include both variable and fixed amounts. The pro- cess costs of a cost object can also be identified in aggregate form in the profit analysis through the cost component split. Dynamic Process Allocation
  • 14. 2-14 2 Integrated ABC in R/3 The template represents a general description of processes and process quantities independent of the costing object. You can use the template to determine quanti- ty-based utilization of business processes by cost objects. It consists mainly of four columns: the object (process), the driver quantity, the activation, and the alloca- tion event (see Figure 2-12). The individual columns answer the questions: which process, under which conditions and with what quantity is assigned to the cost object at what time. The following example concerning material movement pro- cesses underscores the high flexibility of the template in determining driver quan- tities. This flexibility and the resulting high degree of automation for quantity based assignments makes the template a key tool for the pull approach. Format and Function of the Template in Costing Fig. 2-12: Format of the Template for Cost Objects Which Process? The template can identify the utilized processes during the calculation. A user defined approach to find a material movement process can be structured around the following logic. An enterprise is made up of several plants. Each plant has a materials movement process that supplies the necessary stock materials for the production line. For this process, each plant uses various resources, resulting in various process prices at the separate plants. Each process carries with it an orga- nizational attribute containing the plant. All materials movement processes are summarized in a process group. The costed product in question here is produced in plant A. The user-defined approach automatically identifies all material move- ment processes from the process group that match the plant attributes of produc- tion plant A. Under which conditions? The quantity and activation columns each distinguish plan and actual data. The activation columns contain conditions under which the process is executed. With the previously mentioned example concerning material movement processes, you can check whether the costed product is completely or partially produced in-house. Outsourced products deactivate the process. Usually, an activation condition in plan agrees with that in actual.
  • 15. 2-15 Integrated ABC in R/3 2 Which process quantities in plan and actual? However, this does not pertain to driver quantity calculations. Though the pro- cess driver in plan and actual are identical (for example, the number of palette movements for a material movement process), the corresponding driver quanti- ties in plan and actual are calculated differently. The calculation of palette move- ments for a specific production order in plan must comply with a model based on master data values because during the plan calculation, no movement data exists (see Figure 2-13). On the other hand, the number of material movements that in fact occurred can be deduced from the posted material voucher. Of course, you can also use fixed standard quantities, utilized by a cost object (for example, pro- duction order), in the respective columns. You can enter an order planning pro- cess quantity of 1 in the plan as well as in the actual if this process is always utilized only once per production order. Fig. 2-13: Template Formula for Dynamic Driver Quantity Determination. The formulas for the driver quantity determination in the plan can vary from the actual formulas. Flexible Functions for Com- plex Drivers With the flexible template functions you can implement in the R/3 system your choice of firm specific driver formulas which are based on R/3 table structures. In our example, we will now see how the calculation of the number of palette move- ments for the manufacture of one product type with a specific lot size can be ef- fected in the plan through a flexible function (see Figure 2-14). The flexible func- tion used here is from the standard R/3, and runs through all BOM items (BOM table) of the material that is in manufacturing. For each item, the system carries out the user defined algorithms that calculate the number of palette movements for the respective BOM component. The calculated quantity of a component need- ed is the product of the BOM quantity (standard function) and the production lot size (standard function). This is subsequently divided by the number of compo- nents (standard function) contained in a palette (listed in the material master record of the component). Because an entire palette must be moved even when only a portion of its contents is needed, the quotient is rounded to the next whole num-
  • 16. 2-16 2 Integrated ABC in R/3 ber. To complete the calculation, the flexible function adds the results at the item level and offers the sum of the palette movements for this product as the driver quantity. Fig. 2-14: Flexible Function. The total number of palette movements for the material consists of the sum of the palette move- ments corresponding to each component. The values for the components come from the material BOM’s and the material master records of the components. When does the allocation occur? Because cost objects imply controlling jobs that may exist over various periods, the right time frame to assign the process to the cost object becomes an issue. The column for the allocation event allows you to control events like the start or deliv- ery of an order. The processes are then assigned to the cost objects only within the respective period containing the desired event. This column is therefore only rel- evant for the assignment of the actual driver quantity. It can play an important role for the WIP calculation. Many functions for the actual quantity calculation automatically supply period relevant results. For such functions, no allocation event control is needed. Reusable Template A template can be used for many cost objects. The template for the concrete object (product) is automatically identified and valued when the product costing is run. You can use the same template for many, or even all products. The template does not have to be maintained for each product, as is the case with the routing and the BOM. The ability of the template to determine the process and to calculate process quantities dynamically makes it a powerful tool since a single definition can be reused any number of times; for example, the same formula used to calculate the palette movements is valid for all products, but needs defining only once. You can make existing templates subordinate to main ones, and thus extend the usability of these templates even further, and simultaneously reduce the time needed to create or adjust main templates.
  • 17. 2-17 Integrated ABC in R/3 2 The costing of the cost object occurs at various points during its life cycle (see Figure 2-15). This makes job costing comprehensive enough to include process costing. The planning activity for a cost object begins with the non-order-generat- ed product costing which determines the standard price for the product. Opening an order initiates preliminary costing. Actual costs that are entered during pro- duction are constantly controlled. At the conclusion of specific periods various milestones or reporting points, actual quantities, material consumption or pro- cesses can be confirmed; this helps check the compliance of the cost estimates. The conclusion of an order finalizes the costing, which calculates the actual order costs and compares these with the planned ones; this guarantees the controlling of costs for each order at any time. Calculation Occurrences Fig. 2-15: Overview of Costing Methods at Various Times Templates for Market Segments Processes not driven by production, but rather by customers, distribution chan- nels, regions or other items, can be assigned directly to the corresponding market segments in the profit analysis according to their quantitative consumption with the help the template The template referenced here and the one used for cost ob- jects differ only marginally. Process Drivers of the Market Segments Template functions can automatically calculate process driver quantities based on the profitability analysis information. The LIS and external systems can also serve as sources for this information (see Figure 2-16). For example, the system calculates the plan driver quantity for process ”order taking” based on the sales quantities per customer and product planned in CO-PA. The system can calculate the driver quan- tity ”number of order items taken” by assuming an average order quantity per or- der item and making the number of order items taken equal the planned sales quan- tity divided by the average ordered quantity per order item. The LIS can serve as a data source to calculate the corresponding actual driver quantity. The system can automaticallylogthenumberofactualorderitemspercustomerandproductthrough a LIS information structure. The template directly accesses the corresponding LIS key figure of the information structure whose characteristic values correspond to the market segment, which consumes the process as receiver object.
  • 18. 2-18 2 Integrated ABC in R/3 Fig. 2-16: Templates for Market segments The driver quantities can be available directly in the of the value fields of CO-PA as well as in the LIS or external system. Template Assignment and Assignment Levels The template for market segments can also be reused. The search approach in this case is tied to characteristics of the market sector. This allows you to assign a tem- plate at a high level (for example, to a region), or at a more detailed level (for example, to customer groups or product groups). The higher the defined assign- ment level is, the more often you can reuse the template because the higher levels encompass all the market segments of the respective detailed levels. It is impor- tant that the level of the template assignment be different from that of the process assignment. The assignment can be controlled by all means through the region or the sales organization. The assignment occurs at the customer group / product group levels and even at the customer / product levels. Push versus Pull The effect that the chosen method has on how the firm is controlled is discussed below. Consequences of the Push Approach: Full Cost Absorption Pure cost distribution methods make it possible to realistically assign overhead costs to their originating receiver objects with the appropriate driver (such as products and customers), which is not possible with traditional overhead costing. Nevertheless, this is solely an assignment of all occurring costs that does not take the true activity quantities consumed into account. You thus cannot answer questions dealing with the productivity of overhead processes, or with the costs of idle resource capacity. Consequences of the Pull Approach: Variance Analysis The technique of the pull approach requires more input than that of the value accounting since an analytical plan and a measurement of the actual quantities are necessary. The quality of ABC depends on the quality and measurability of the drivers. The knowledge that the utilization of a procurement process depends on the complexity of the materials to be procured is useless if this complexity is not measurable. The results of a process assignment are questionable if they are based on rough percentages due to a lack of ascertainable measures. Manual measures are normally unfeasible for prolonged ABC use. Many of the necessary measures are already available in the SAP R/3 system in the statistical data. The use of this data in an integrated ABC is facilitated by existing mechanisms, like the template.
  • 19. 2-19 Integrated ABC in R/3 2 An advantage is that now an operating rate can be calculated with the known actual quantity and an underlying planning quantity. This makes it possible to compare the plan with actual and target with actual of costs and quantities. Vari- ances can be analyzed and differentiated according to various categories. Ques- tions regarding the productivity of the overhead processes can thus be addressed. Fair Cost AssignmentThe pull approach makes it possible to examine a resource quantity or process quan- tity flow throughout the entire value added chain of an organization. This remains the case as long as the user selects the appropriate resource and cost drivers and makes appropriate assignments of overhead costs to their originating receiver ob- jects (such as products and customers). The advantage of this pull approach is the use of only those quantities actually consumed by the receiver objects. Costs due to unused capacity remain in the cost center when resource prices are calculated based on capacity. The pull approach guarantees fair cost assignments to products and customers since no penalties are made due to unused capacity costs. Activity-Based BudgetingThrough the inverse method described, the pull approach allows you to transfer plan sales quantities automatically to the existing process and resource quantities of the cost center resources.The R/3 system utilizes the resource and process driver relationship established by the user. For the backflush calculation of the quantity flow it is important to distinguish between fixed and variable quantities. Only variable quantities are adjusted to the changed sales quantities in the integrated planning. The integrated planning supports Activity-Based Budgeting, and helps identify unused or under capacity of the cost center resources. These overhead resources can then be redistributed if necessary. Simultaneous Use of Push and Pull The user of the integrated ABC in R/3 is not forced to use only one of the ap- proaches. Both approaches can be implemented simultaneously (see Figure 2-17). Depending on the situation in the enterprise, it may still be necessary to apply the more informative pull approach with specific resources and processes. Fig. 2-17: Simultaneous Use of Push and Pull Approaches in the Integrated ABC