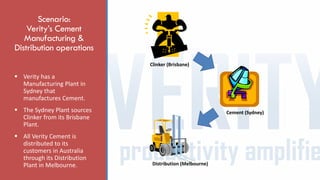
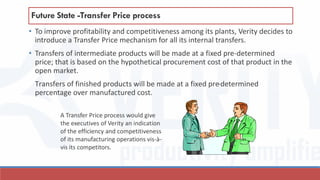
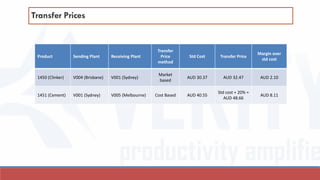
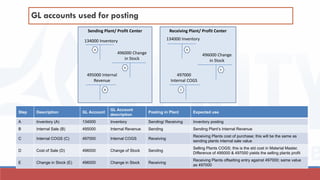
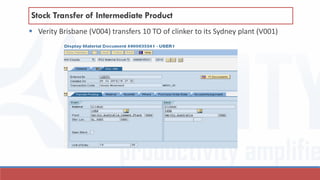
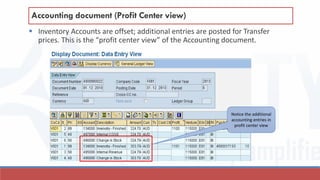
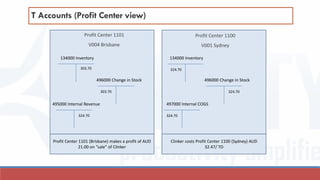
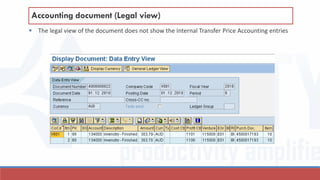
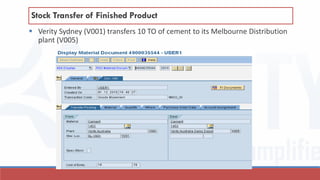
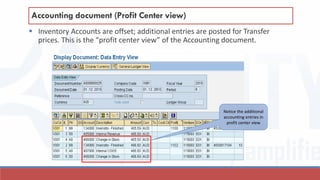
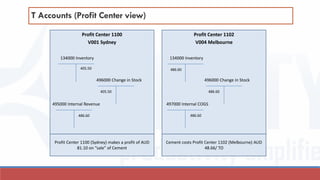
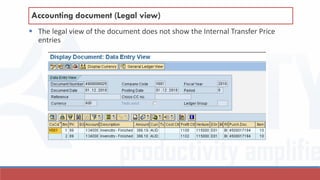
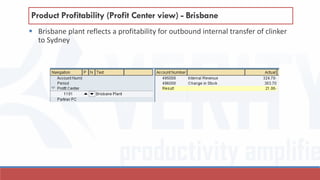
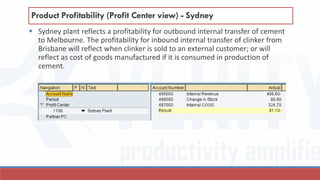
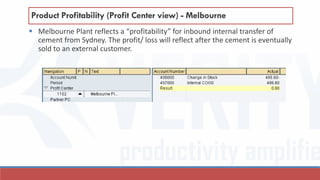
Verity Cement uses SAP Material Ledger to implement intra-company transfer pricing between its manufacturing plant in Brisbane, plant in Sydney, and distribution center in Melbourne. Previously, transfers were done at cost without reflecting individual profitability. The new system uses negotiated transfer prices based on market costs for intermediate goods and a margin over standard cost for finished goods. This allows each subunit to measure independent profitability and improve competitiveness through the profit center view in SAP.
AUC is Asset under construction where some assets are in construction phase and cost needs to
capture through internal order for the time being. Once asset is fully completed then cost would
be transferred to another cost object (E.g. Cost center, Order etc...) and settle with final asset.
E.g. XYZ Company constructing building for their office. While construction many expenses are
attached to it. Till the time it is created we cannot charge it in building account hence we need to
create AUC account where cost will be stored.
Assets under construction (AUC) are a special form of tangible assets. They are usually displayed
as a separate balance sheet item and therefore require a separate account determination and their
own asset classes. During the construction phase of an asset, all actual postings are assigned to the
AUC. Once the asset is completed, a transfer is made to the final fixed asset
Blogs on Document Splitting at www.veritysolutions.com.au
Document Splitting is a very powerful feature delivered by SAP ECC.
Previous to SAP ECC, if new fields were required to General Ledger SAP had to deliver these new fields in Special Purpose Ledger tables. Profit Centre Accounting in R3 was Special Purpose Ledger table 8*, Joint Venture Accounting was ledger 4*. This essentially meant that data had to be copied from General Ledger table GLT0 to special ledger tables so these could be reported upon. However, technical glitches in code and incorrect usage of functionalities caused imbalances between the main ledger GLT0 and the special purpose ledgers.
SAP customers who wanted to expand the functionality of General Ledger to cater to special business requirements (like reporting General Ledger with another fiscal year variant) had to create custom Special Purpose Ledger tables. For example, if a customer wanted to report by two fiscal year variants, they could report one variant using General Ledger and the other variant using Special Purpose Ledger.
All this disparate ledgers reported the same source information in different views. Customers had to execute several month end jobs to ensure synchronisation of data across all these ledgers. Differences in balances and information between ledgers led to delays in month end close and reporting.
With SAP ECC new GL, SAP Customers can add new fields (which SAP calls “scenarios”) into General Ledger. This allows customers to perform, for example, Profit Centre Accounting and Reporting within General Ledger.
With SAP ECC new GL, SAP Customers can add new ledgers (which SAP calls “parallel accounting”) into General Ledger. This allows customers to report, for example, the same General Ledger data in multiple fiscal year variants.
This replication of data happens in real-time. SAP customers no longer need to execute month end jobs to synchronise data between different ledgers.
Automatic Vendor payment advice notes by email with attachment when a payment is made via APP (Automatic payment program by using T-code F110 and email a sap script form as a PDF attachment along with the mail body in the desired language.
SAP Accounts Reveivable SAP Documents | http://sapdocs.infosapdocs. info
Get this and other SAP Account Reveivable Materials from http://sapdocs.info/sap/fico/sap-accounts-receivable-ppt-training-materials-documents-for-beginners/
for more SAP Documents please visit http://sapdocs.info
SAP FICO - Why SAP uses Internal Orders?Sanjay Ram
Understand why internal orders are used instead of cost centers as explained by http://www.erptraining9.com
Why an Internal Order is required?
Creation of Internal Order
Operational Expenditure Postings
Settlement of Internal Orders to Cost Centers
Internal Order Reporting
Commitment Management in SAP tracks future commitments against cost objects; this enables users to make a realistic comparison of actual cost plus committed cost against plan / budget on that cost object. Commitments are made when user creates purchasing document to purchase goods or services at a future date. Comparing actual against budget is misleading unless you factor in the outstanding commitments that will convert to actual cost in the future.
Blogs on www.veritysolutions.com.au
STRIVE ERP TECHNOLOGIES PROVIDING SAP FUNDS MANAGEMENT ONLINE TRAINING AND CLASS ROOM TRAINING
CONTACT :+917675979146
E-MAIL:STRIVEERP@GMAIL.COM
WWW.STRIVEERP.COM
Income Statement Reporting Challenges with BI Tools: Helping IT and Finance t...Senturus
Use Cognos BI tools to maximize income statement reporting for finance and IT teams. View the webinar video recording and download this deck: http://www.senturus.com/resources/income-statement-reporting-challenges-bi-tools/,
Issues addressed include: 1) The need for both revenue and expenses to be displayed as positive numbers in the income statement; 2) The need to compare budget vs. actual with flexibility to choose which budget version to use and 3) The need to display positive variances as favorable in some cases, and as unfavorable in others.
We also share tips and techniques for configuring IBM Cognos Transformer models to enhance OLAP-based income statement reporting and ad hoc analysis.
Senturus, a business analytics consulting firm, has a resource library with hundreds of free recorded webinars, trainings, demos and unbiased product reviews. Take a look and share them with your colleagues and friends: http://www.senturus.com/resources/.
1.(Points 16.0) Identify each of the following cash flows i.docxjackiewalcutt
1.
(Points: 16.0) Identify each of the following cash flows in 1-8 and their association with (a) initial, (b) periodic, or (c) terminal cash flows for an investment project.
Column preview
The project asset cost
terminal cash flows
Expenditures for fixed and variable production costs
initial cash flows
Tax on gain (loss) on disposal of the investment
periodic cash flows
Loss in tax savings from lost depreciation
Receipts from sales
Freight and installation costs
Proceeds of salvage of equipment
Opportunity costs of undertaking this particular project
Matching pairs
(Match options are: terminal cash flows, initial cash flows, periodic cash flows)
1. The project asset cost
2. Expenditures for fixed and variable production costs
3. Tax on gain (loss) on disposal of the investment
4. Loss in tax savings from lost depreciation
5. Receipts from sales
6. Freight and installation costs
7. Proceeds of salvage of equipment
8. Opportunity costs of undertaking this particular project
2.
(Points: 16.0) Select the appropriate cost hierarchy level for each of the following questions.
Column preview
Human Resource Department
Product-level activity
Top Management
Unit-level activity
Machine set-ups
Facility-level activity
Direct Material costs
Batch-level activity
Customer service
Customer-level activity
Customer files
Design work
Advertising
Matching pairs
1. Human Resource Department
2. Top Management
3. Machine set-ups
4. Direct Material costs
5. Customer service
6. Customer files
7. Design work
8. Advertising
(Match options are: Product-level activity, unit-level activity, Facility-level activity, Batch-level activity, Customer-level activity)3.
(Points: 2.0) Activity-based costing is commonly used with standard costing. Using activity-based costing, a company has
1. multiple cost drivers.
2. a single cost driver
3. the same cost drivers as standard costing.
4. no cost drivers.
4.
(Points: 2.0) What is the result of substituting computerized equipment for direct labor?
1. Less direct labor and more manufacturing overhead.
2. Less direct material and more manufacturing overhead.
3. Less manufacturing overhead and more direct materials.
4. Less direct labor and more direct material.
5.
(Points: 2.0) ABC Company
ABC Company reports the following information for the most recent period when 2,750 units were produced.
Cost
Standard
Actual
Materials
2 lbs. @ $5.00 per pound
7,000 pounds purchased for $34,650
Labor
0.50 hours @ $8.00 per hour
1,400 hours @ $7.95 per hour
Refer to ABC Company. Calculate the direct materials efficiency variance.
1. $7,150 U
2. $7,150 F
3. $7,500 U
4. $7,500 F
6.
(Points: 2.0) ABC Company
ABC Company reports the following information for the most recent period when 2,750 units were produced.
Cost
Standard
Actual
Materials
2 lbs. @ $5.00 per pound
7,000 pounds purchased for $34,650
Labor
0.50 hours @ $8.00 per hour
1,400 hours @ ...
Company 1Company #1Income StatementBalance SheetAll numbers in thoLynellBull52
Company 1Company #1Income StatementBalance SheetAll numbers in thousandsAll numbers in thousandsRevenue20182017Period Ending20182017Total Revenue14,134,73212,866,757Current AssetsCost of Revenue9,510,2388,668,505Cash And Cash Equivalents1,290,2941,111,599Gross Profit4,624,4944,198,252Short Term Investments512-Operating ExpensesNet Receivables87,86875,154Selling General and Administrative2,576,0982,395,608Inventory1,641,7351,512,886Total Operating Expenses12,086,33611,064,113Other Current Assets11,84713,642Operating Income or Loss2,048,3961,802,644Total Current Assets3,151,1572,813,049Income from Continuing OperationsLong Term Investments7121,288Total Other Income/Expenses Net-7,676-16,488Property Plant and Equipment2,382,4642,328,048Earnings Before Interest and Taxes2,048,3961,802,644Other Assets187,718166,966Interest Expense-18,847-19,569Deferred Long Term Asset Charges--Income Before Tax2,040,7201,786,156Total Assets5,722,0515,309,351Income Tax Expense677,967668,502Current LiabilitiesNet Income1,362,7531,117,654Accounts Payable1,059,8441,021,735Short/Current Long Term Debt84,973-Other Current Liabilities9,90224,559Total Current Liabilities1,926,4021,752,506Long Term Debt311,994396,493Other Liabilities434,347412,335Total Liabilities2,672,7432,561,334Stockholders' EquityPreferred Stock--Common Stock3,7963,919Retained Earnings2,071,4001,801,138Treasury Stock-318,252-272,755Capital Surplus1,292,3911,215,806Total Stockholder Equity3,049,3082,748,017Net Tangible Assets3,049,3082,748,017
Company 2Company #2Income StatementBalance SheetAll numbers in thousandsAll numbers in thousandsRevenue20182017Period Ending20182017Total Revenue38,972,93435,864,664Current AssetsCost of Revenue27,831,17725,502,167Cash And Cash Equivalents3,030,2002,758,477Gross Profit11,141,75710,362,497Short Term Investments-506,165Operating ExpensesNet Receivables860,000327,166Selling General and Administrative6,923,5646,375,071Inventory4,579,0004,187,243Total Operating Expenses34,754,74131,877,238Other Current Assets-12,217Operating Income or Loss4,218,1933,987,426Total Current Assets8,469,2008,485,727Income from Continuing OperationsLong Term Investments--Total Other Income/Expenses Net-44,982-130,838Property Plant and Equipment5,255,2005,006,053Earnings Before Interest and Taxes4,218,1933,987,426Goodwill97,600100,069Interest Expense-8,860-64,295Intangible Assets-144,900Income Before Tax4,173,2113,856,588Other Assets504,000321,266Income Tax Expense1,113,4131,248,640Deferred Long Term Asset Charges-6,558Net Income3,059,7982,607,948Total Assets14,326,00014,058,015Current LiabilitiesAccounts Payable2,644,1002,488,373Short/Current Long Term Debt--Other Current Liabilities-1,429,136Total Current Liabilities5,531,3005,125,537Long Term Debt2,233,6002,230,607Other Liabilities1,512,5001,331,645Total Liabilities9,277,4008,909,706Stockholders' EquityPreferred Stock--Common Stock5,048,600628,009Retained Earnings-4,962,159Treasury Stock--441,859Capital Surplus--Other Stockholder Equity--4 ...
ACG 2071 Chapter 13 Analysis of Financial Statements .docxbobbywlane695641
ACG 2071 Chapter 13: Analysis of Financial Statements
Created by M. Mari
Fall 2011-1
1
Financial Statement Analysis
• Applies analytical tools to general purpose financial statements and related data for making
business decisions.
• Purpose:
• Internal users: it provides strategic information to improve company efficiency and
effectiveness in proving products and services
• External users: rely on financial statement analysis to make better and more informed
decisions in pursuing their own goals
• Common Goals:
• Evaluate company performance and financial conditions
• Evaluating past and current performance
• Evaluating current financial position
• Evaluating future performance and risk
Building Blocks of Analysis
Horizontal Analysis
• Refers to the examination of financial statements across time
• Comparative statements facilitates this.
• Its shows financial amounts in side-by-side columns on a single statement
• Includes:
• Dollar change = Current period amount – base period amount
• Percent Change = Current period amount – base period amount
• Base period amount
Liquidity and efficiency
Solvency
Profitability
Market prospects
ACG 2071 Chapter 13: Analysis of Financial Statements
Created by M. Mari
Fall 2011-1
2
Comparison of two years of operations by computing the dollar change and percentage change in the
line items.
ACG 2071 Chapter 13: Analysis of Financial Statements
Created by M. Mari
Fall 2011-1
3
Trend Analysis:
• Form of horizontal analysis that can reveal patterns in data across successive
periods.
• It involves computing trend percents for a series of financial numbers and is a
variation on the use of percent changes
• Trend Percent = Current period amount X 100
• Base period amount
ACG 2071 Managerial Accounting
Process Costing Systems
Minicase
Jeffersonian Corporation has been in business for over 50 years. The company is looking to expand
operations into the Pacific Rim and would like an analysis of its financial statements to be prepared.
Review the financial statements below:
Jeffersonian Corporation
Comparative Income Statement
For years ended December 31, 2011 and 2010
2011 2010
Sales $ 2,486,000.00 $ 2,075,000.00
Cost of goods sold $ 1,523,000.00 $ 1,222,000.00
Gross Profit $ 963,000.00 $ 853,000.00
Operating Expenses
Salaries Expense $ 145,000.00 $ 100,000.00
Contract Labor Expense $ 240,000.00 $ 280,000.00
Insurance Expense $ 165,000.00 $ 200,000.00
Supplies expense $ 100,000.00 $ 45,000.00
.
the document is on Cost volume profit analysis.
(Cost-volume-profit (CVP) analysis is used to determine how changes in costs and volume affect a company's operating income and net income.)
Key Trends Shaping the Future of Infrastructure.pdfCheryl Hung
Keynote at DIGIT West Expo, Glasgow on 29 May 2024.
Cheryl Hung, ochery.com
Sr Director, Infrastructure Ecosystem, Arm.
The key trends across hardware, cloud and open-source; exploring how these areas are likely to mature and develop over the short and long-term, and then considering how organisations can position themselves to adapt and thrive.
GraphRAG is All You need? LLM & Knowledge GraphGuy Korland
Guy Korland, CEO and Co-founder of FalkorDB, will review two articles on the integration of language models with knowledge graphs.
1. Unifying Large Language Models and Knowledge Graphs: A Roadmap.
https://arxiv.org/abs/2306.08302
2. Microsoft Research's GraphRAG paper and a review paper on various uses of knowledge graphs:
https://www.microsoft.com/en-us/research/blog/graphrag-unlocking-llm-discovery-on-narrative-private-data/
Accelerate your Kubernetes clusters with Varnish CachingThijs Feryn
A presentation about the usage and availability of Varnish on Kubernetes. This talk explores the capabilities of Varnish caching and shows how to use the Varnish Helm chart to deploy it to Kubernetes.
This presentation was delivered at K8SUG Singapore. See https://feryn.eu/presentations/accelerate-your-kubernetes-clusters-with-varnish-caching-k8sug-singapore-28-2024 for more details.
Essentials of Automations: Optimizing FME Workflows with ParametersSafe Software
Are you looking to streamline your workflows and boost your projects’ efficiency? Do you find yourself searching for ways to add flexibility and control over your FME workflows? If so, you’re in the right place.
Join us for an insightful dive into the world of FME parameters, a critical element in optimizing workflow efficiency. This webinar marks the beginning of our three-part “Essentials of Automation” series. This first webinar is designed to equip you with the knowledge and skills to utilize parameters effectively: enhancing the flexibility, maintainability, and user control of your FME projects.
Here’s what you’ll gain:
- Essentials of FME Parameters: Understand the pivotal role of parameters, including Reader/Writer, Transformer, User, and FME Flow categories. Discover how they are the key to unlocking automation and optimization within your workflows.
- Practical Applications in FME Form: Delve into key user parameter types including choice, connections, and file URLs. Allow users to control how a workflow runs, making your workflows more reusable. Learn to import values and deliver the best user experience for your workflows while enhancing accuracy.
- Optimization Strategies in FME Flow: Explore the creation and strategic deployment of parameters in FME Flow, including the use of deployment and geometry parameters, to maximize workflow efficiency.
- Pro Tips for Success: Gain insights on parameterizing connections and leveraging new features like Conditional Visibility for clarity and simplicity.
We’ll wrap up with a glimpse into future webinars, followed by a Q&A session to address your specific questions surrounding this topic.
Don’t miss this opportunity to elevate your FME expertise and drive your projects to new heights of efficiency.
LF Energy Webinar: Electrical Grid Modelling and Simulation Through PowSyBl -...DanBrown980551
Do you want to learn how to model and simulate an electrical network from scratch in under an hour?
Then welcome to this PowSyBl workshop, hosted by Rte, the French Transmission System Operator (TSO)!
During the webinar, you will discover the PowSyBl ecosystem as well as handle and study an electrical network through an interactive Python notebook.
PowSyBl is an open source project hosted by LF Energy, which offers a comprehensive set of features for electrical grid modelling and simulation. Among other advanced features, PowSyBl provides:
- A fully editable and extendable library for grid component modelling;
- Visualization tools to display your network;
- Grid simulation tools, such as power flows, security analyses (with or without remedial actions) and sensitivity analyses;
The framework is mostly written in Java, with a Python binding so that Python developers can access PowSyBl functionalities as well.
What you will learn during the webinar:
- For beginners: discover PowSyBl's functionalities through a quick general presentation and the notebook, without needing any expert coding skills;
- For advanced developers: master the skills to efficiently apply PowSyBl functionalities to your real-world scenarios.
Securing your Kubernetes cluster_ a step-by-step guide to success !KatiaHIMEUR1
Today, after several years of existence, an extremely active community and an ultra-dynamic ecosystem, Kubernetes has established itself as the de facto standard in container orchestration. Thanks to a wide range of managed services, it has never been so easy to set up a ready-to-use Kubernetes cluster.
However, this ease of use means that the subject of security in Kubernetes is often left for later, or even neglected. This exposes companies to significant risks.
In this talk, I'll show you step-by-step how to secure your Kubernetes cluster for greater peace of mind and reliability.
Transcript: Selling digital books in 2024: Insights from industry leaders - T...BookNet Canada
The publishing industry has been selling digital audiobooks and ebooks for over a decade and has found its groove. What’s changed? What has stayed the same? Where do we go from here? Join a group of leading sales peers from across the industry for a conversation about the lessons learned since the popularization of digital books, best practices, digital book supply chain management, and more.
Link to video recording: https://bnctechforum.ca/sessions/selling-digital-books-in-2024-insights-from-industry-leaders/
Presented by BookNet Canada on May 28, 2024, with support from the Department of Canadian Heritage.
UiPath Test Automation using UiPath Test Suite series, part 3DianaGray10
Welcome to UiPath Test Automation using UiPath Test Suite series part 3. In this session, we will cover desktop automation along with UI automation.
Topics covered:
UI automation Introduction,
UI automation Sample
Desktop automation flow
Pradeep Chinnala, Senior Consultant Automation Developer @WonderBotz and UiPath MVP
Deepak Rai, Automation Practice Lead, Boundaryless Group and UiPath MVP
The Art of the Pitch: WordPress Relationships and SalesLaura Byrne
Clients don’t know what they don’t know. What web solutions are right for them? How does WordPress come into the picture? How do you make sure you understand scope and timeline? What do you do if sometime changes?
All these questions and more will be explored as we talk about matching clients’ needs with what your agency offers without pulling teeth or pulling your hair out. Practical tips, and strategies for successful relationship building that leads to closing the deal.
UiPath Test Automation using UiPath Test Suite series, part 4DianaGray10
Welcome to UiPath Test Automation using UiPath Test Suite series part 4. In this session, we will cover Test Manager overview along with SAP heatmap.
The UiPath Test Manager overview with SAP heatmap webinar offers a concise yet comprehensive exploration of the role of a Test Manager within SAP environments, coupled with the utilization of heatmaps for effective testing strategies.
Participants will gain insights into the responsibilities, challenges, and best practices associated with test management in SAP projects. Additionally, the webinar delves into the significance of heatmaps as a visual aid for identifying testing priorities, areas of risk, and resource allocation within SAP landscapes. Through this session, attendees can expect to enhance their understanding of test management principles while learning practical approaches to optimize testing processes in SAP environments using heatmap visualization techniques
What will you get from this session?
1. Insights into SAP testing best practices
2. Heatmap utilization for testing
3. Optimization of testing processes
4. Demo
Topics covered:
Execution from the test manager
Orchestrator execution result
Defect reporting
SAP heatmap example with demo
Speaker:
Deepak Rai, Automation Practice Lead, Boundaryless Group and UiPath MVP
State of ICS and IoT Cyber Threat Landscape Report 2024 previewPrayukth K V
The IoT and OT threat landscape report has been prepared by the Threat Research Team at Sectrio using data from Sectrio, cyber threat intelligence farming facilities spread across over 85 cities around the world. In addition, Sectrio also runs AI-based advanced threat and payload engagement facilities that serve as sinks to attract and engage sophisticated threat actors, and newer malware including new variants and latent threats that are at an earlier stage of development.
The latest edition of the OT/ICS and IoT security Threat Landscape Report 2024 also covers:
State of global ICS asset and network exposure
Sectoral targets and attacks as well as the cost of ransom
Global APT activity, AI usage, actor and tactic profiles, and implications
Rise in volumes of AI-powered cyberattacks
Major cyber events in 2024
Malware and malicious payload trends
Cyberattack types and targets
Vulnerability exploit attempts on CVEs
Attacks on counties – USA
Expansion of bot farms – how, where, and why
In-depth analysis of the cyber threat landscape across North America, South America, Europe, APAC, and the Middle East
Why are attacks on smart factories rising?
Cyber risk predictions
Axis of attacks – Europe
Systemic attacks in the Middle East
Download the full report from here:
https://sectrio.com/resources/ot-threat-landscape-reports/sectrio-releases-ot-ics-and-iot-security-threat-landscape-report-2024/
Connector Corner: Automate dynamic content and events by pushing a buttonDianaGray10
Here is something new! In our next Connector Corner webinar, we will demonstrate how you can use a single workflow to:
Create a campaign using Mailchimp with merge tags/fields
Send an interactive Slack channel message (using buttons)
Have the message received by managers and peers along with a test email for review
But there’s more:
In a second workflow supporting the same use case, you’ll see:
Your campaign sent to target colleagues for approval
If the “Approve” button is clicked, a Jira/Zendesk ticket is created for the marketing design team
But—if the “Reject” button is pushed, colleagues will be alerted via Slack message
Join us to learn more about this new, human-in-the-loop capability, brought to you by Integration Service connectors.
And...
Speakers:
Akshay Agnihotri, Product Manager
Charlie Greenberg, Host
2. Transfer Price is the price one subunit charges for a product or a service
supplied to another subunit of the same organization
The subunits could belong to the same legal entity or to a different legal entity
(these slides focus on Transfer Pricing within the same legal entity).
Transfer Price
3. Market-based transfer prices
◦ The subunits transfer products at prices prevalent in the market for that
product
Cost-based transfer prices
◦ The subunit transfers product at its cost plus a margin
Negotiated transfer prices
◦ The subunits agree between themselves the price at which the transfer
should take place
Transfer Price methods
4. Profitability & Transfer Price – an example
Without Transfer Pricing With Transfer Pricing
Profit
Center 1
Profit
Center 2
Company
Profitability
Profit
Center 1
Profit
Center 2
Company
Profitability
Internal Sales 500 800
External Sales 1000 1000 1000 1000
Cost of Goods Sold (500) (500) (500) (500)
COGS on internal
transfers
(500) (800)
Gross Margin 0 500 500 300 200 500
5. SAP transfer price is triggered by transfer of products or services between
profit centers. Hence, Profit Center Accounting should be active
Accounting for Transfer Price is reflected in a “profit center view” in Financial
Ledgers
SAP Material Ledger allows multiple valuation view (group, profit center) of group currency.
The legal view is always in company code currency for legal reporting purposes
Profit Center view is used to reflect additional accounting entries for Transfer Price. That
way, customers can select the appropriate view to fulfill reporting requirements
SAP’s Transfer Price mechanism
Reporting
Company Code
currency
Group Currency
Legal View Legal Y
Group View Group Y
Profit Center view Subunit Y
6. Scenario:
Verity’s Cement
Manufacturing &
Distribution operations
Verity has a
Manufacturing Plant in
Sydney that
manufactures Cement.
The Sydney Plant sources
Clinker from its Brisbane
Plant.
All Verity Cement is
distributed to its
customers in Australia
through its Distribution
Plant in Melbourne.
Clinker (Brisbane)
Cement (Sydney)
Distribution (Melbourne)
7. Traditionally, all products are transferred within its Australian plants at
manufactured cost.
Distribution Depot (Melbourne) V005 books all revenue within its account.
Inventory (standard) cost of Clinker and Cement per TO is as below. L=legal
view, G=group view, P=Profit Center view. All currencies are AUD.
Verity’s current state
Product
V004
Profit Center 1101
V001
Profit Center 1100
V005
Profit Center 1102
1450 (Clinker)
L = 30.37
G = 32.47
P = 30.37
L = 30.37
G = 32.47
P = 32.47
1451 (Cement)
L = 38.61
G = 40.54
P = 40.55
L = 38.61
G = 40.54
P = 48.66
8. Profit Center 1101
V004 Brisbane
134000 Inventory 134000 Inventory
30.27 30.27
Profit Center 1100
V001 Sydney
T Accounts (Current State)
Clinker
Brisbane
transfers
Clinker at cost
to Sydney
Profit Center 1100
V001 Sydney
134000 Inventory 134000 Inventory
38.61 38.61
Profit Center 1102
V005 Melbourne
Cement
Sydney
transfers
Cement at cost
to Melbourne
9. During the last few budget meetings, there has been a heated discussion
between the executives of the three units on how profitability of each of the
three units can be measured independent of the profitability of the company.
The executive of the Sydney operations says he could procure Clinker in the
free market at a price cheaper than what is charged by its Brisbane plant.
Current State - Issues
The Sydney plant does not get any
credit for the cost savings they have
achieved over the last few years
because the cement manufactured by
them is transferred to the distribution
depot at cost.
10. • To improve profitability and competitiveness among its plants, Verity decides to
introduce a Transfer Price mechanism for all its internal transfers.
• Transfers of intermediate products will be made at a fixed pre-determined
price; that is based on the hypothetical procurement cost of that product in the
open market.
Transfers of finished products will be made at a fixed pre-determined
percentage over manufactured cost.
Future State -Transfer Price process
A Transfer Price process would give
the executives of Verity an indication
of the efficiency and competitiveness
of its manufacturing operations vis-à-
vis its competitors.
11. Transfer Prices
Transfer Prices are determined as below.Product Sending Plant Receiving Plant
Transfer
Price
method
Std Cost Transfer Price
Margin over
std cost
1450 (Clinker) V004 (Brisbane) V001 (Sydney)
Market
based
AUD 30.37 AUD 32.47 AUD 2.10
1451 (Cement) V001 (Sydney) V005 (Melbourne) Cost Based AUD 40.55
Std cost + 20% =
AUD 48.66
AUD 8.11
12. GL accounts used for posting
Sending Plant/ Profit Center
134000 Inventory
496000 Change
in Stock
495000 Internal
Revenue
A
D
B
134000 Inventory
497000
Internal COGS
496000 Change
in Stock
Receiving Plant/ Profit Center
A
E
C
Step Description GL Account
GL Account
description
Posting in Plant Expected use
A Inventory (A) 134000 Inventory Sending/ Receiving Inventory posting
B Internal Sale (B) 495000 Internal Revenue Sending Sending Plant’s Internal Revenue
C Internal COGS (C) 497000 Internal COGS Receiving
Receiving Plants cost of purchase; this will be the same as
sending plants internal sale value
D Cost of Sale (D) 496000 Change of Stock Sending
Selling Plants COGS; this is the std cost in Material Master.
Difference of 495000 & 497000 yields the selling plants profit
E Change in Stock (E) 496000 Change in Stock Receiving
Receiving Plants offsetting entry against 497000; same value
as 497000
13. Verity Brisbane (V004) transfers 10 TO of clinker to its Sydney plant (V001)
Stock Transfer of Intermediate Product
14. Inventory Accounts are offset; additional entries are posted for Transfer
prices. This is the “profit center view” of the Accounting document.
Accounting document (Profit Center view)
Notice the additional
accounting entries in
profit center view
15. T Accounts (Profit Center view)
Profit Center 1101
V004 Brisbane
Profit Center 1100
V001 Sydney
134000 Inventory
496000 Change in Stock
495000 Internal Revenue
134000 Inventory
497000 Internal COGS
303.70
303.70
324.70
324.70
324.70
496000 Change in Stock
324.70
Clinker costs Profit Center 1100 (Sydney) AUD
32.47/ TO
Profit Center 1101 (Brisbane) makes a profit of AUD
21.00 on “sale” of Clinker
16. The legal view of the document does not show the Internal Transfer Price Accounting entries
Accounting document (Legal view)
17. Verity Sydney (V001) transfers 10 TO of cement to its Melbourne Distribution
plant (V005)
Stock Transfer of Finished Product
18. Inventory Accounts are offset; additional entries are posted for Transfer
prices. This is the “profit center view” of the Accounting document.
Accounting document (Profit Center view)
Notice the additional
accounting entries in
profit center view
19. Profit Center 1100
V001 Sydney
134000 Inventory
496000 Change in Stock
495000 Internal Revenue
134000 Inventory
497000 Internal COGS
405.50
405.50
486.60
486.60
486.60
496000 Change in Stock
486.60
Profit Center 1102
V004 Melbourne
Cement costs Profit Center 1102 (Melbourne) AUD
48.66/ TO
Profit Center 1100 (Sydney) makes a profit of AUD
81.10 on “sale” of Cement
T Accounts (Profit Center view)
20. The legal view of the document does not show the Internal Transfer Price
entries
Accounting document (Legal view)
21. Brisbane plant reflects a profitability for outbound internal transfer of clinker
to Sydney
Product Profitability (Profit Center view) - Brisbane
22. Sydney plant reflects a profitability for outbound internal transfer of cement
to Melbourne. The profitability for inbound internal transfer of clinker from
Brisbane will reflect when clinker is sold to an external customer; or will
reflect as cost of goods manufactured if it is consumed in production of
cement.
Product Profitability (Profit Center view) - Sydney
23. Melbourne Plant reflects a “profitability” for inbound internal transfer of
cement from Sydney. The profit/ loss will reflect after the cement is eventually
sold to an external customer.
Product Profitability (Profit Center view) - Melbourne
24. Verity provides the vision, and the framework for
a successful Finance process and technology
transformation and re-engineering.
We at Verity believe we have the experience to make success happen for our
clients. This belief comes from our track record of successfully engaging
customers in their pursuit of the best-of-class business solutions. We believe that
this search with Verity is short because of our past experience, and fruitful
because we do not simply deliver an end-result, but strive to deliver value-added
service that earns us the trust and confidence of our customers.
Verity Business Solutions
25. Rajesh is an accomplished and successful Finance professional with over 20
years’ experience in Finance processes and related technologies.
He is a qualified accountant, and he has worked in Finance
departments of multinational companies. With this strong
foundation in Finance, he has managed to successfully
implement best-in-class Finance processes in IT (primarily SAP).
Over the last few years, Rajesh has led Finance teams on large SAP
implementations and provided his insights and experience to provide a workable
and an improved solution for his customers. Rajesh is a SAP Certified Application
Professional.
Presented by Rajesh Shanbhag
26. • Contact us if have any questions, need
clarification.
• For more resources on SAP & Finance,
visit our Resources page on
www.veritysolutions.com.au/resources
Rajesh Shanbhag
W www.veritysolutions.com.au
E rajesh@veritysolutions.com.au
M +61 4 1123 8873
Thank You