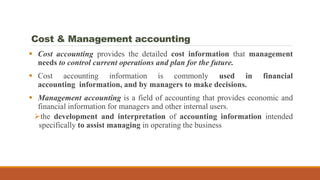
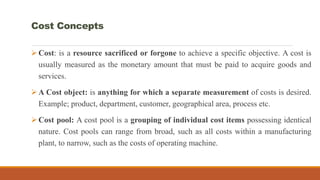
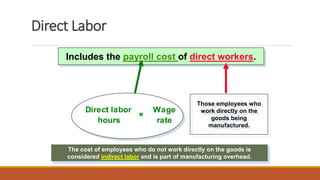
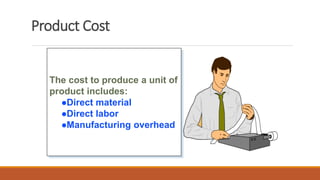
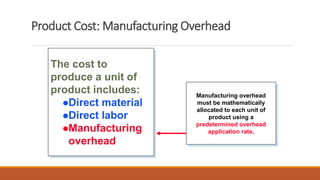
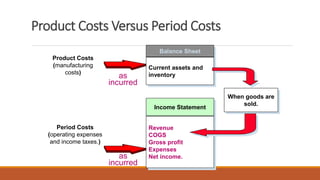
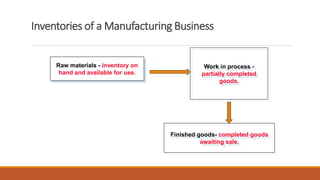
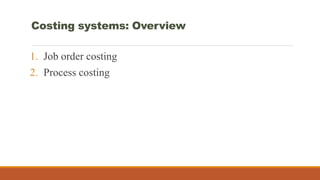
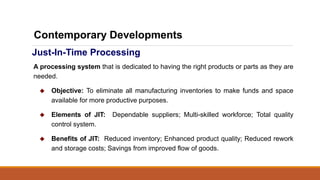
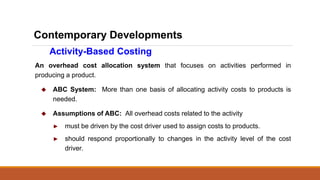
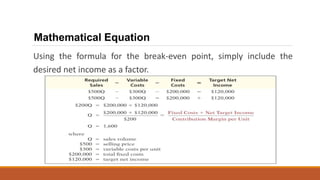
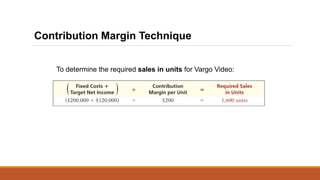
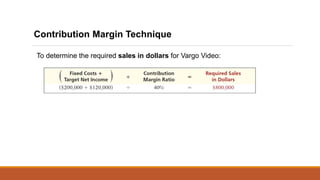
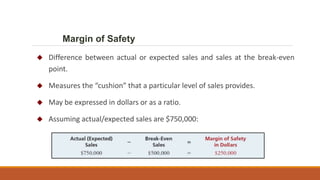
PART THREE
Fikremariam Z.(Ass. Professor)
Managerial Accounting
Cost & Management accounting
 Cost accounting provides the detailed cost information that management
needs to control current operations and plan for the future.
 Cost accounting information is commonly used in financial
accounting information, and by managers to make decisions.
 Management accounting is a field of accounting that provides economic and
financial information for managers and other internal users.
the development and interpretation of accounting information intended
specifically to assist managing in operating the business
Cost concepts and Cost Behavior
Introduction:
 Resources are needed to manufacture products.
 Resources need to be properly managed to enhance profitability of the products or
services considered.
 How much of the resources consumed for each product need to be known.
 That is we need to know:
1. What are the type of resources needed for the product
2. For what purpose resources are used
3. What is the condition of their traceability
Cost Concepts
Cost: is a resource sacrificed or forgone to achieve a specific objective. A cost is
usually measured as the monetary amount that must be paid to acquire goods and
services.
A Cost object: is anything for which a separate measurement of costs is desired.
Example; product, department, customer, geographical area, process etc.
Cost pool: A cost pool is a grouping of individual cost items possessing identical
nature. Cost pools can range from broad, such as all costs within a manufacturing
plant, to narrow, such as the costs of operating machine.
Cost accumulation: is the collection of costs in some organized way by
means of an accounting system, i.e., by some natural or self descriptive
classification.
Eg. material cost, labor cost, fuel, Advertisement cost etc.
Cost assignment: is a general term that includes:
a. Tracing accumulated costs: For direct costs
b. Allocating accumulated costs: For indirect costs
Cost driver is a variable, such as an activity level or volume, the change of
which causally affect costs over a given time span. That is, there is a
specific cause-and-effect relationship between change in level of activity or
volume and change in level of cost.
Cost Concepts
Classification of costs:
Different cost classifications are used to develop cost information for a given
purpose.
Managers use this information to support product and service decisions, enables
cost control, provide historical data for cost management.
Thus, different classification of costs provide different information that helps for
decision making.
1. By natural element: Direct material, Direct labor & MOH
2. By function/operation/purposes:
production(manufacturing); direct materials, direct labor and manufacturing
overhead), and Non manufacturing costs( selling, distribution, administration,
R&D)
3. Based on their traceability to a particular cost object:
Direct: costs that have a relationship with the cost object and can be traced to
that cost object in an economically feasible (cost effective) way. And
Indirect: costs that have a relationship with the cost object but cannot be traced
to that cost object in an economically feasible way.
Classification of costs:
4. Based on their behavior pattern :
Fixed: costs that remain constant regardless of the level of activity up to a certain
relevant range but unit costs vary according to the level of activity.
Variable: costs that changes in direct proportion to changes in the level of activity
but unit costs remain constant.
Semi-variable or semi-fixed (Mixed)
Classification of costs:
5. By control ability:
Controllable : costs that can be influenced by management action
Uncontrollable: cost beyond the control of management.
6. By normality:
Normal: costs incurred in the normal course of activity for producing normal level
of out put under normal circumstances.
Abnormal: costs incurred on account of abnormal conditions or abnormal activity.
Classification of costs:
7. Based on timing they are charged against revenue
Product costs: are costs that are necessary and integral part of producing
(acquiring) the finished product. They are considered as an asset/inventory
when they are incurred. Under the matching principle, these costs do not
become expenses until the finished goods inventory is sold.
Example: Cost of direct material
Period Costs: are costs of income statement other than cost of goods sold. They
are treated as expense of the period in which they are incurred because they are
expected to benefit revenue in the current period.
Example: Advertising costs
Classification of costs:
Cost of goods
sold.
Direct labor and
manufacturing
overhead costs.
Direct
materials
costs.
Steps in the Manufacturing Process:
Convert raw materials
into finished goods.
Sell finished
goods.
Accounting for Manufacturing Operations
Buy raw
materials.
Raw materials &
component parts
that become an
integral part of
finished products.
Can be traced
directly and
conveniently to
products.
Direct Materials
If materials cannot be traced directly to products, the materials are
considered indirect and are part of manufacturing overhead.
Includes the payroll cost of direct workers.
Direct labor
hours
×
Wage
rate
Direct Labor
Those employees who
work directly on the
goods being
manufactured.
The cost of employees who do not work directly on the goods is
considered indirect labor and is part of manufacturing overhead.
The cost to produce a unit of
product includes:
Direct material
Direct labor
Manufacturing overhead
Product Cost
The cost to
produce a unit of
product includes:
Direct material
Direct labor
Manufacturing
overhead
Product Cost: Manufacturing Overhead
Manufacturing overhead
must be mathematically
allocated to each unit of
product using a
predetermined overhead
application rate.
Balance Sheet
Current assets and
inventory
Product Costs
(manufacturing
costs)
Income Statement
Revenue
COGS
Gross profit
Expenses
Net income.
When goods are
sold.
as
incurred
Period Costs
(operating expenses
and income taxes.)
as
incurred
Product Costs Versus Period Costs
Inventories of a Manufacturing Business
Raw materials - inventory on
hand and available for use.
Finished goods- completed goods
awaiting sale.
Work in process -
partially completed
goods.
Costing systems: Overview
1. Job order costing
2. Process costing
Just-In-Time Processing
A processing system that is dedicated to having the right products or parts as they are
needed.
 Objective: To eliminate all manufacturing inventories to make funds and space
available for more productive purposes.
 Elements of JIT: Dependable suppliers; Multi-skilled workforce; Total quality
control system.
 Benefits of JIT: Reduced inventory; Enhanced product quality; Reduced rework
and storage costs; Savings from improved flow of goods.
Contemporary Developments
Activity-Based Costing
An overhead cost allocation system that focuses on activities performed in
producing a product.
 ABC System: More than one basis of allocating activity costs to products is
needed.
 Assumptions of ABC: All overhead costs related to the activity
► must be driven by the cost driver used to assign costs to products.
► should respond proportionally to changes in the activity level of the cost
driver.
Contemporary Developments
Cost-volume-profit (CVP) analysis is the study of the effects of changes in
costs and volume on a company’s profits.
 Important in profit planning.
 Critical factor in management decisions as
► Setting selling prices,
► Determining product mix, and
► Maximizing use of production facilities.
Cost-Volume-Profit Analysis
Basic Components
Basic Components - Assumptions
 Behavior of both costs and revenues is linear throughout the relevant
range of the activity index.
 Costs can be classified accurately as either variable or fixed.
 Changes in activity are the only factors that affect costs.
 All units produced are sold.
 When more than one type of product is sold, the sales mix will remain
constant.
 A statement for internal use.
 Classifies costs and expenses as fixed or variable.
 Reports contribution margin in the body of the statement.
► Contribution margin – amount of revenue remaining after deducting variable costs.
 Reports the same net income as a traditional income
statement.
CVP Income Statement
Illustration: Vargo Video Company produces a high-definition digital
camcorder with 15x optical zoom and a wide-screen, high-resolution
LCD monitor. Relevant data for the camcorders sold by this company
in June 2014 are as follows.
CVP Income Statement
Illustration: The CVP income statement for Vargo Video
therefore would be reported as follows.
 Contribution margin is available to cover fixed costs and to
contribute to income.
 Formula for contribution margin per unit and the computation for
Vargo Video are:
Contribution Margin per Unit
Vargo’s CVP income statement assuming a zero net income.
Contribution Margin per Unit
Assume that Vargo sold one more camcorder, for a total of 1,001 camcorders sold.
Contribution Margin per Unit
 Shows the percentage of each sales dollar available to apply toward
fixed costs and profits.
 Formula for contribution margin ratio and the computation for
Vargo Video are:
Contribution Margin Ratio
Assume Vargo Video’s current sales are $500,000 and it wants to know
the effect of a $100,000 (200-unit) increase in sales.
Contribution Margin Ratio
 Process of finding the break-even point level of activity at which
total revenues equal total costs (both fixed and variable).
 Can be computed or derived
► From a mathematical equation,
► By using contribution margin, or
► From a cost-volume profit (CVP) graph.
 Expressed either in sales units or in sales dollars.
Break-Even Analysis
Computation of
break-even
point in units.
Mathematical Equation
Break-even occurs where total sales equal variable costs plus fixed costs; i.e., net
income is zero
 At the break-even point, contribution margin must
equal total fixed costs
(CM = total revenues – variable costs)
 Break-even point can be computed using either
contribution margin per unit or contribution margin
ratio.
Contribution Margin Technique
 When the break-even-point in units is desired, contribution
margin per unit is used in the following formula which shows
the computation for Vargo Video:
Contribution Margin in Units
 When the break-even-point in dollars is desired, contribution
margin ratio is used in the following formula which shows the
computation for Vargo Video:
Contribution Margin Ratio
Because this graph also
shows costs, volume,
and profits, it is
referred to as a cost-
volume-profit (CVP)
graph.
Graphic
Presentation
 Level of sales necessary to achieve a specified income.
 Can be determined from each of the approaches used to
determine break-even sales/units:
► from a mathematical equation,
► by using contribution margin technique, or
► from a cost-volume profit (CVP) graph.
 Expressed either in sales units or in sales dollars.
Target Net Income
Mathematical Equation
Formula for required sales to meet target net income.
Using the formula for the break-even point, simply include the
desired net income as a factor.
Mathematical Equation
To determine the required sales in units for Vargo Video:
Contribution Margin Technique
To determine the required sales in dollars for Vargo Video:
Contribution Margin Technique
 Difference between actual or expected sales and sales at the break-even
point.
 Measures the “cushion” that a particular level of sales provides.
 May be expressed in dollars or as a ratio.
 Assuming actual/expected sales are $750,000:
Margin of Safety
 Computed by dividing the margin of safety in dollars by the actual (or expected)
sales.
 Assuming actual/expected sales are $750,000:
 The higher the dollars or percentage, the greater the margin of safety.
Margin of Safety
Decision Making
 Decision-making is a fundamental part of management.
 Managers are constantly faced with problems of deciding what
product to sell, what production method to use, whether to make
or buy component parts, what prices to charge, what channels of
distribution to use, whether to accept special orders at special
prices, and so forth.
 This section covers the role of management accounting information
in a variety of marketing and production decisions.
9/20/2022
9/20/2022
9/20/2022
9/20/2022
9/20/2022
9/20/2022
9/20/2022
9/20/2022
9/20/2022
9/20/2022
9/20/2022
9/20/2022
9/20/2022
9/20/2022
9/20/2022
9/20/2022
9/20/2022
9/20/2022
9/20/2022
9/20/2022
9/20/2022
9/20/2022
9/20/2022
9/20/2022
9/20/2022
9/20/2022
9/20/2022
9/20/2022
9/20/2022
9/20/2022
9/20/2022
9/20/2022
9/20/2022
9/20/2022
9/20/2022
9/20/2022
9/20/2022
9/20/2022
9/20/2022
9/20/2022
9/20/2022
9/20/2022
9/20/2022
9/20/2022
End of Part Three

Part III-Managerial Accounting.pptx

  • 1.
    PART THREE Fikremariam Z.(Ass.Professor) Managerial Accounting
  • 2.
    Cost & Managementaccounting  Cost accounting provides the detailed cost information that management needs to control current operations and plan for the future.  Cost accounting information is commonly used in financial accounting information, and by managers to make decisions.  Management accounting is a field of accounting that provides economic and financial information for managers and other internal users. the development and interpretation of accounting information intended specifically to assist managing in operating the business
  • 3.
    Cost concepts andCost Behavior Introduction:  Resources are needed to manufacture products.  Resources need to be properly managed to enhance profitability of the products or services considered.  How much of the resources consumed for each product need to be known.  That is we need to know: 1. What are the type of resources needed for the product 2. For what purpose resources are used 3. What is the condition of their traceability
  • 4.
    Cost Concepts Cost: isa resource sacrificed or forgone to achieve a specific objective. A cost is usually measured as the monetary amount that must be paid to acquire goods and services. A Cost object: is anything for which a separate measurement of costs is desired. Example; product, department, customer, geographical area, process etc. Cost pool: A cost pool is a grouping of individual cost items possessing identical nature. Cost pools can range from broad, such as all costs within a manufacturing plant, to narrow, such as the costs of operating machine.
  • 5.
    Cost accumulation: isthe collection of costs in some organized way by means of an accounting system, i.e., by some natural or self descriptive classification. Eg. material cost, labor cost, fuel, Advertisement cost etc. Cost assignment: is a general term that includes: a. Tracing accumulated costs: For direct costs b. Allocating accumulated costs: For indirect costs Cost driver is a variable, such as an activity level or volume, the change of which causally affect costs over a given time span. That is, there is a specific cause-and-effect relationship between change in level of activity or volume and change in level of cost. Cost Concepts
  • 6.
    Classification of costs: Differentcost classifications are used to develop cost information for a given purpose. Managers use this information to support product and service decisions, enables cost control, provide historical data for cost management. Thus, different classification of costs provide different information that helps for decision making. 1. By natural element: Direct material, Direct labor & MOH
  • 7.
    2. By function/operation/purposes: production(manufacturing);direct materials, direct labor and manufacturing overhead), and Non manufacturing costs( selling, distribution, administration, R&D) 3. Based on their traceability to a particular cost object: Direct: costs that have a relationship with the cost object and can be traced to that cost object in an economically feasible (cost effective) way. And Indirect: costs that have a relationship with the cost object but cannot be traced to that cost object in an economically feasible way. Classification of costs:
  • 8.
    4. Based ontheir behavior pattern : Fixed: costs that remain constant regardless of the level of activity up to a certain relevant range but unit costs vary according to the level of activity. Variable: costs that changes in direct proportion to changes in the level of activity but unit costs remain constant. Semi-variable or semi-fixed (Mixed) Classification of costs:
  • 9.
    5. By controlability: Controllable : costs that can be influenced by management action Uncontrollable: cost beyond the control of management. 6. By normality: Normal: costs incurred in the normal course of activity for producing normal level of out put under normal circumstances. Abnormal: costs incurred on account of abnormal conditions or abnormal activity. Classification of costs:
  • 10.
    7. Based ontiming they are charged against revenue Product costs: are costs that are necessary and integral part of producing (acquiring) the finished product. They are considered as an asset/inventory when they are incurred. Under the matching principle, these costs do not become expenses until the finished goods inventory is sold. Example: Cost of direct material Period Costs: are costs of income statement other than cost of goods sold. They are treated as expense of the period in which they are incurred because they are expected to benefit revenue in the current period. Example: Advertising costs Classification of costs:
  • 11.
    Cost of goods sold. Directlabor and manufacturing overhead costs. Direct materials costs. Steps in the Manufacturing Process: Convert raw materials into finished goods. Sell finished goods. Accounting for Manufacturing Operations Buy raw materials.
  • 12.
    Raw materials & componentparts that become an integral part of finished products. Can be traced directly and conveniently to products. Direct Materials If materials cannot be traced directly to products, the materials are considered indirect and are part of manufacturing overhead.
  • 13.
    Includes the payrollcost of direct workers. Direct labor hours × Wage rate Direct Labor Those employees who work directly on the goods being manufactured. The cost of employees who do not work directly on the goods is considered indirect labor and is part of manufacturing overhead.
  • 14.
    The cost toproduce a unit of product includes: Direct material Direct labor Manufacturing overhead Product Cost
  • 15.
    The cost to producea unit of product includes: Direct material Direct labor Manufacturing overhead Product Cost: Manufacturing Overhead Manufacturing overhead must be mathematically allocated to each unit of product using a predetermined overhead application rate.
  • 16.
    Balance Sheet Current assetsand inventory Product Costs (manufacturing costs) Income Statement Revenue COGS Gross profit Expenses Net income. When goods are sold. as incurred Period Costs (operating expenses and income taxes.) as incurred Product Costs Versus Period Costs
  • 17.
    Inventories of aManufacturing Business Raw materials - inventory on hand and available for use. Finished goods- completed goods awaiting sale. Work in process - partially completed goods.
  • 18.
    Costing systems: Overview 1.Job order costing 2. Process costing
  • 19.
    Just-In-Time Processing A processingsystem that is dedicated to having the right products or parts as they are needed.  Objective: To eliminate all manufacturing inventories to make funds and space available for more productive purposes.  Elements of JIT: Dependable suppliers; Multi-skilled workforce; Total quality control system.  Benefits of JIT: Reduced inventory; Enhanced product quality; Reduced rework and storage costs; Savings from improved flow of goods. Contemporary Developments
  • 20.
    Activity-Based Costing An overheadcost allocation system that focuses on activities performed in producing a product.  ABC System: More than one basis of allocating activity costs to products is needed.  Assumptions of ABC: All overhead costs related to the activity ► must be driven by the cost driver used to assign costs to products. ► should respond proportionally to changes in the activity level of the cost driver. Contemporary Developments
  • 21.
    Cost-volume-profit (CVP) analysisis the study of the effects of changes in costs and volume on a company’s profits.  Important in profit planning.  Critical factor in management decisions as ► Setting selling prices, ► Determining product mix, and ► Maximizing use of production facilities. Cost-Volume-Profit Analysis
  • 22.
  • 23.
    Basic Components -Assumptions  Behavior of both costs and revenues is linear throughout the relevant range of the activity index.  Costs can be classified accurately as either variable or fixed.  Changes in activity are the only factors that affect costs.  All units produced are sold.  When more than one type of product is sold, the sales mix will remain constant.
  • 24.
     A statementfor internal use.  Classifies costs and expenses as fixed or variable.  Reports contribution margin in the body of the statement. ► Contribution margin – amount of revenue remaining after deducting variable costs.  Reports the same net income as a traditional income statement. CVP Income Statement
  • 25.
    Illustration: Vargo VideoCompany produces a high-definition digital camcorder with 15x optical zoom and a wide-screen, high-resolution LCD monitor. Relevant data for the camcorders sold by this company in June 2014 are as follows. CVP Income Statement
  • 26.
    CVP Income Statement Illustration:The CVP income statement for Vargo Video therefore would be reported as follows.
  • 27.
     Contribution marginis available to cover fixed costs and to contribute to income.  Formula for contribution margin per unit and the computation for Vargo Video are: Contribution Margin per Unit
  • 28.
    Vargo’s CVP incomestatement assuming a zero net income. Contribution Margin per Unit
  • 29.
    Assume that Vargosold one more camcorder, for a total of 1,001 camcorders sold. Contribution Margin per Unit
  • 30.
     Shows thepercentage of each sales dollar available to apply toward fixed costs and profits.  Formula for contribution margin ratio and the computation for Vargo Video are: Contribution Margin Ratio
  • 31.
  • 32.
    Assume Vargo Video’scurrent sales are $500,000 and it wants to know the effect of a $100,000 (200-unit) increase in sales. Contribution Margin Ratio
  • 33.
     Process offinding the break-even point level of activity at which total revenues equal total costs (both fixed and variable).  Can be computed or derived ► From a mathematical equation, ► By using contribution margin, or ► From a cost-volume profit (CVP) graph.  Expressed either in sales units or in sales dollars. Break-Even Analysis
  • 34.
    Computation of break-even point inunits. Mathematical Equation Break-even occurs where total sales equal variable costs plus fixed costs; i.e., net income is zero
  • 35.
     At thebreak-even point, contribution margin must equal total fixed costs (CM = total revenues – variable costs)  Break-even point can be computed using either contribution margin per unit or contribution margin ratio. Contribution Margin Technique
  • 36.
     When thebreak-even-point in units is desired, contribution margin per unit is used in the following formula which shows the computation for Vargo Video: Contribution Margin in Units
  • 37.
     When thebreak-even-point in dollars is desired, contribution margin ratio is used in the following formula which shows the computation for Vargo Video: Contribution Margin Ratio
  • 38.
    Because this graphalso shows costs, volume, and profits, it is referred to as a cost- volume-profit (CVP) graph. Graphic Presentation
  • 39.
     Level ofsales necessary to achieve a specified income.  Can be determined from each of the approaches used to determine break-even sales/units: ► from a mathematical equation, ► by using contribution margin technique, or ► from a cost-volume profit (CVP) graph.  Expressed either in sales units or in sales dollars. Target Net Income
  • 40.
    Mathematical Equation Formula forrequired sales to meet target net income.
  • 41.
    Using the formulafor the break-even point, simply include the desired net income as a factor. Mathematical Equation
  • 42.
    To determine therequired sales in units for Vargo Video: Contribution Margin Technique
  • 43.
    To determine therequired sales in dollars for Vargo Video: Contribution Margin Technique
  • 44.
     Difference betweenactual or expected sales and sales at the break-even point.  Measures the “cushion” that a particular level of sales provides.  May be expressed in dollars or as a ratio.  Assuming actual/expected sales are $750,000: Margin of Safety
  • 45.
     Computed bydividing the margin of safety in dollars by the actual (or expected) sales.  Assuming actual/expected sales are $750,000:  The higher the dollars or percentage, the greater the margin of safety. Margin of Safety
  • 46.
    Decision Making  Decision-makingis a fundamental part of management.  Managers are constantly faced with problems of deciding what product to sell, what production method to use, whether to make or buy component parts, what prices to charge, what channels of distribution to use, whether to accept special orders at special prices, and so forth.  This section covers the role of management accounting information in a variety of marketing and production decisions.
  • 47.
  • 48.
  • 49.
  • 50.
  • 51.
  • 52.
  • 53.
  • 54.
  • 55.
  • 56.
  • 57.
  • 58.
  • 59.
  • 60.
  • 61.
  • 62.
  • 63.
  • 64.
  • 65.
  • 66.
  • 67.
  • 68.
  • 69.
  • 70.
  • 71.
  • 72.
  • 73.
  • 74.
  • 75.
  • 76.
  • 77.
  • 78.
  • 79.
  • 80.
  • 81.
  • 82.
  • 83.
  • 84.
  • 85.
  • 86.
  • 87.
  • 88.
  • 89.
  • 90.
  • 91.