Download as PDF, PPTX
![f
f
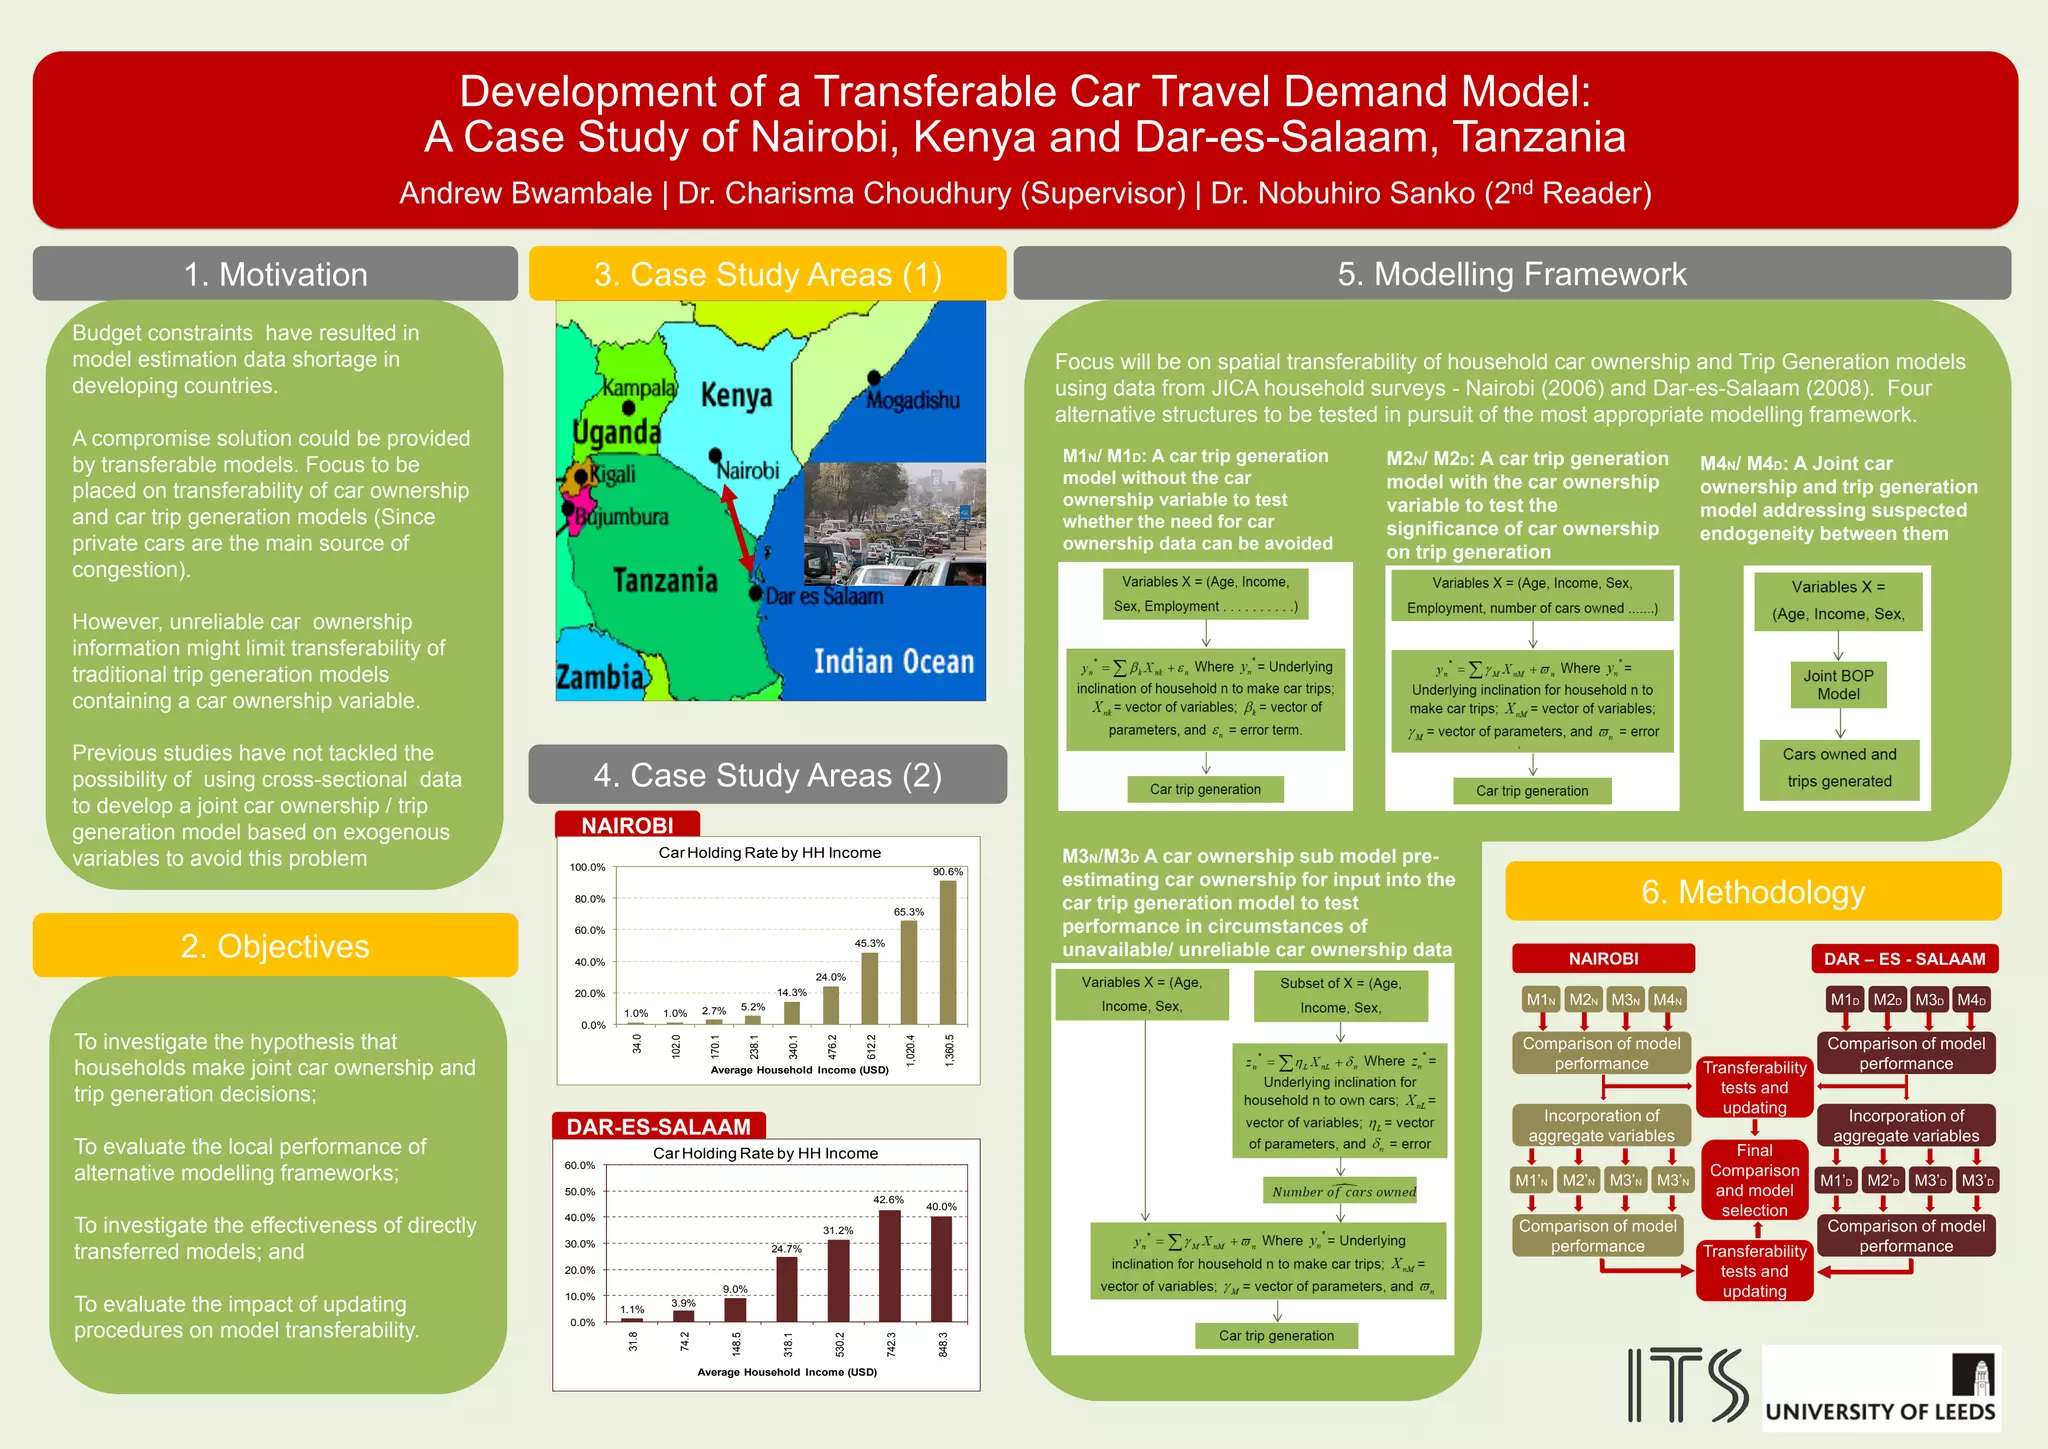
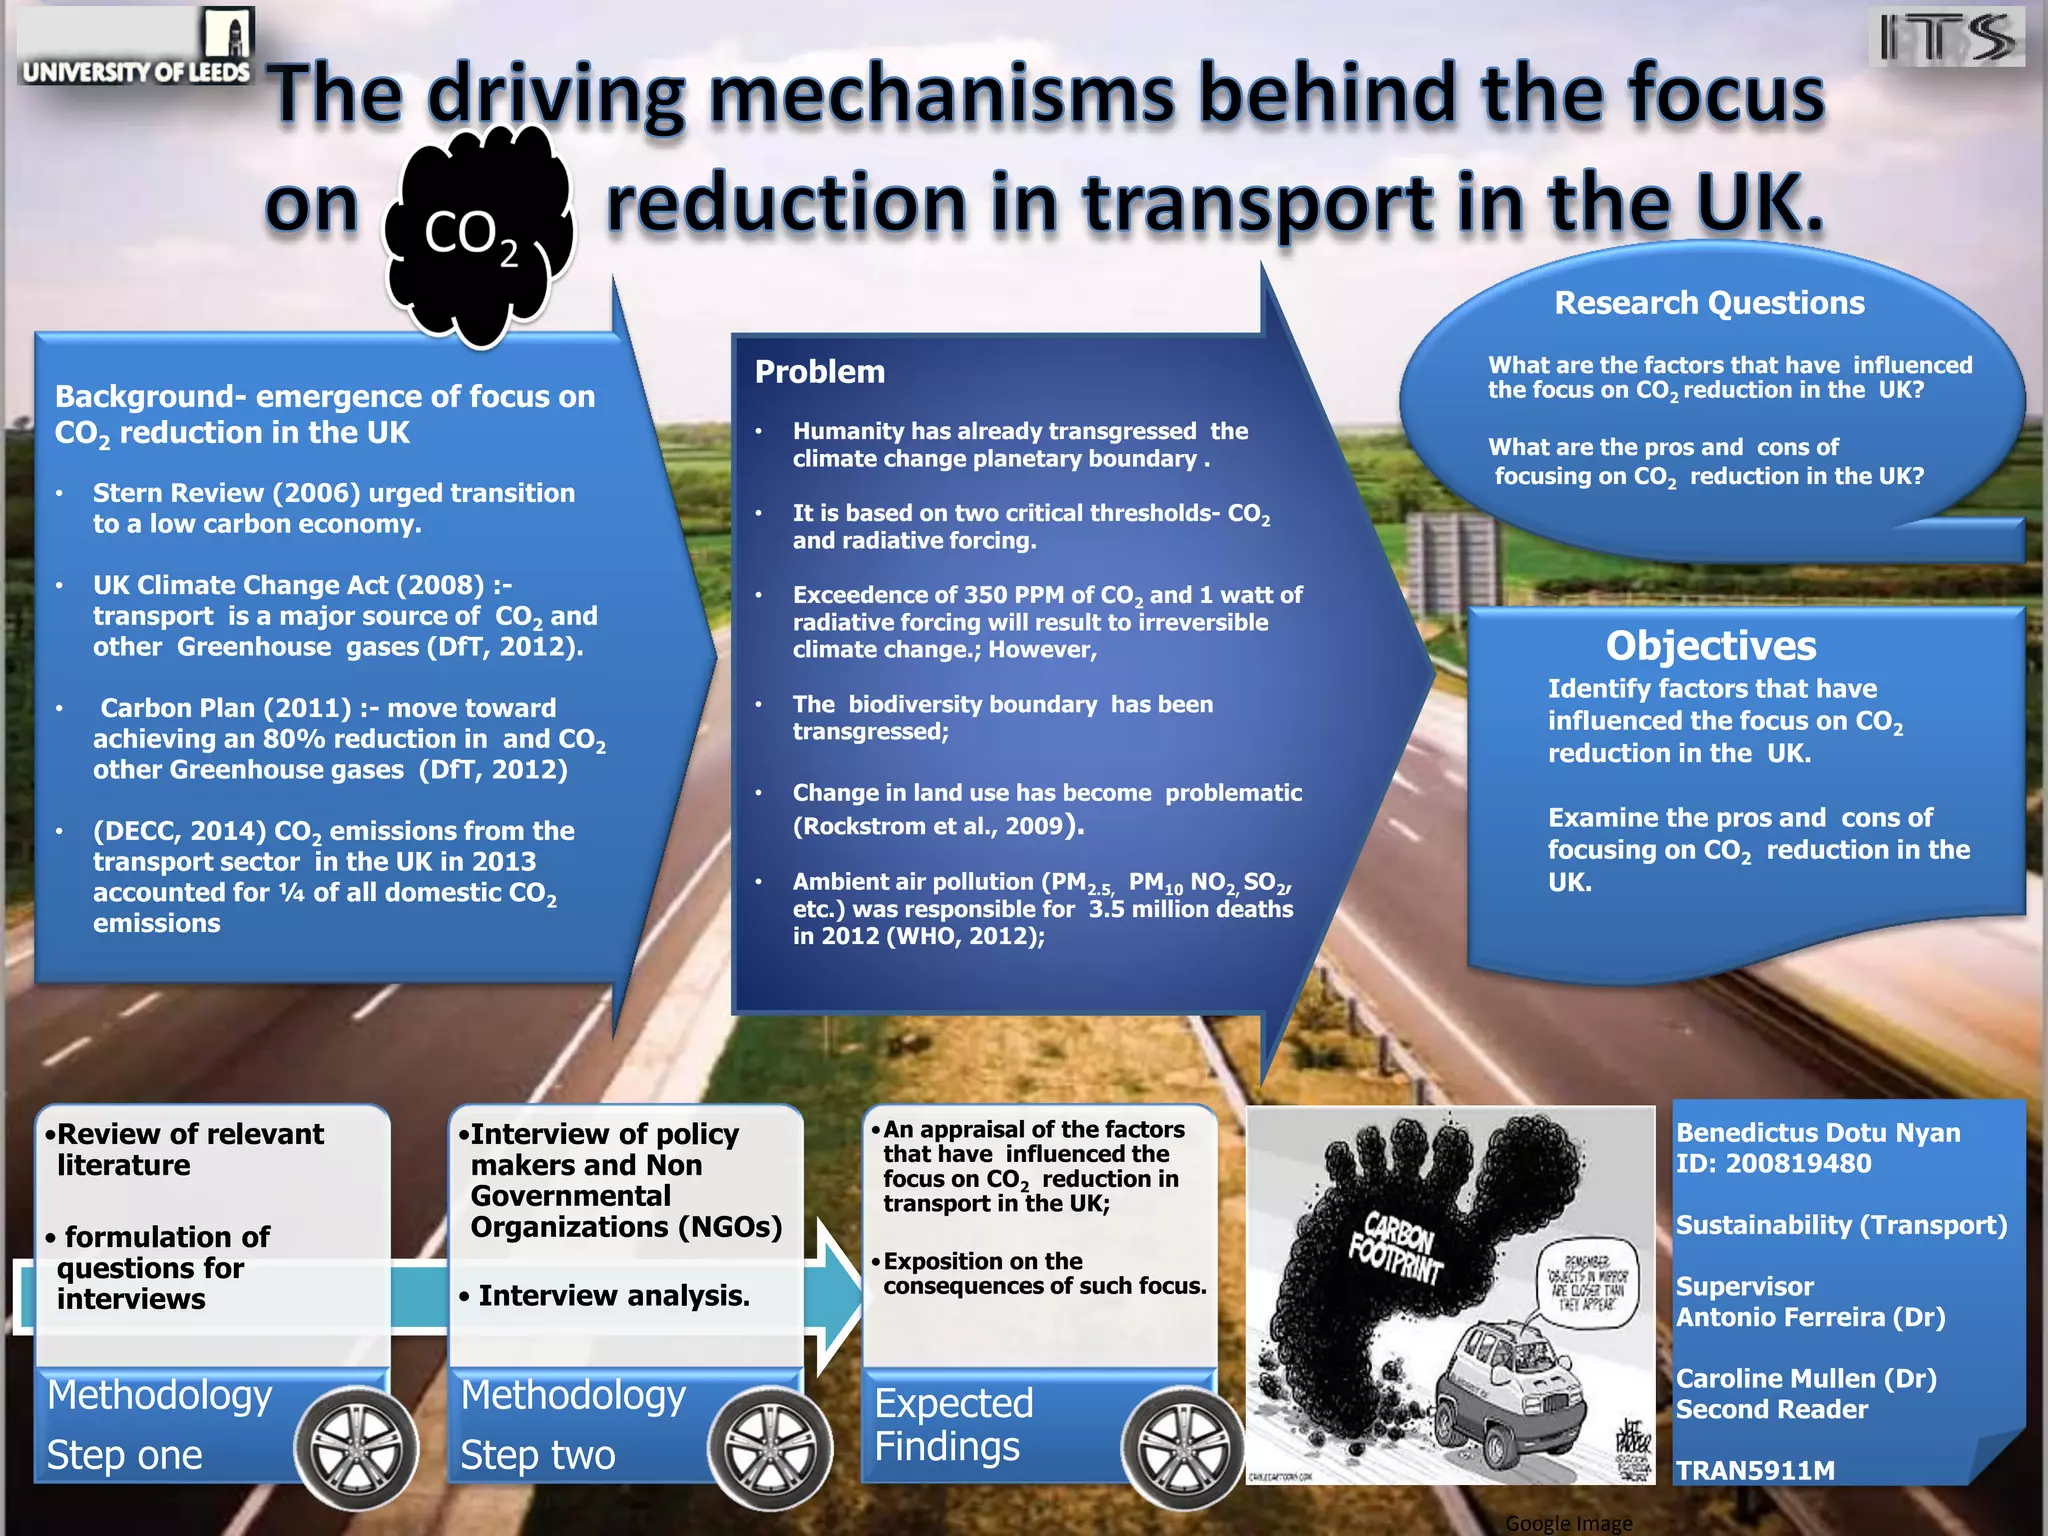
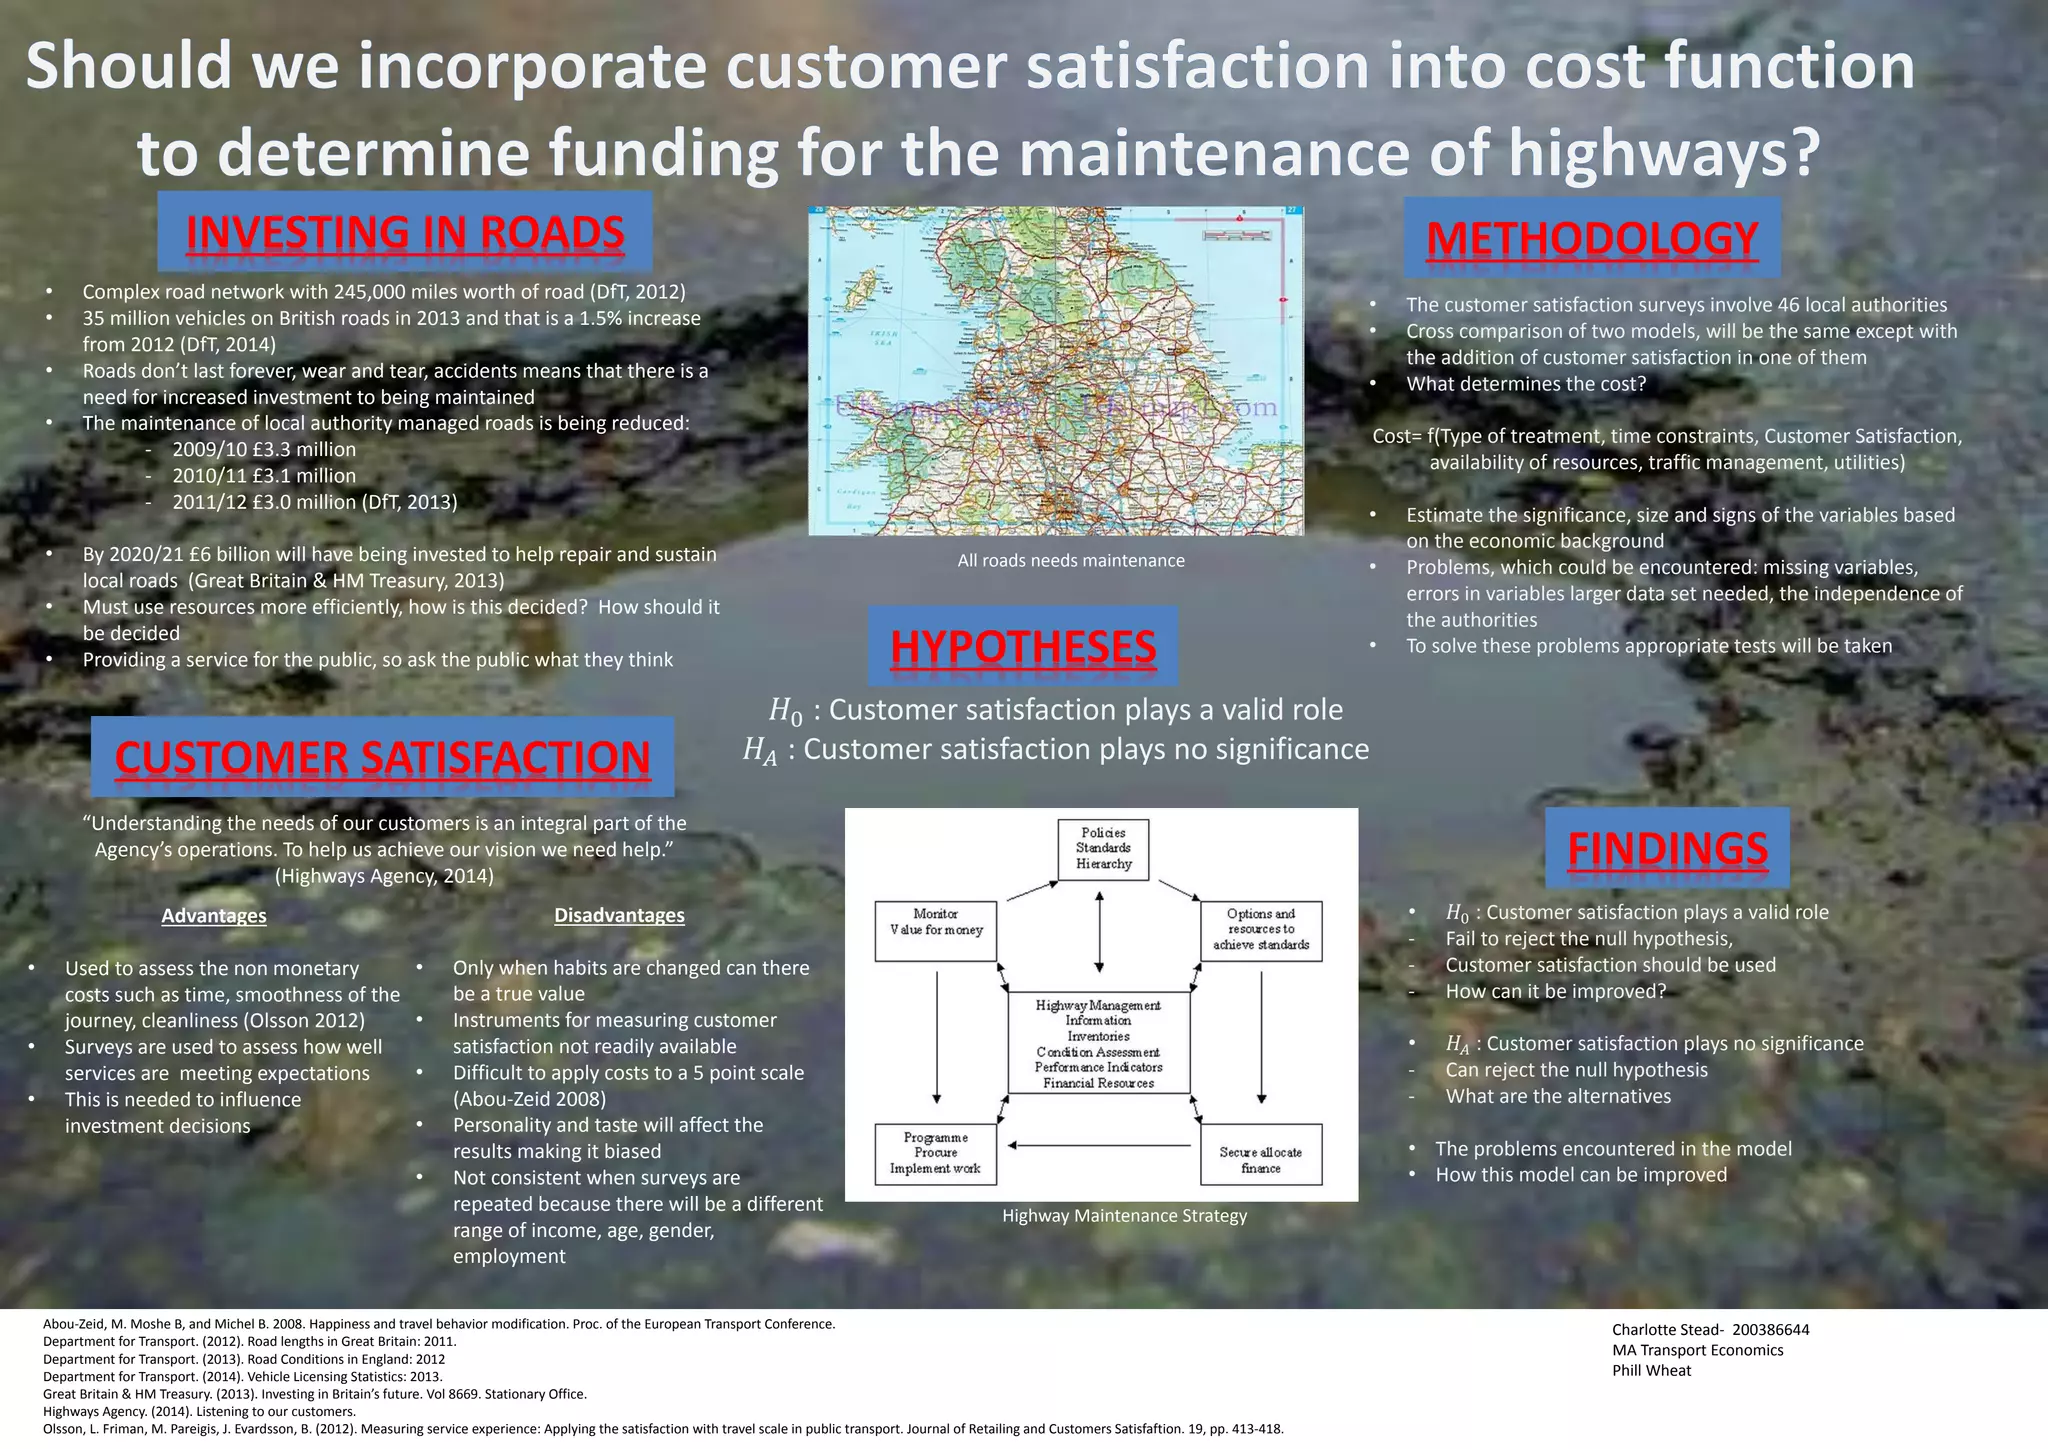
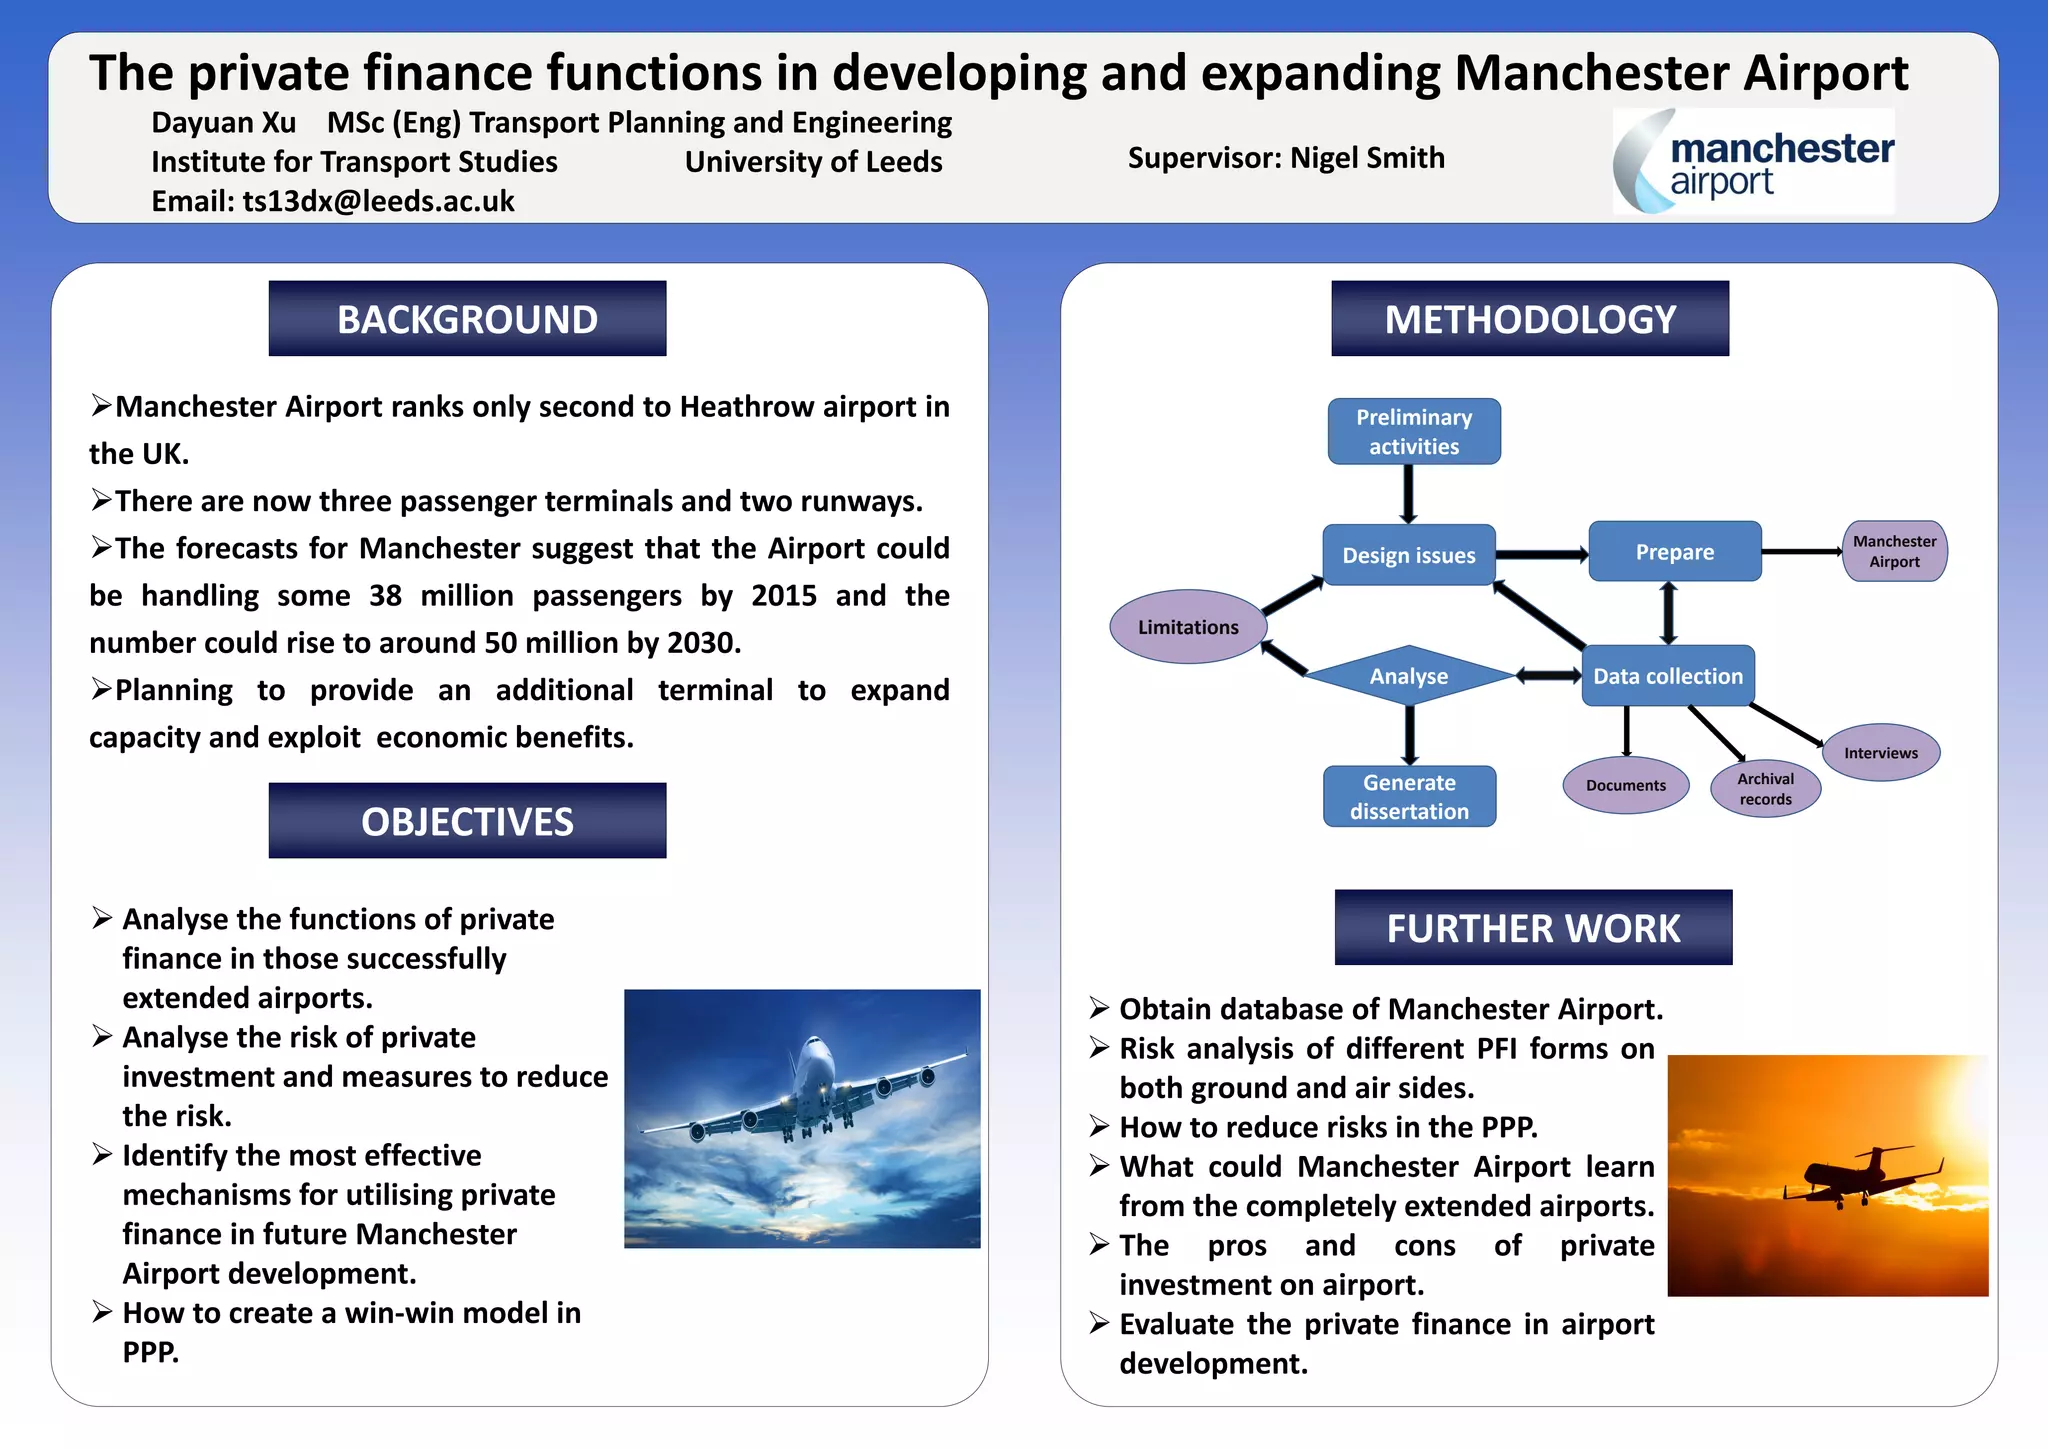
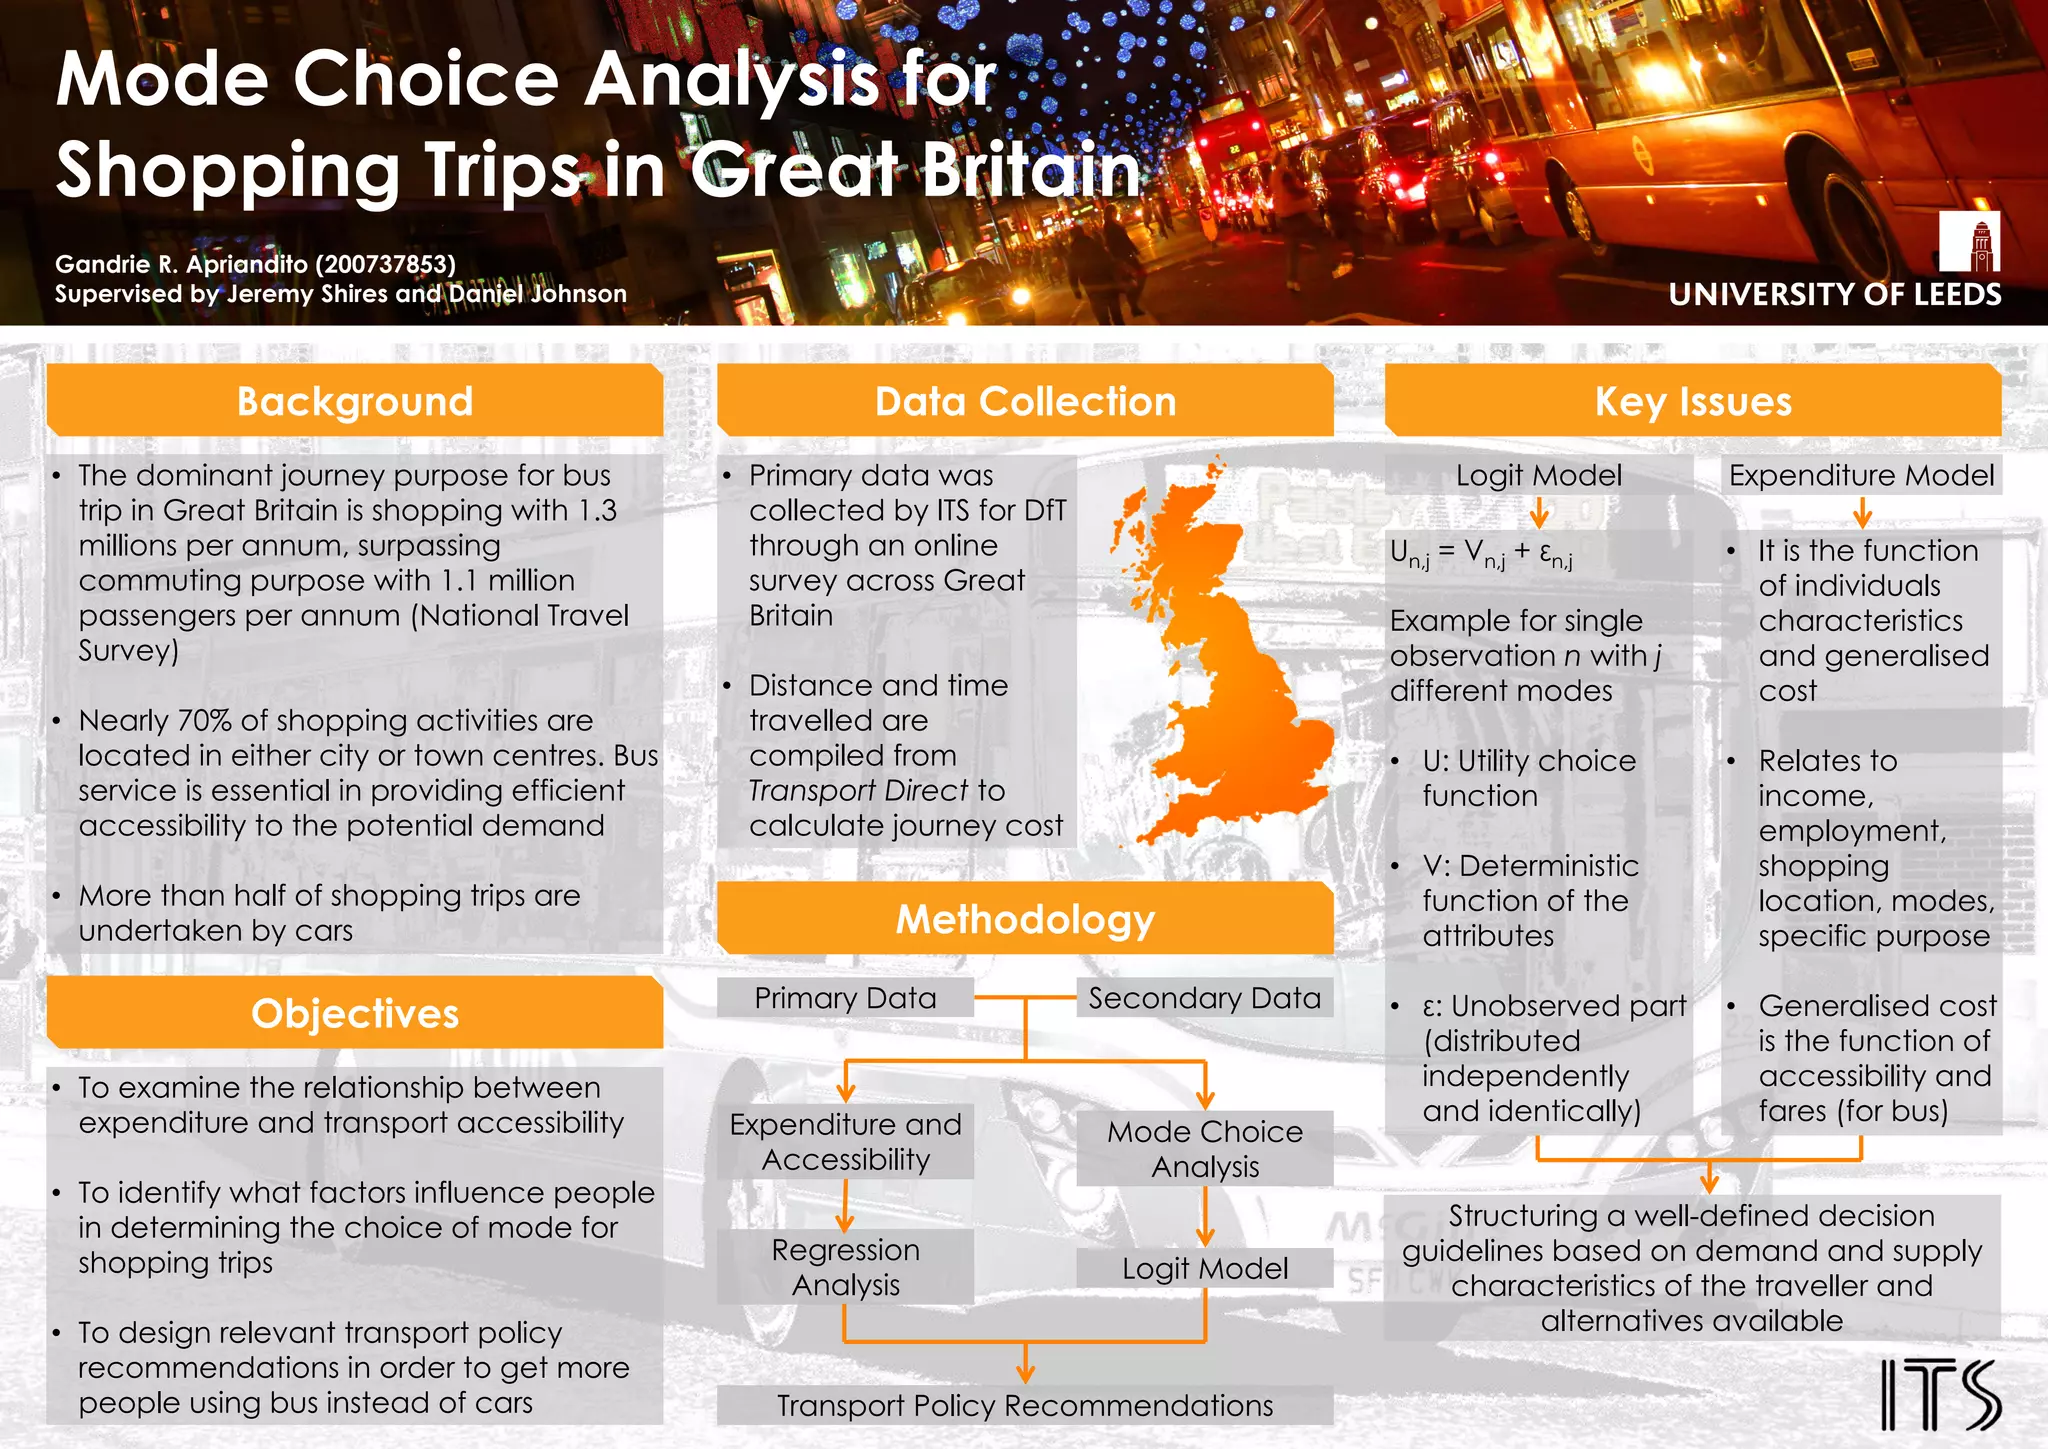
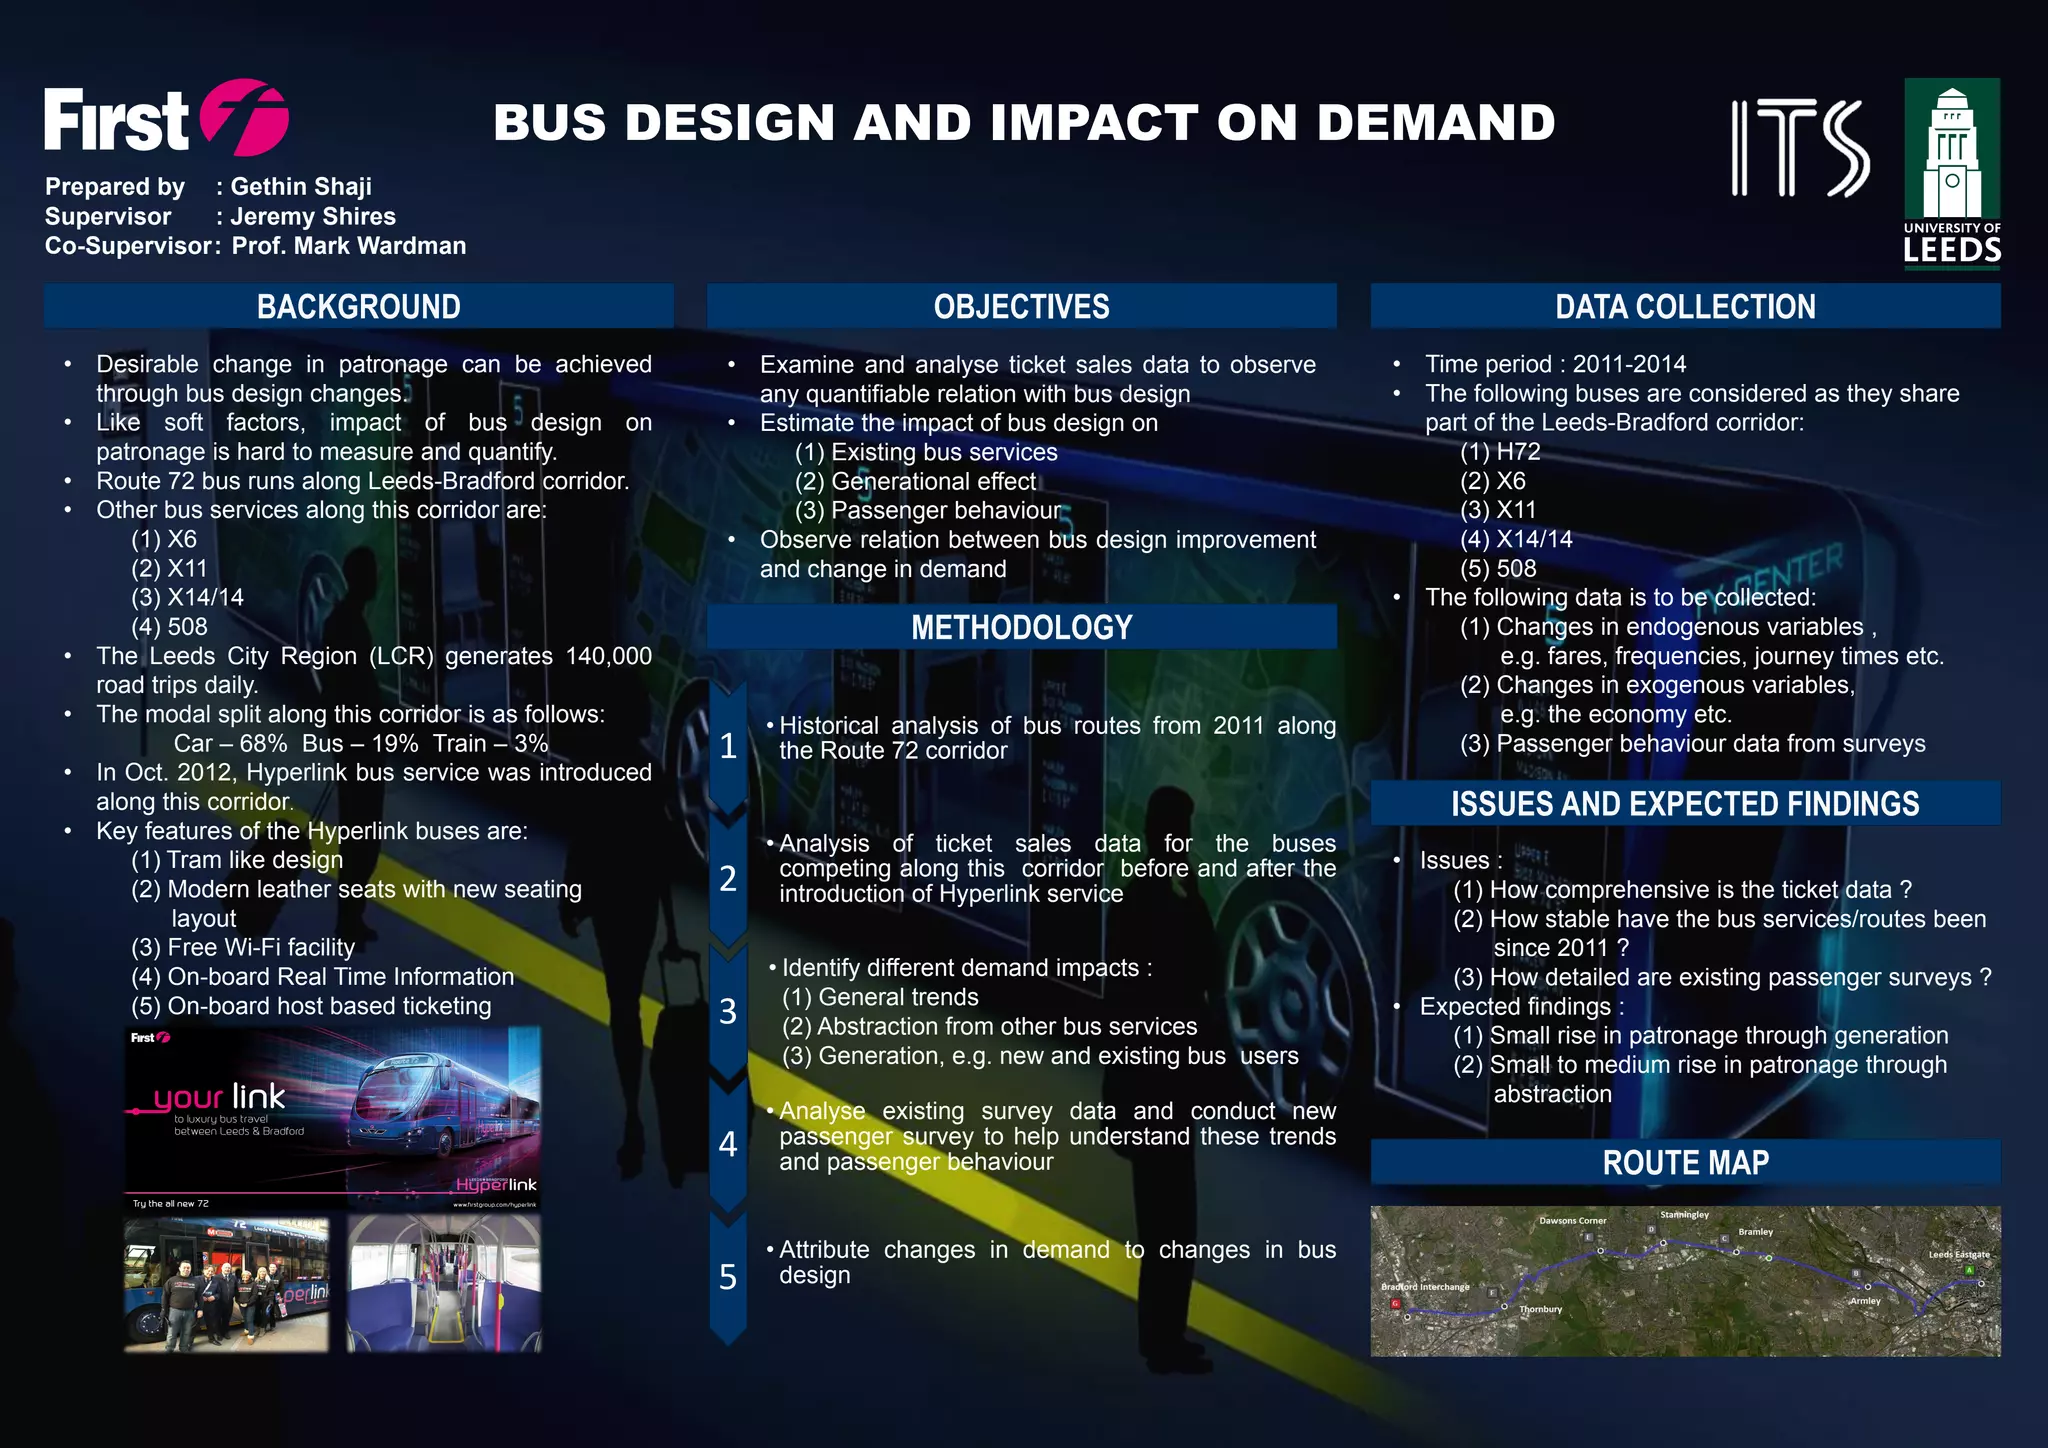
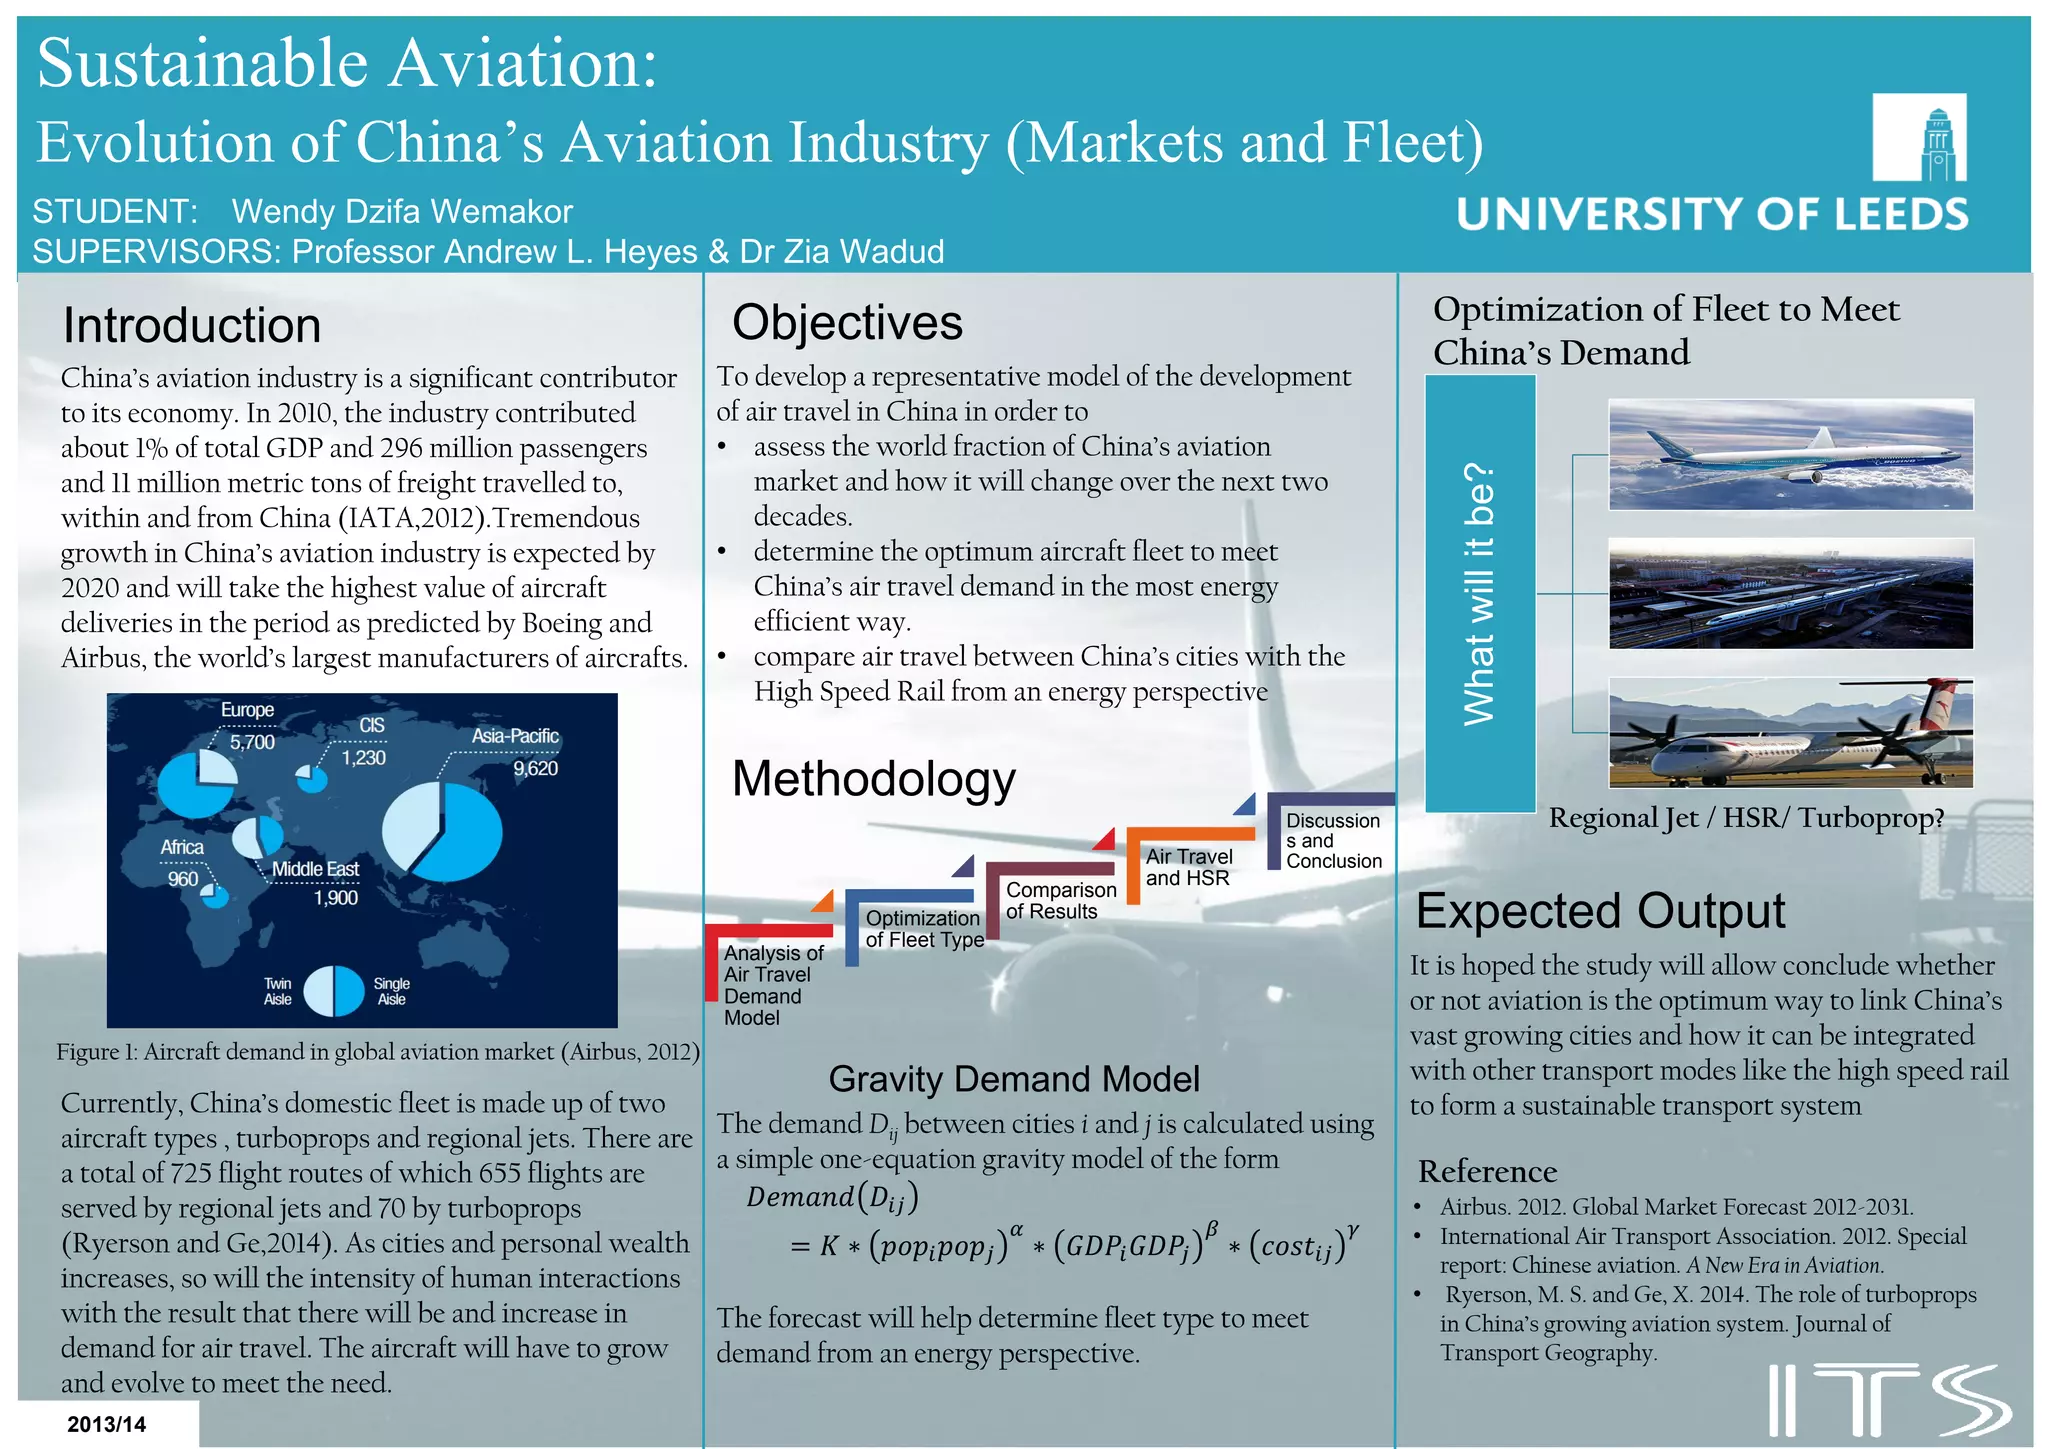
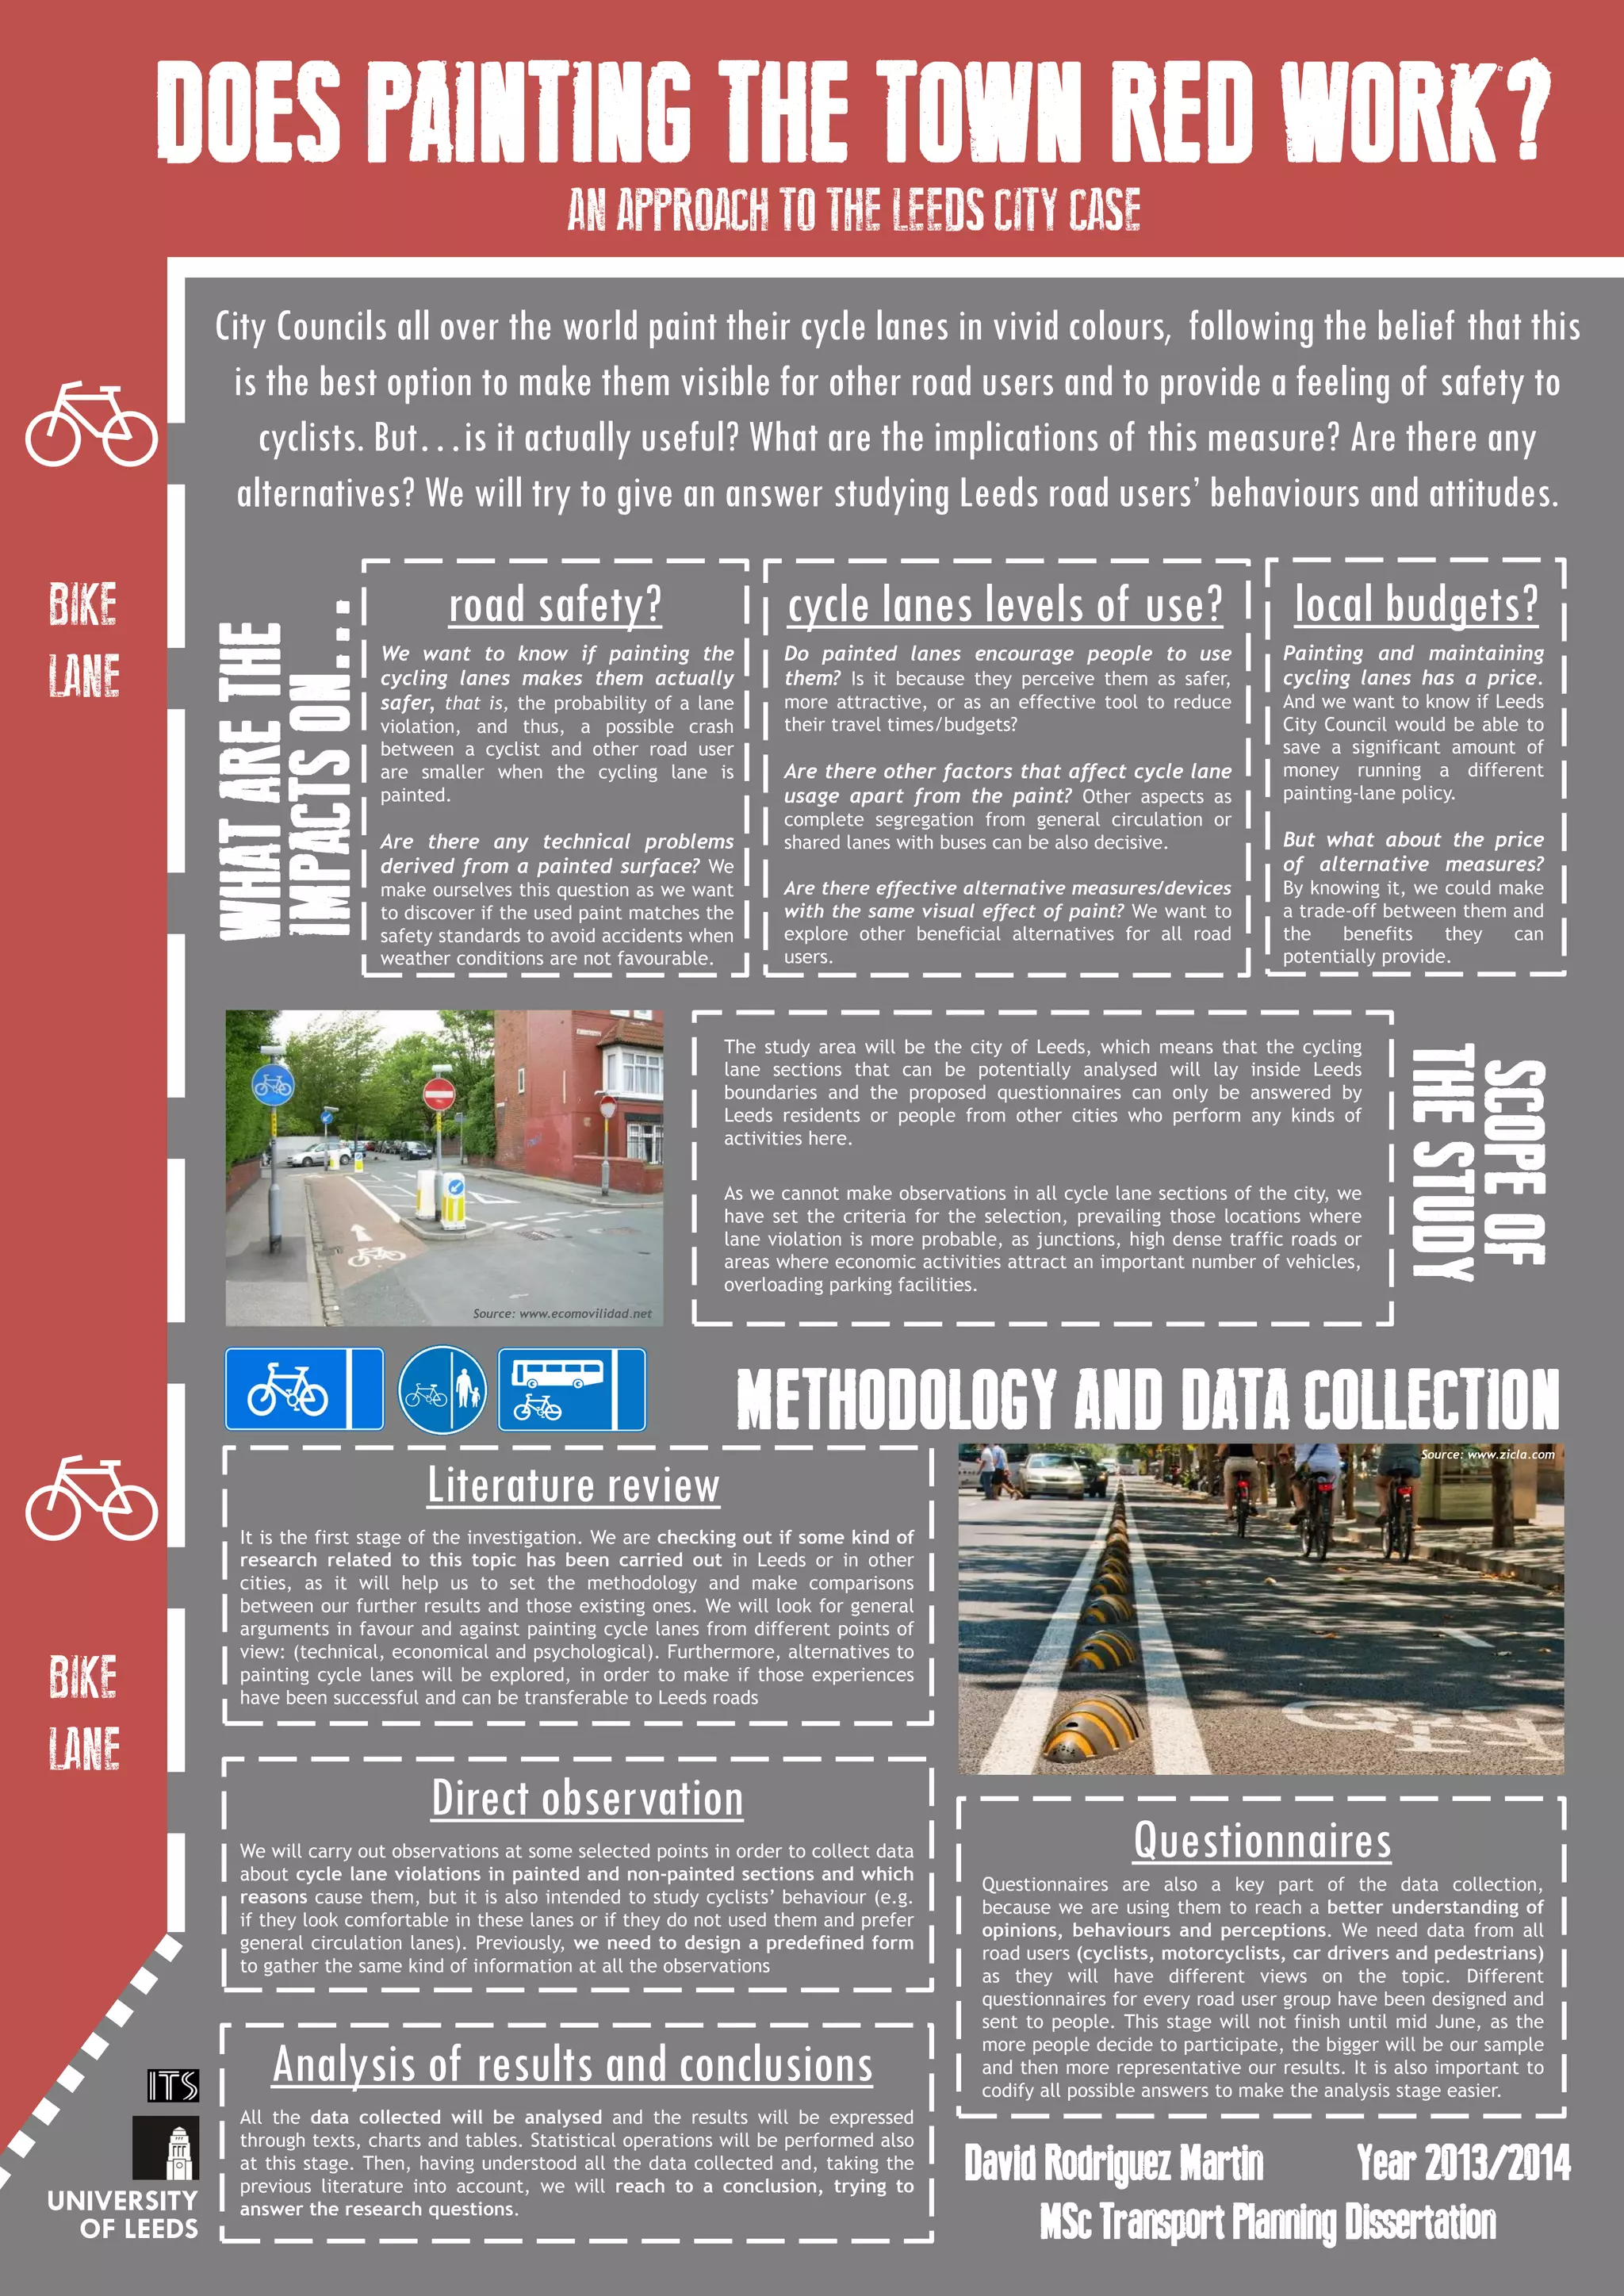
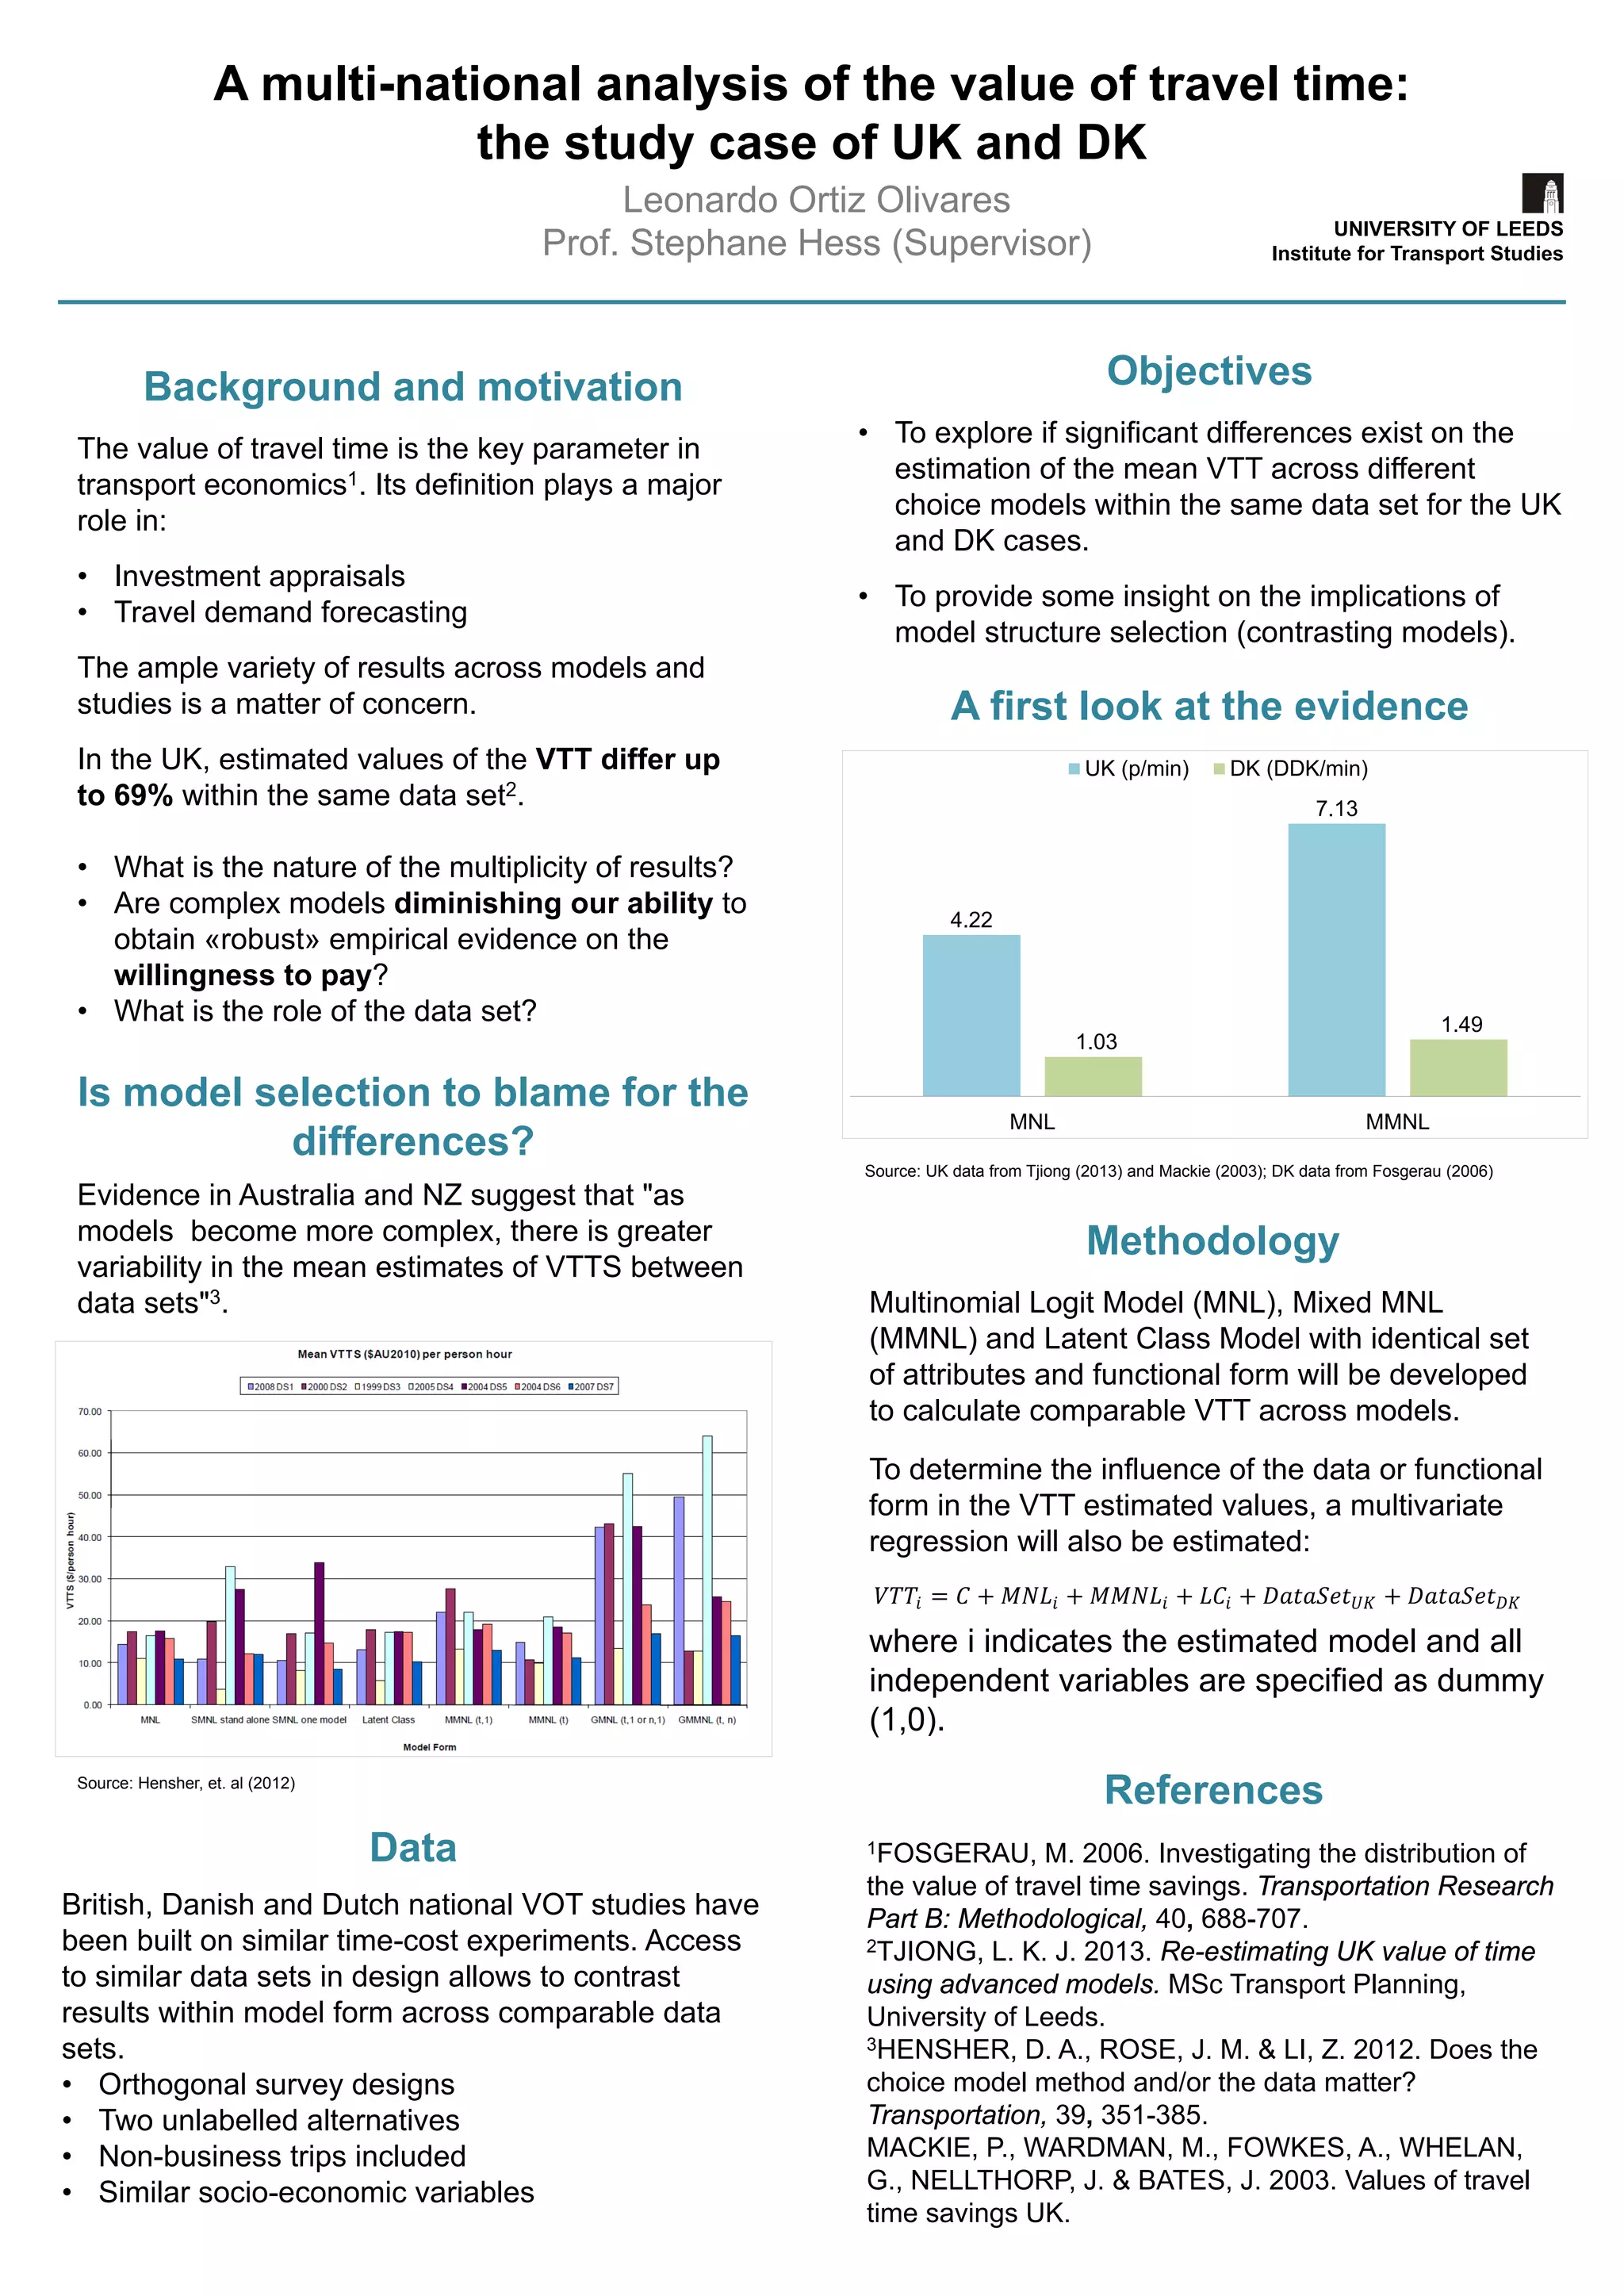
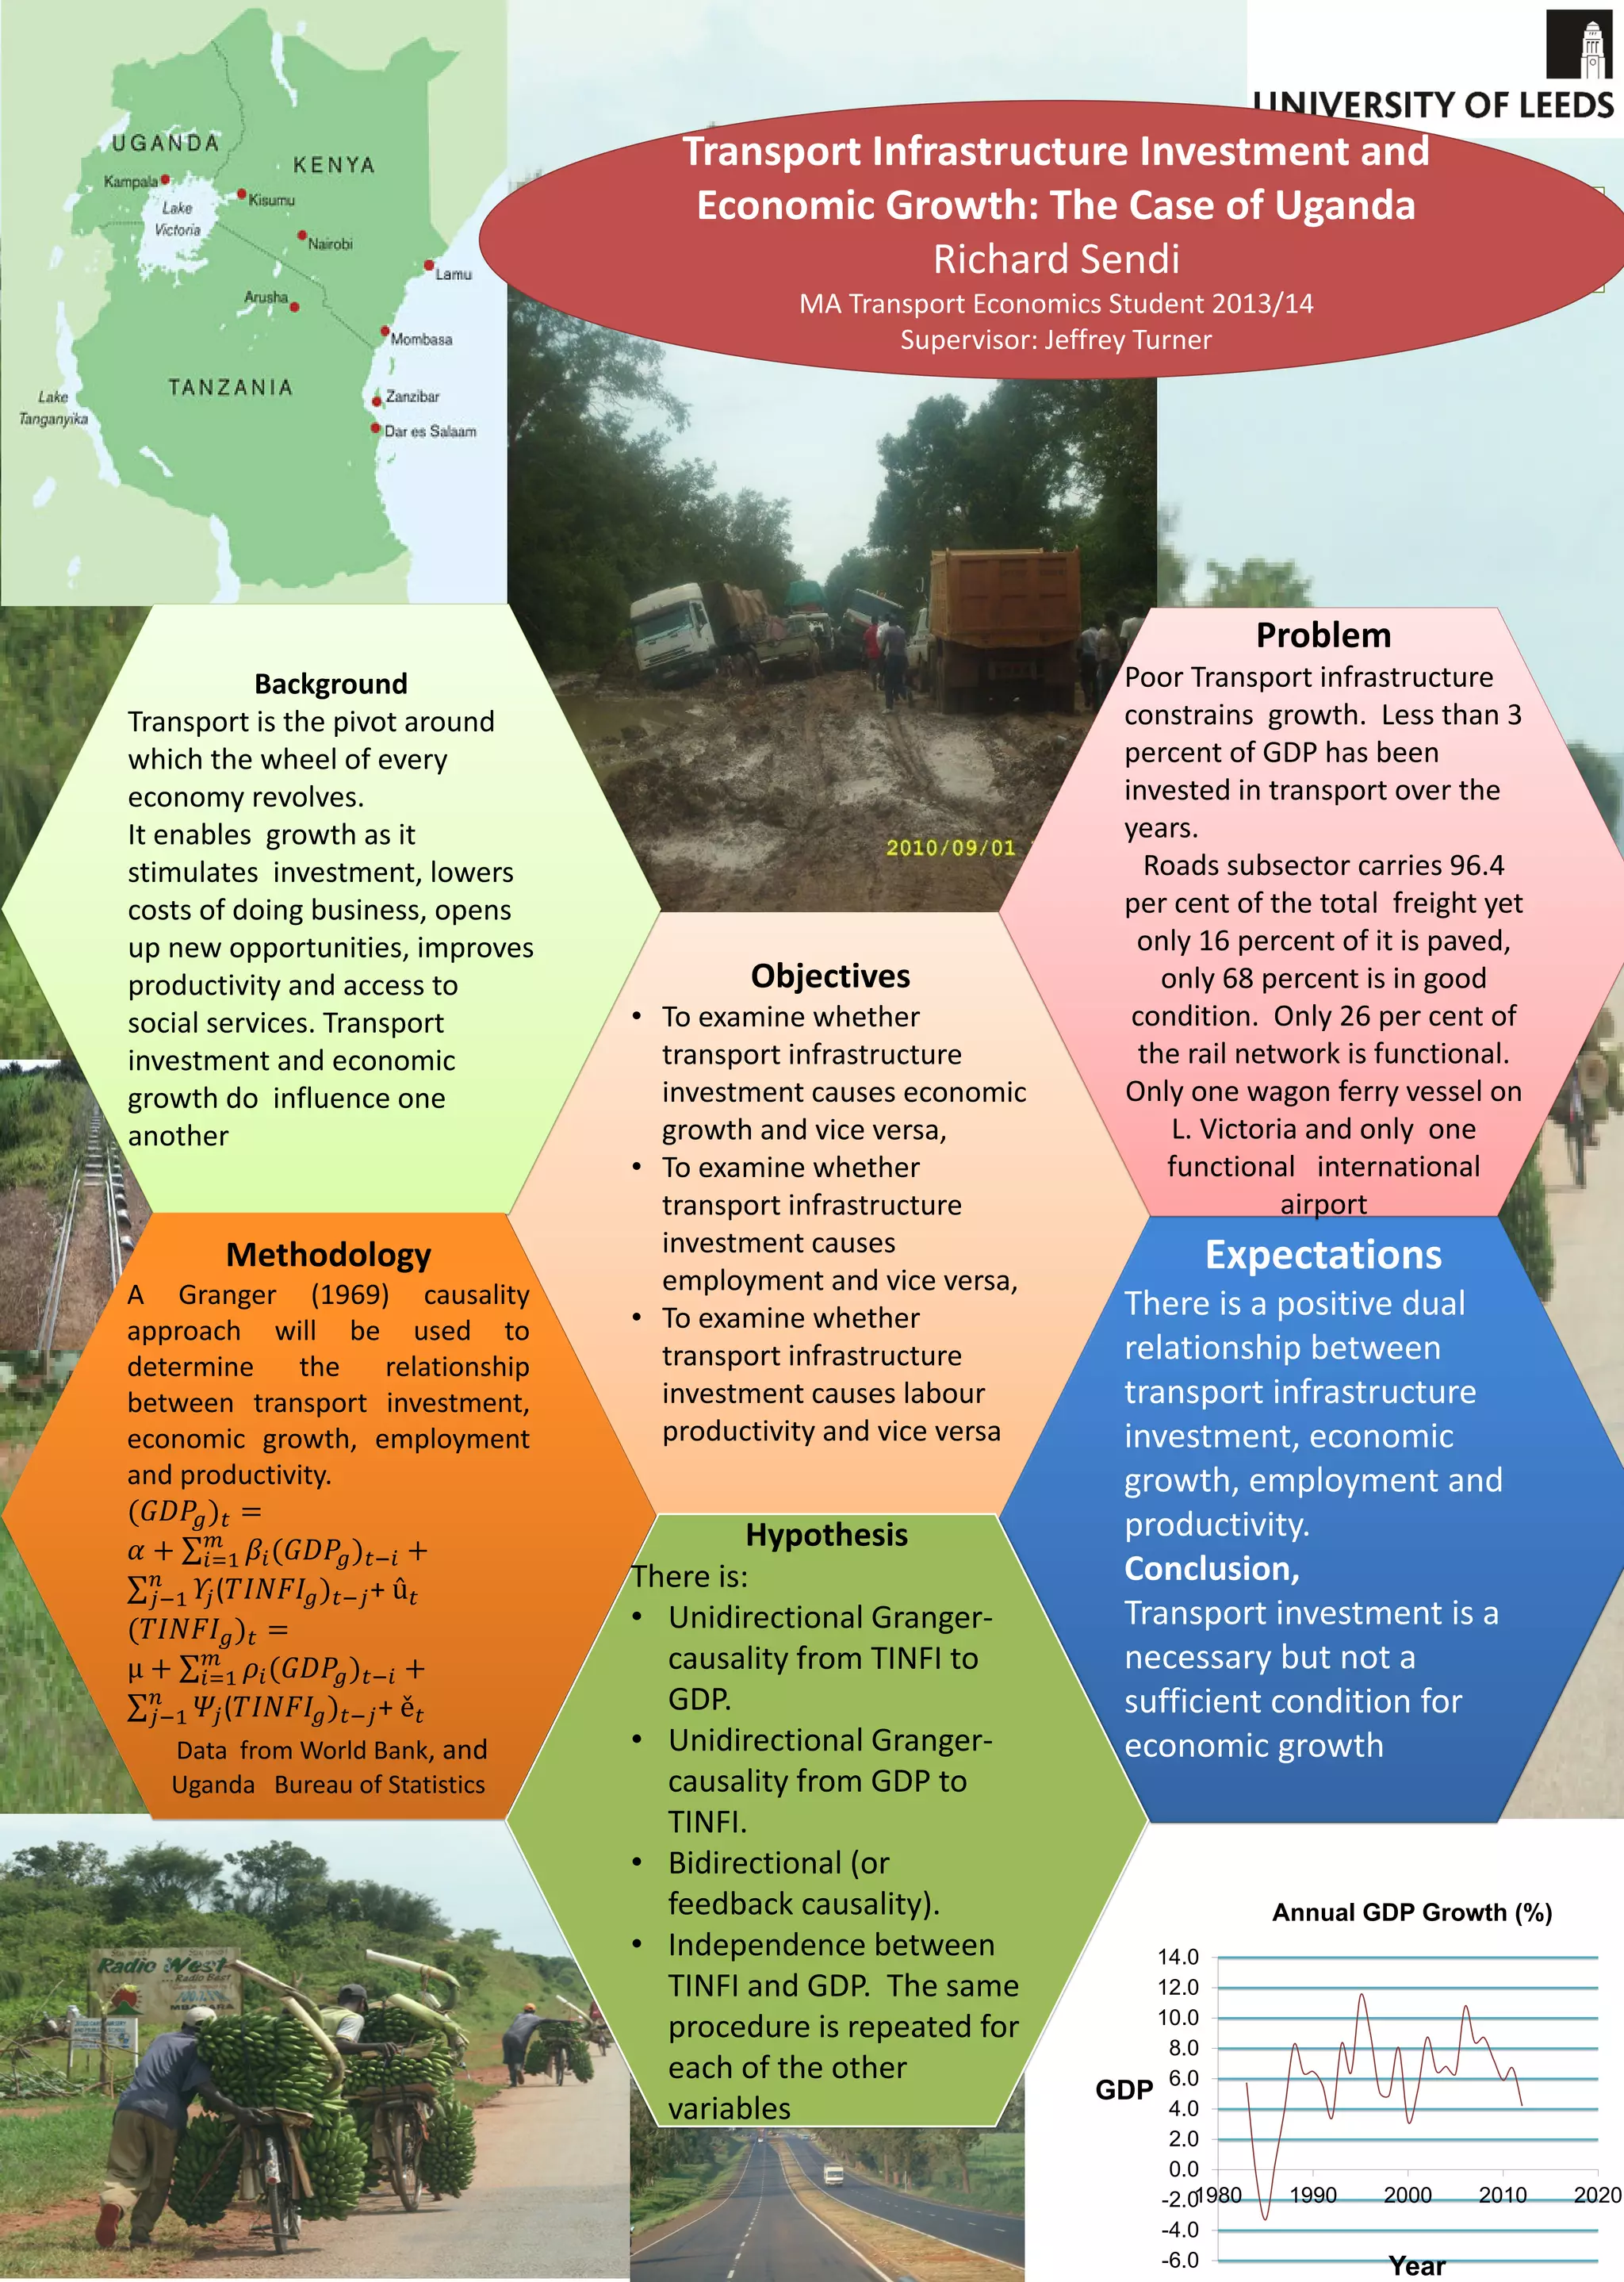
Site Profile: Merseyside
Population: 1,381,200 (9th)
645 km2 (43rd)
5 Boroughs – Knowsley, Liverpool,
Sefton, St Helens, Wirral
Valued at £21.9 Billion (2.1% of U.K
economy) GVA (Gross Value Added)
0 1 2 3 4 50.5
Miles
Ward_Boundaries
No. of Households With Access To A Vehicles
18 - 94
95 - 171
172 - 247
248 - 323
324 - 400
401 - 476
477 - 552
553 - 628
629 - 705
706 - 781
No Data
¡
No. Of Households with
No Access To A Vehicle
(Inset of Wirral and Liverpool Boundaries)
0 2.5 5 7.5 101.25
Miles
0 1 2 3 4 50.5
Miles
Ward_Boundaries
No. Of Households with Dependents
8 - 28
29 - 49
50 - 69
70 - 89
90 - 110
111 - 130
131 - 150
151 - 170
171 - 191
192 - 211
No Data
¡
No. Of Households with
Dependents in Merseyside
(Inset of Wirral and Liverpool Boundaries)
0 2.5 5 7.5 101.25
Miles
The
Maps:
The
Maths:
PC = TC
TC + TT
CIJ = a1.tIV + a2.tWK + a3.tWT
+ a4.tIN + a5.F + a6
The
Method:
Ai = Σ [BJf(CIJ)]
Accessibility To Destination:
This will demonstrate how
accessible a location is based
on either Thiessen polygons
(zone inside polygon is closer
to that sample) or isochrones
(coloured bars of equal value).
Modal Split/Destination
Attractiveness:
Multi-nomial logit models
calculating modal split.
(Equation can be used for
destinations). These can be
portrayed 3D or by colour
(large spike, more accessible)
Route Allocation/ Trip
Chaining:
Network Analyses using the cost
equation above will show the
“cheapest” route for an
i n d i v i d u a l t o u s e . A l s o
demonstrates trip-chaining (best
way to carry out multiple tasks).
D e m o n s t r a t e a n d
evaluate disaggregate
t e c h n i q u e s o f
accessibility analysis
Potential Issues
Establishing parameters. How to
measure a preference?
How disaggregate is too
disaggregate?
Issues with deterrence functions.
How viable are the methods?
Literature Review:
1970
Geographical Space Accessible Space
2011
Hagerstrand developed a
time-geographies concept.
3 M a i n C o n s t r a i n t s :
“capability constraints”,
“coupling constraints” and
“authority constraints”.
Computing power
h a s a l l o w e d f o r
disaggregate activity
modelling to be
c a r r i e d o u t .
S t i l l a “ p i o n e e r i n g ”
m e t h o d . B u f f e r s a r e
predominant technique
Not a spatially defined problem. – Large
geographical space, small accessible space.
Need to consider area mobility, individual
m o b i l i t y a n d a r e a a c c e s s i b i l i t y.
Economic status, car availability and physical
or social preferences and limitations can
affect how a person can or wants to travel.
A Local Travel Plan (LTP) set up
by the Local Authority and
Merseytravel seeks to “develop a
fully integrated and sustainable
transport network... And ensures
good access for all in the
community” (Merseytravel 2000)
The End Result:
GIS outputs of varying types with two main aims:
1. Levels of accessibility for individuals demonstrating how their lifestyles
affect their travel choices and access.
2. Differences between the disaggregate methods used in the study and
aggregate methods carried out as a comparative tool.
This will establish if the individual level studies are more accurate than
aggregate measures, and if so, to what extent, with what outcomes?
What Next…?
Need to establish parameters to use within the functions.
Carry out the GIS techniques and modelling.
Analyse and evaluate the datasets – See what is possible.
Large number of citizens in
certain areas are not car
users and as such find it hard
to carry out fundamental
tasks, such as taking children
to school or going shopping.
Thus creating and social
exclusion transport poverty.
f f
Some Important Questions:
Can GIS model the movements of individuals
based on their preferences, motivations and
restrictions, and how these relate to transport?
Does a micro-level analysis offer a viable
alternative to the current methods of study?
One Size Doesn’t Fit All...
Many relationships exist between
different individuals preferences,
capabilities and the levels of their
t r a n s p o r t a c c e s s i b i l i t y .
Aggregate methods (groups, not
individuals) can miss important
elements of a persons accessibility.
Study Aims:
Carry out an accessibility study of Merseyside at a disaggregate
level.
Highlight inefficiencies
in aggregate modelling
Show that individuals
from the same areas
have differing travel
patterns.](https://image.slidesharecdn.com/allall-140515044924-phpapp01/75/Masters-Dissertation-Posters-2014-25-2048.jpg)
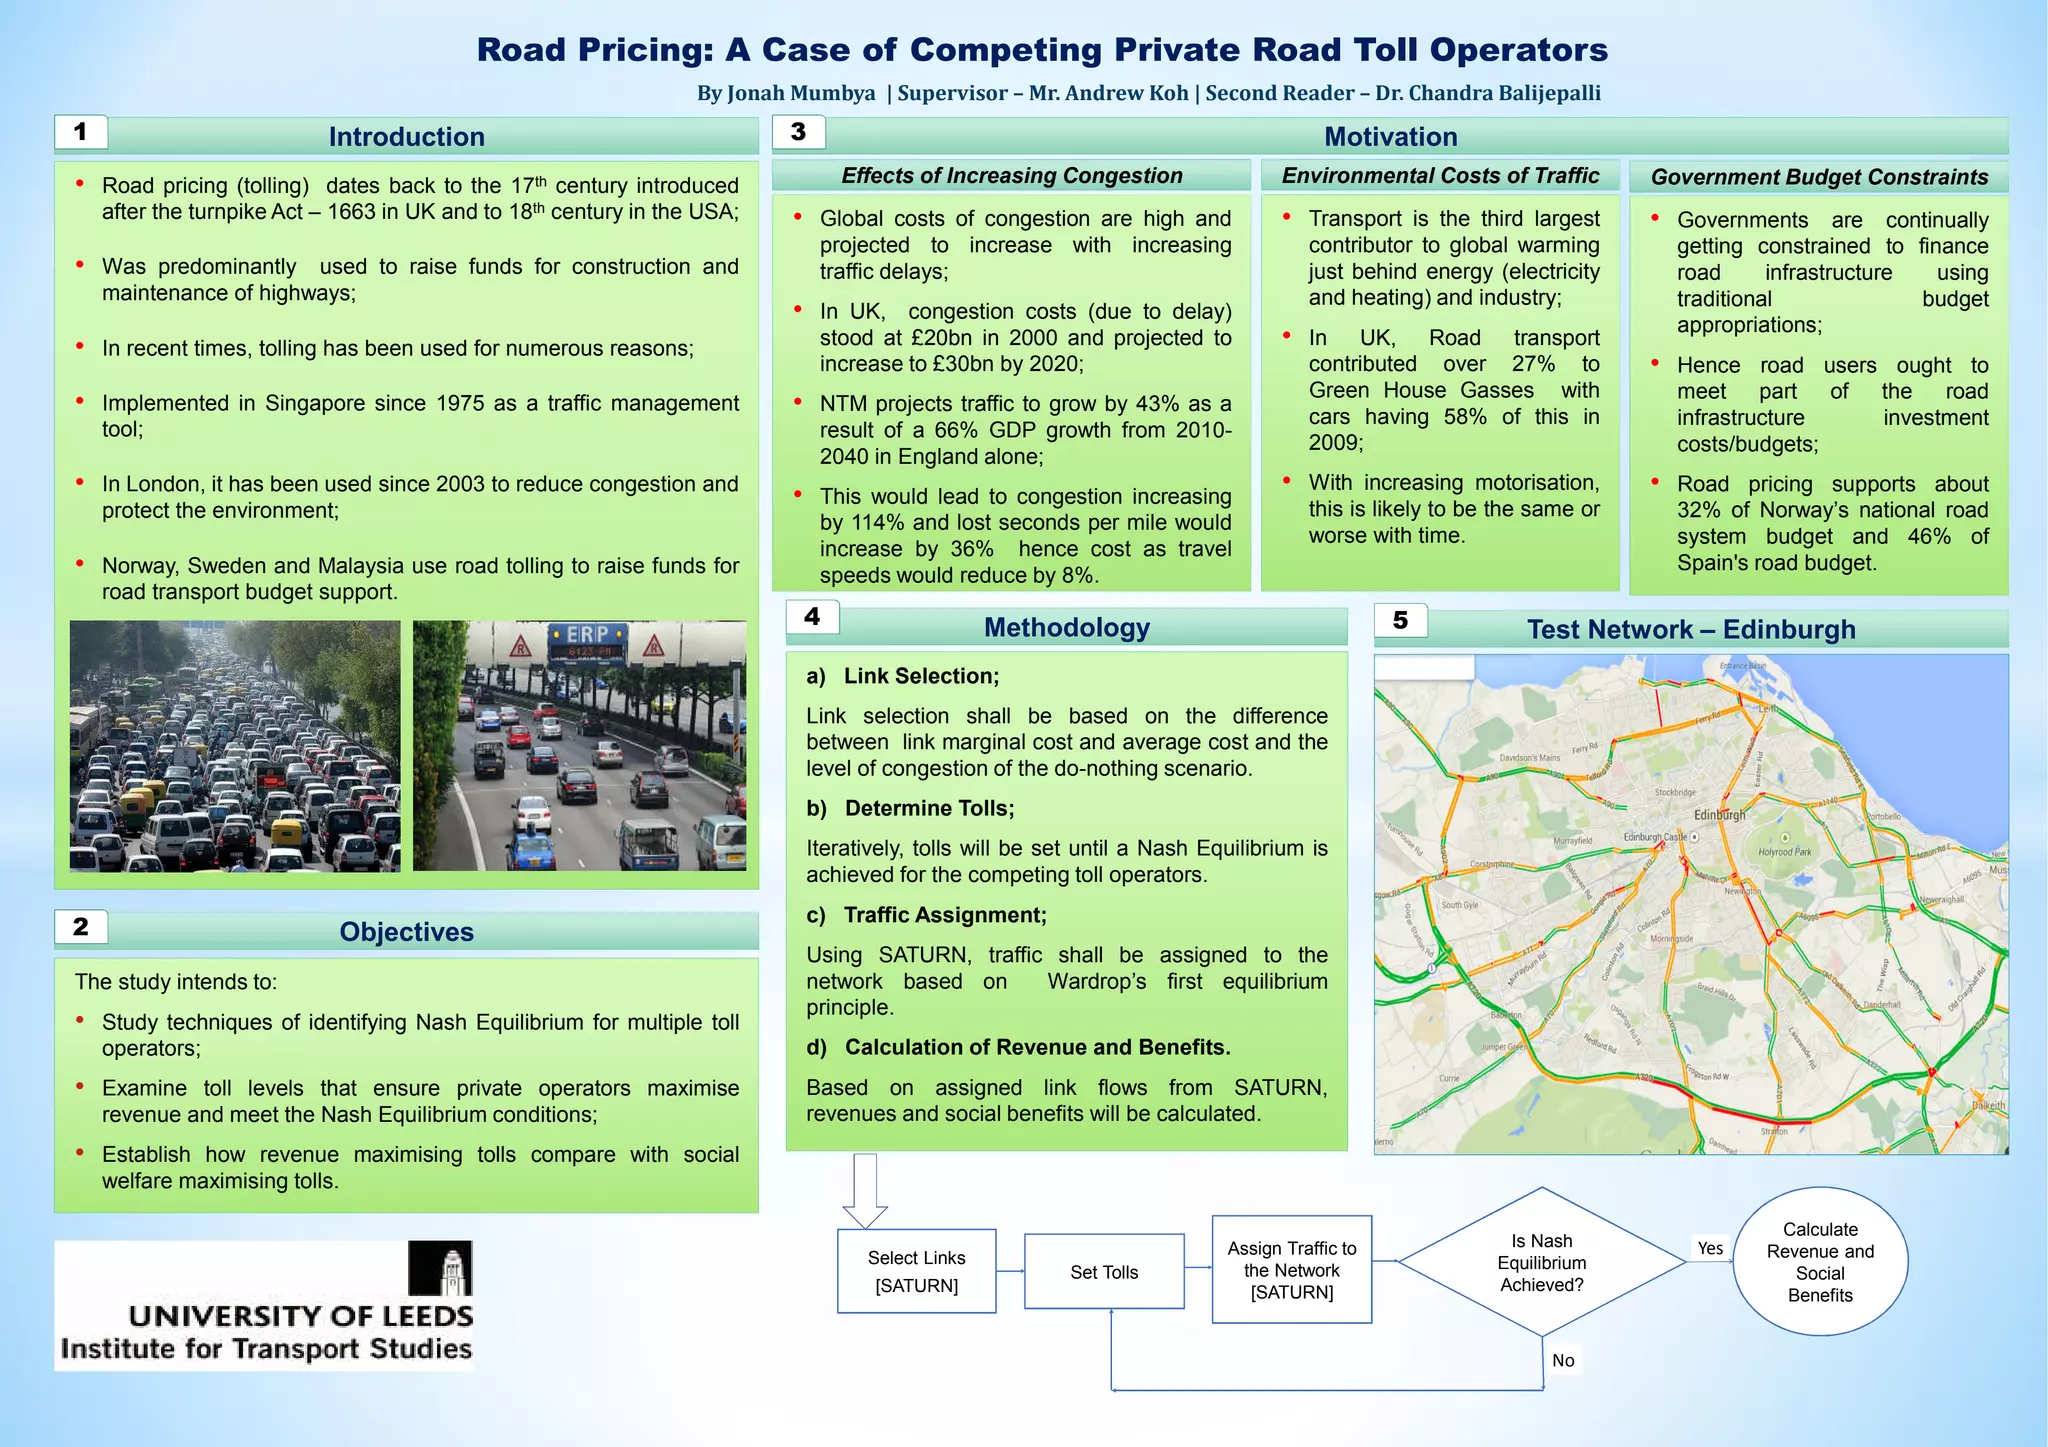
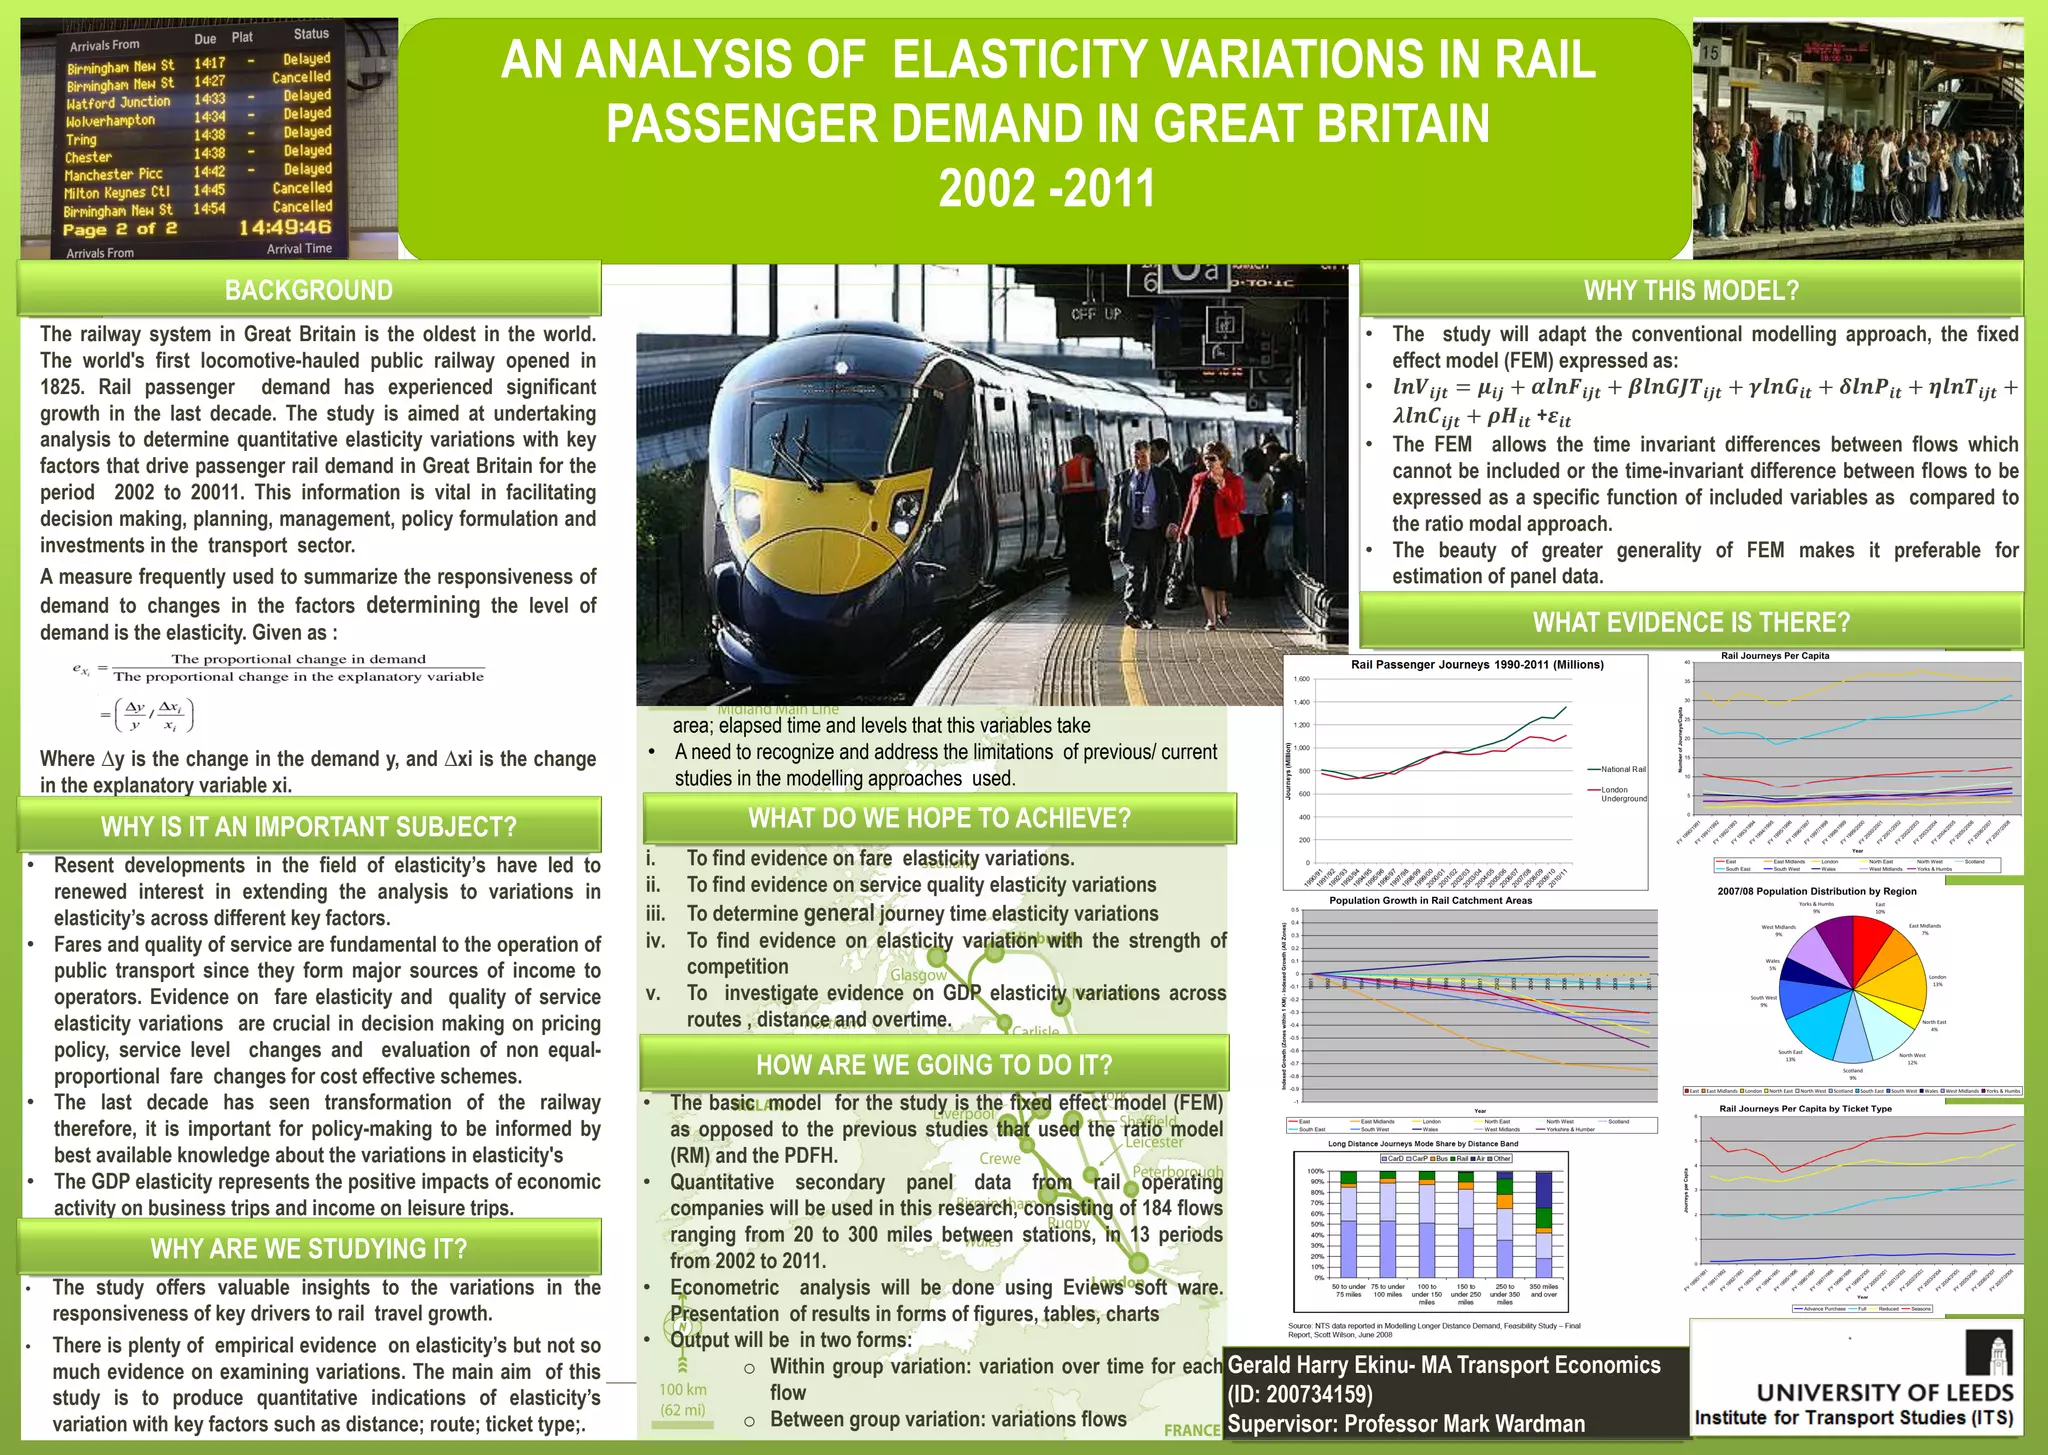
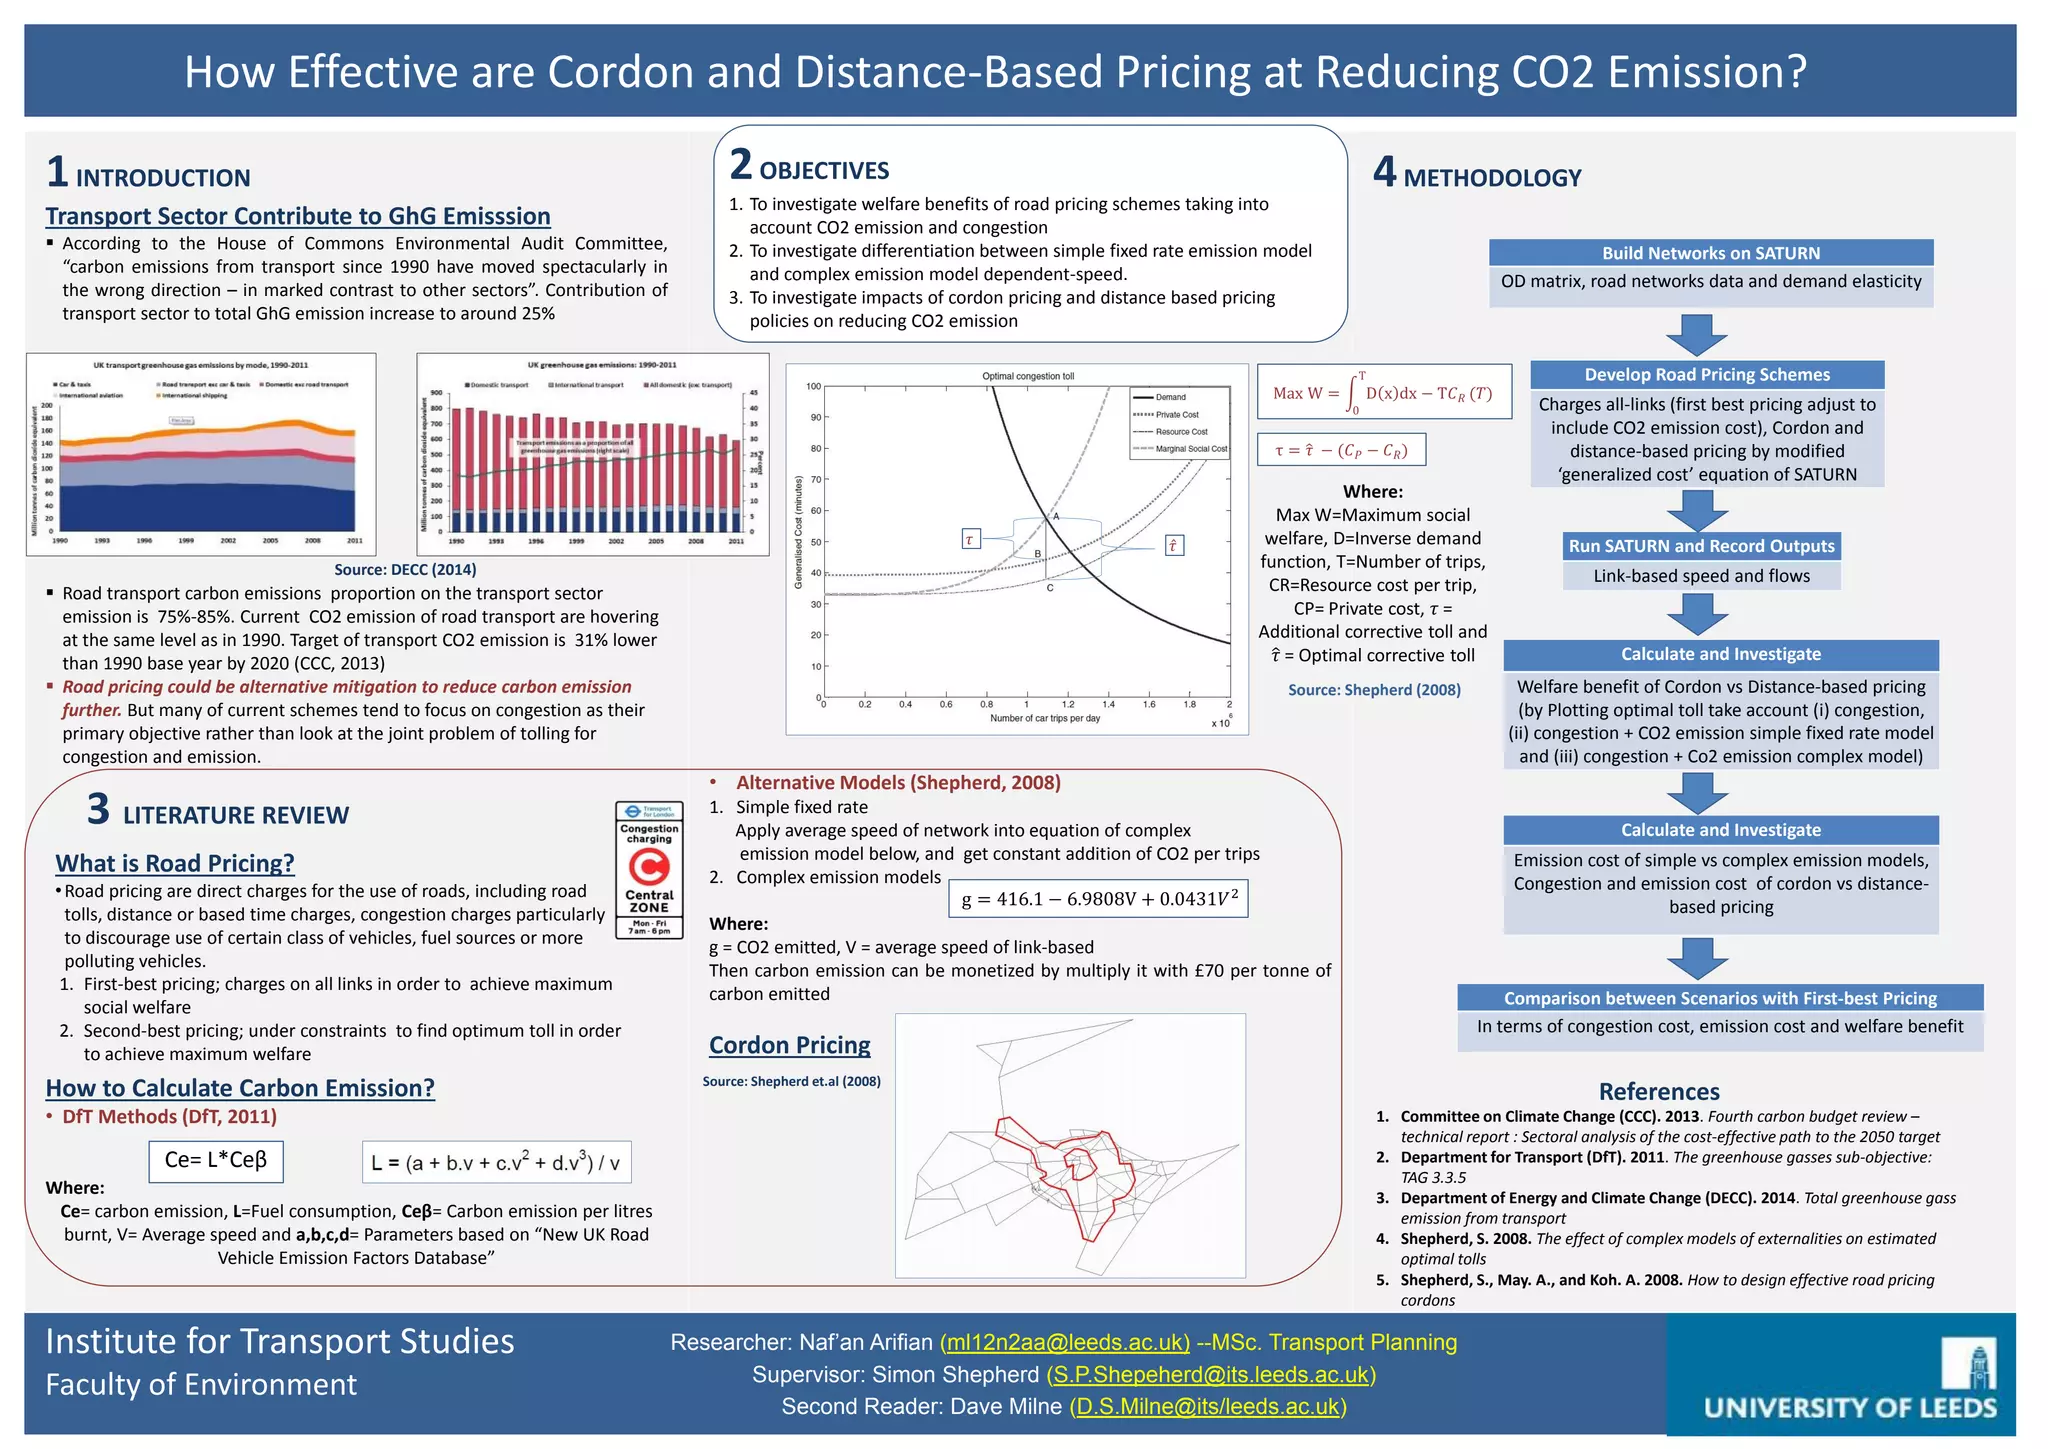
![• Road pricing (tolling) dates back to the 17th century introduced
after the turnpike Act – 1663 in UK and to 18th century in the USA;
• Was predominantly used to raise funds for construction and
maintenance of highways;
• In recent times, tolling has been used for numerous reasons;
• Implemented in Singapore since 1975 as a traffic management
tool;
• In London, it has been used since 2003 to reduce congestion and
protect the environment;
• Norway, Sweden and Malaysia use road tolling to raise funds for
road transport budget support.
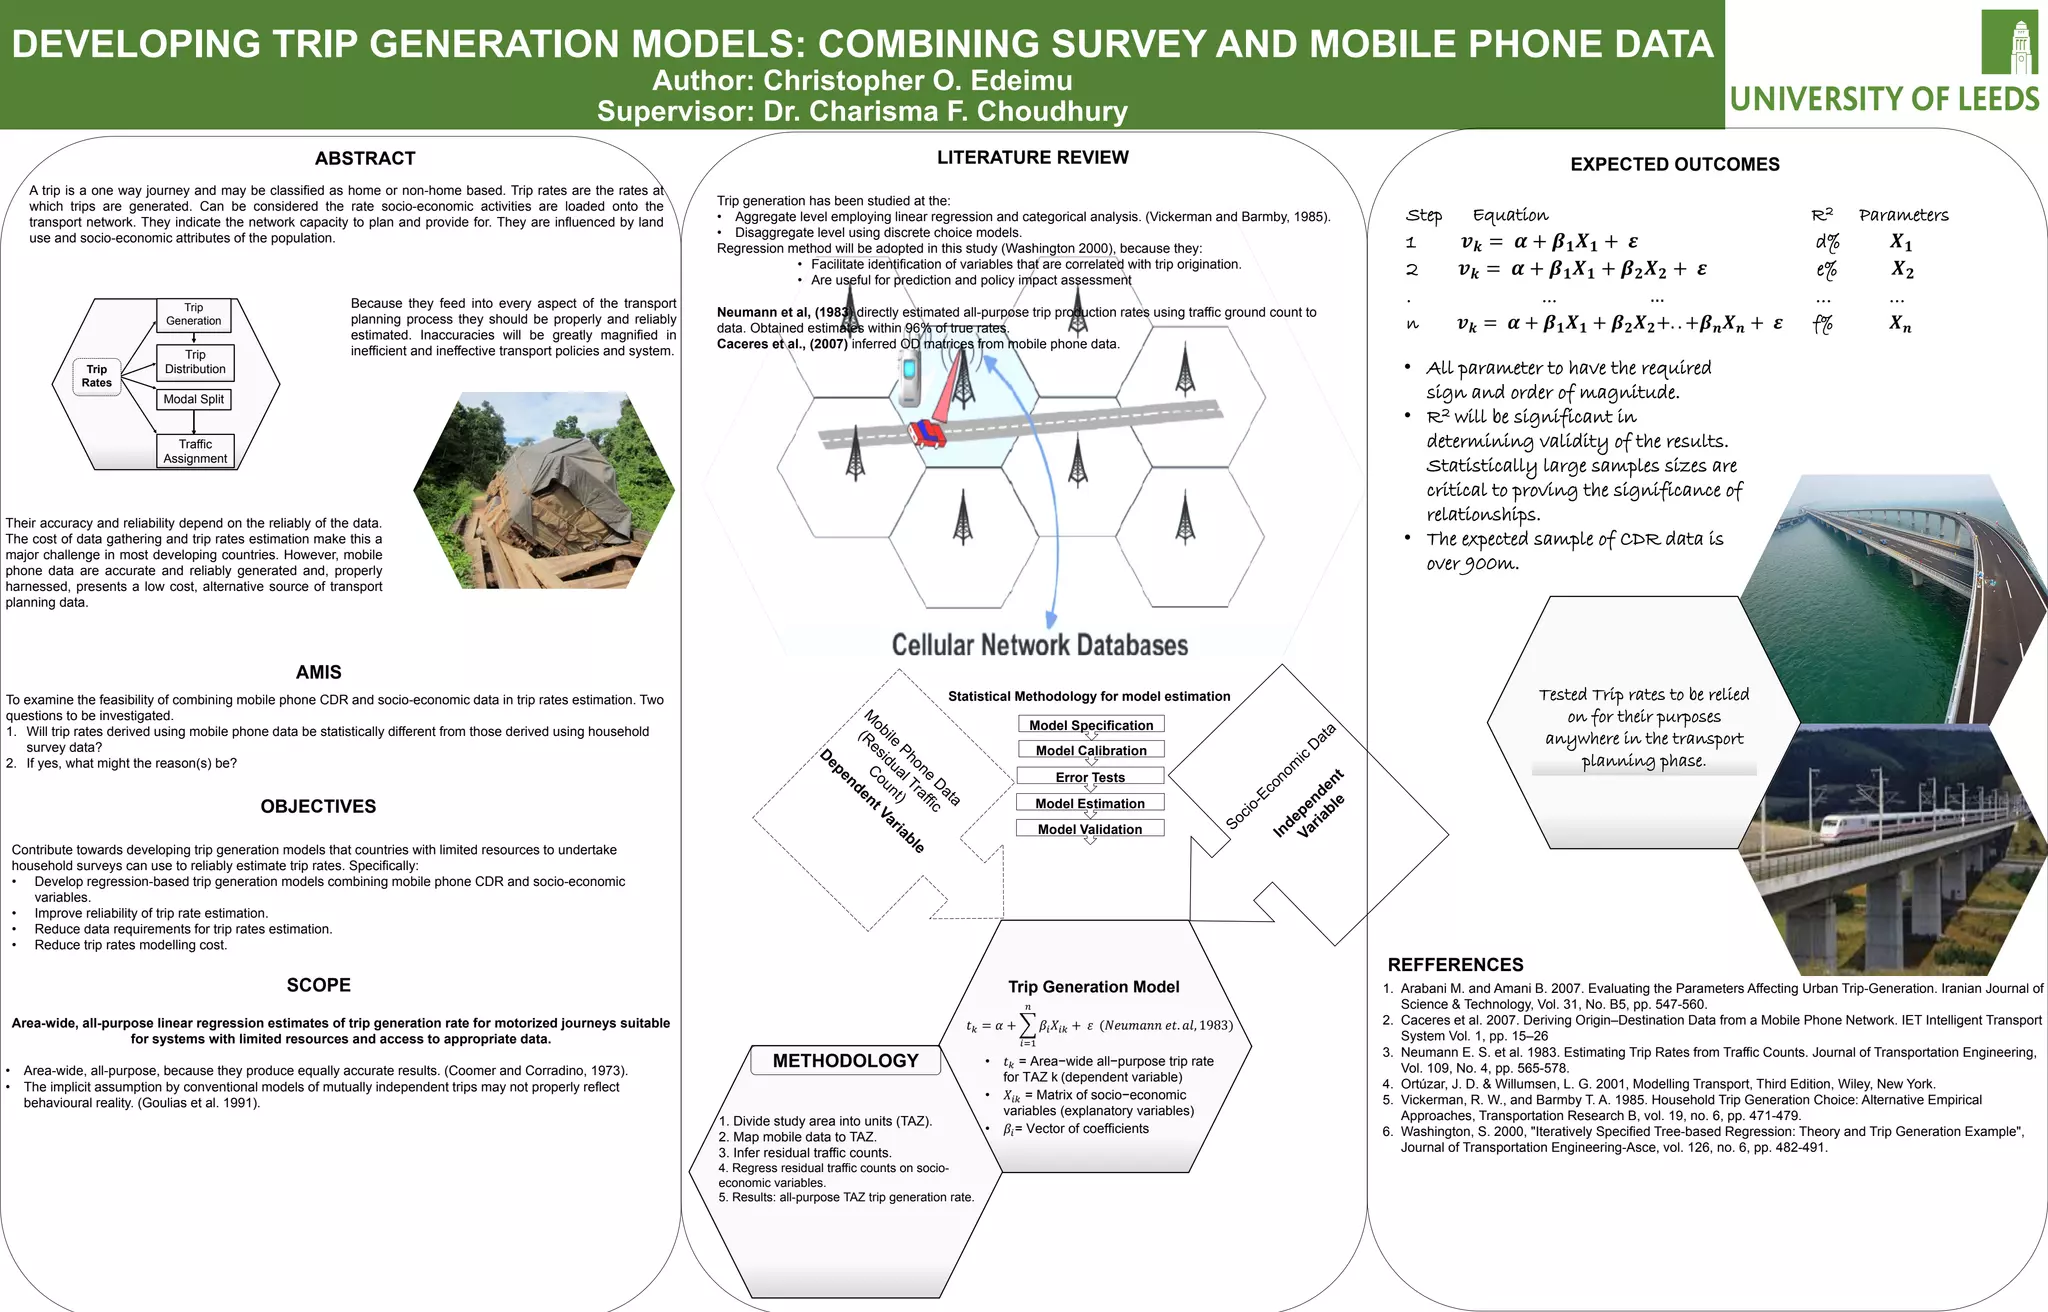
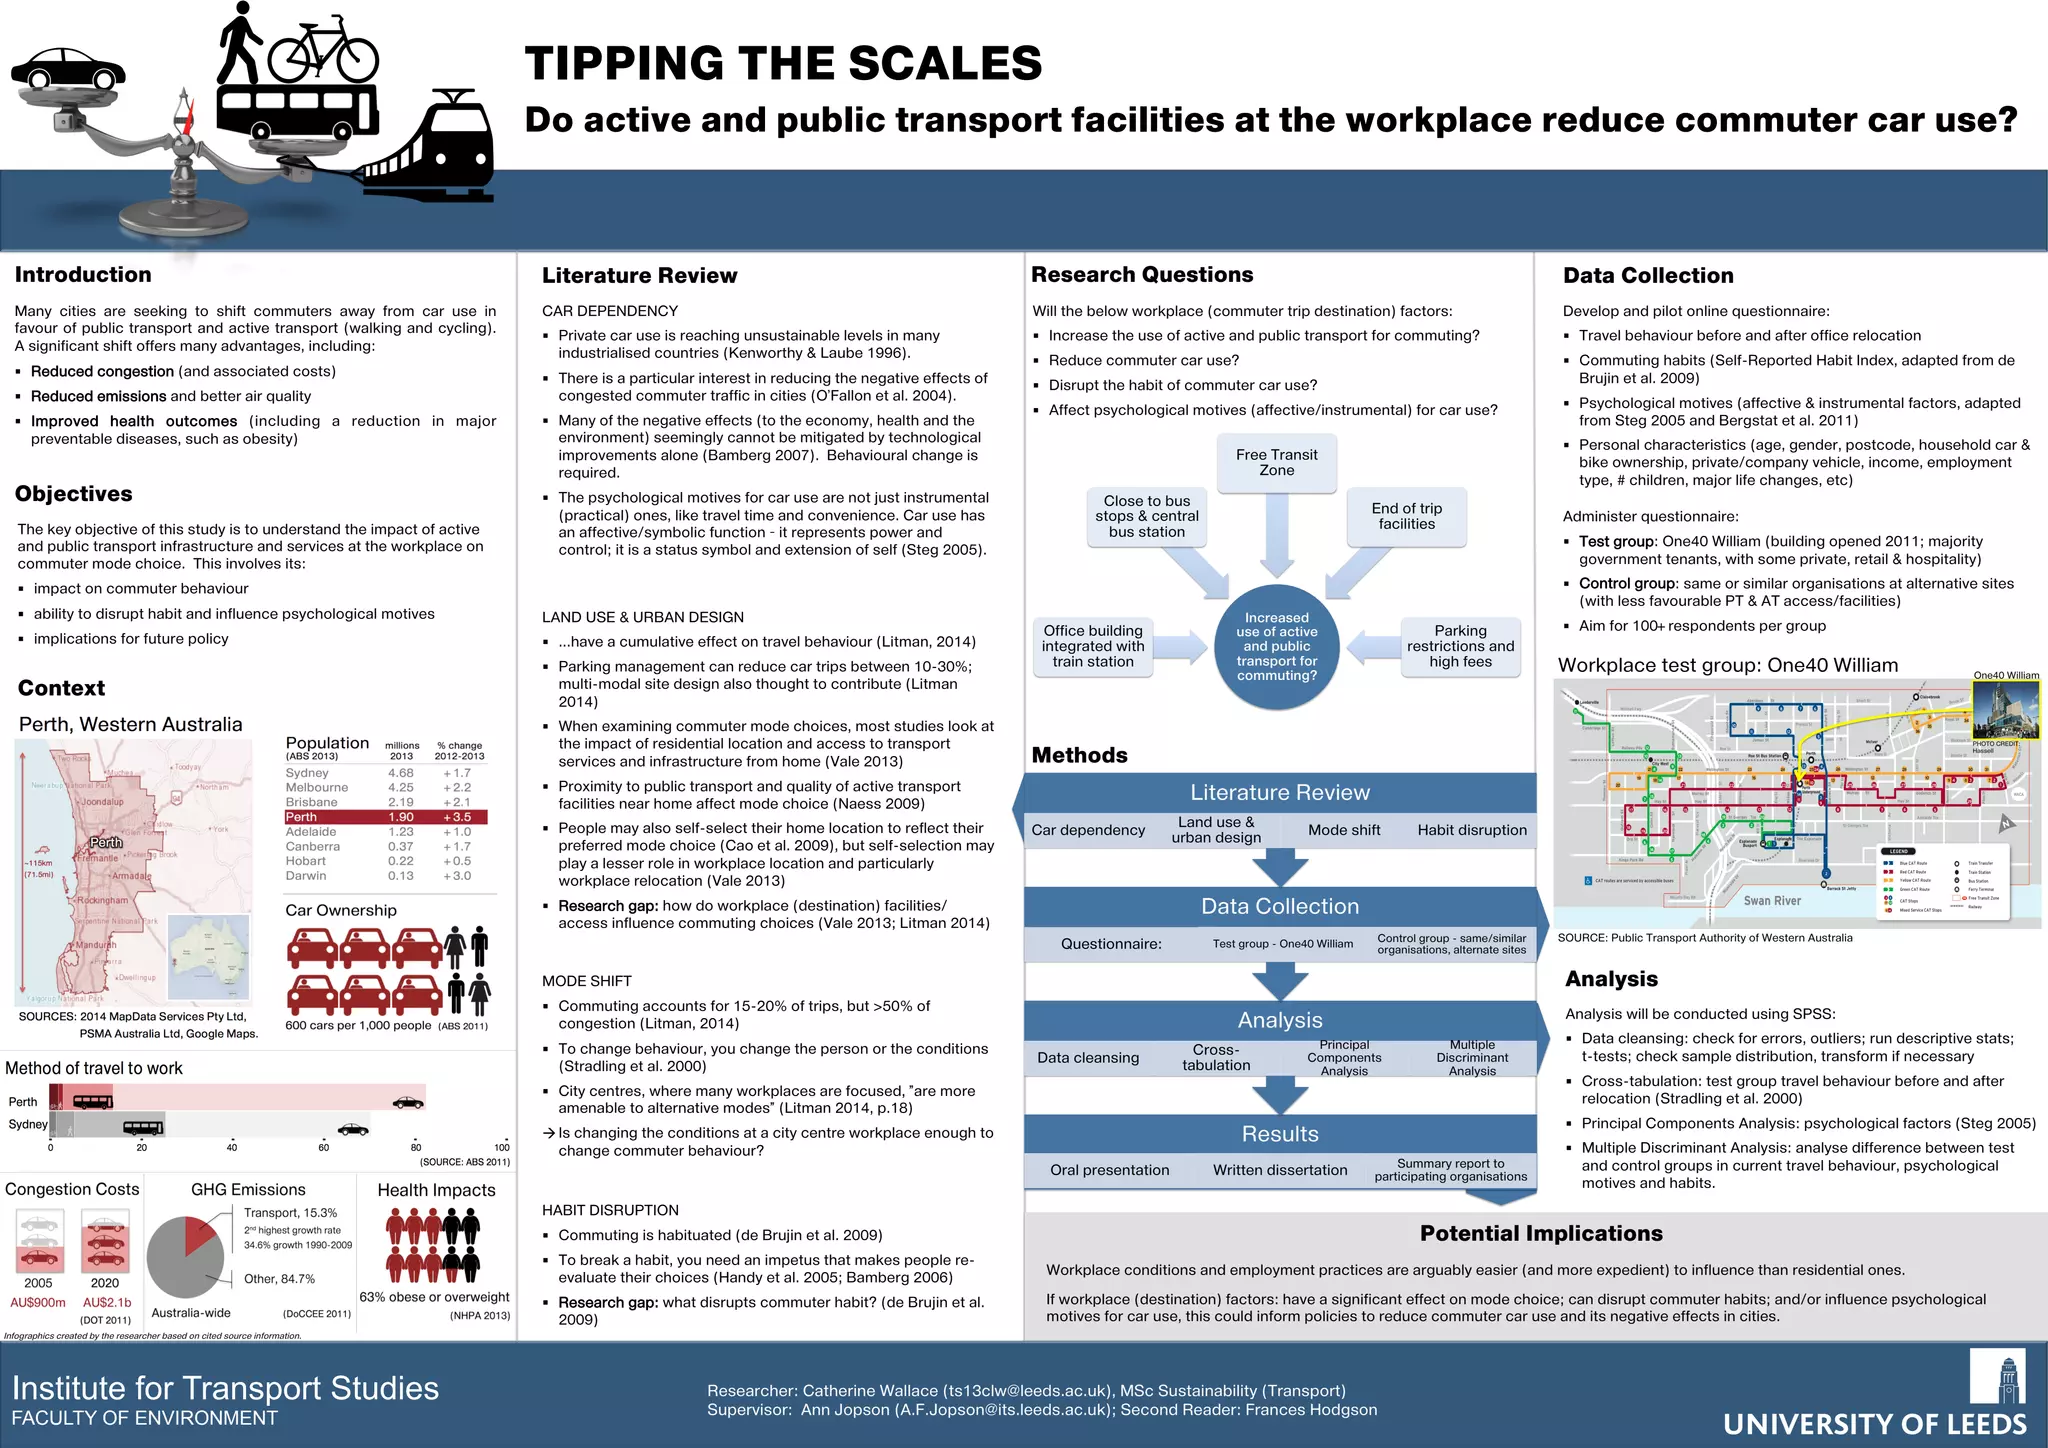
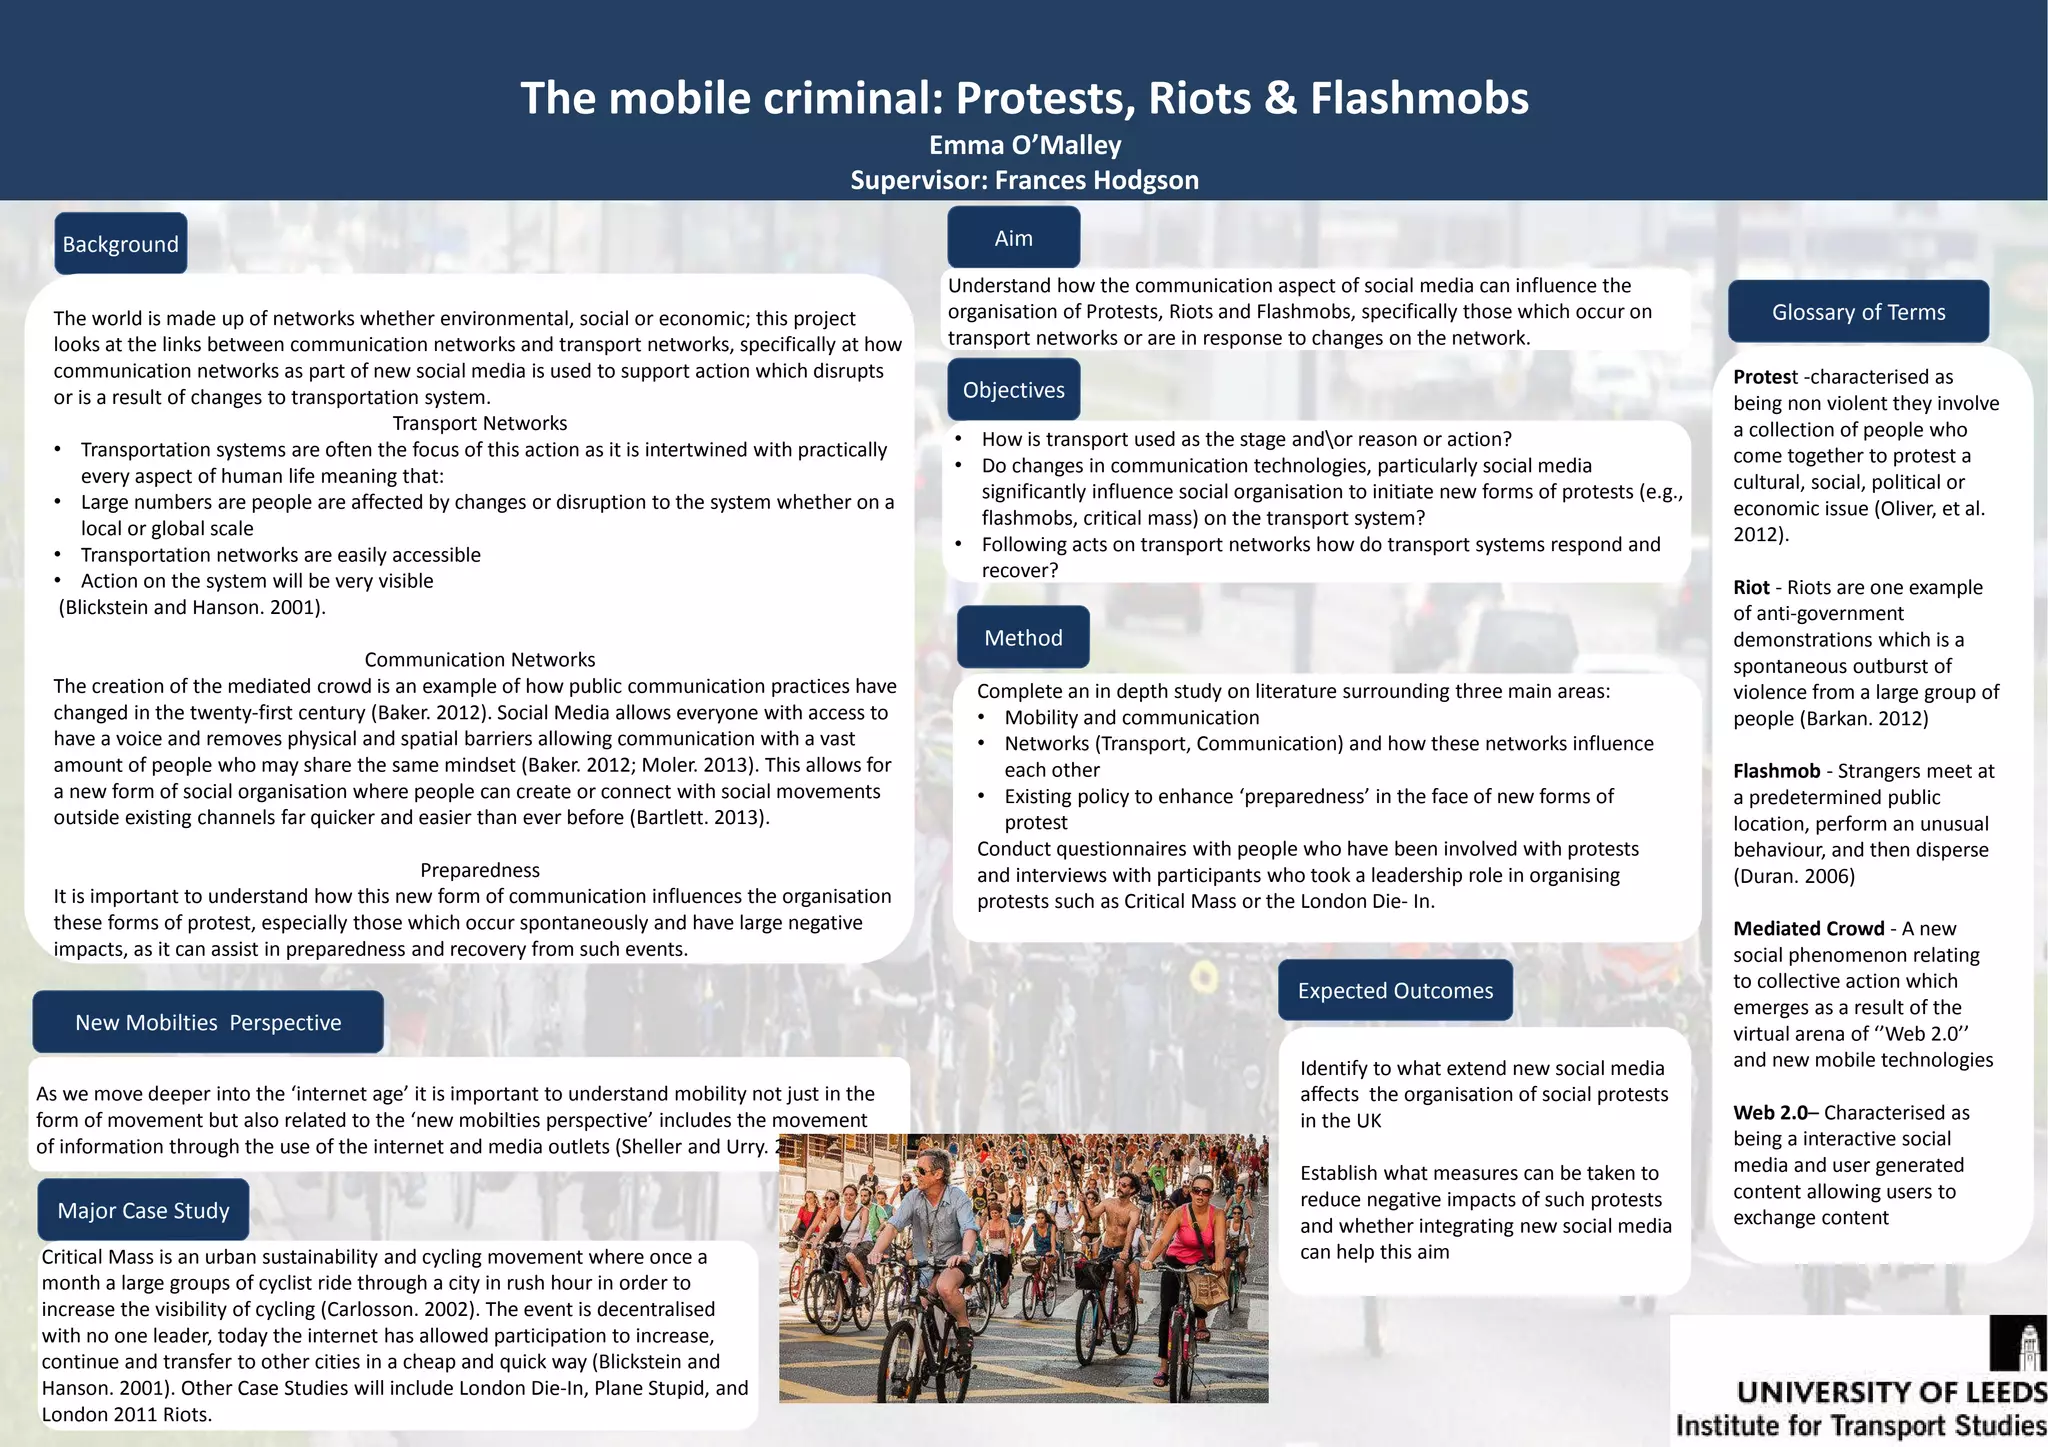
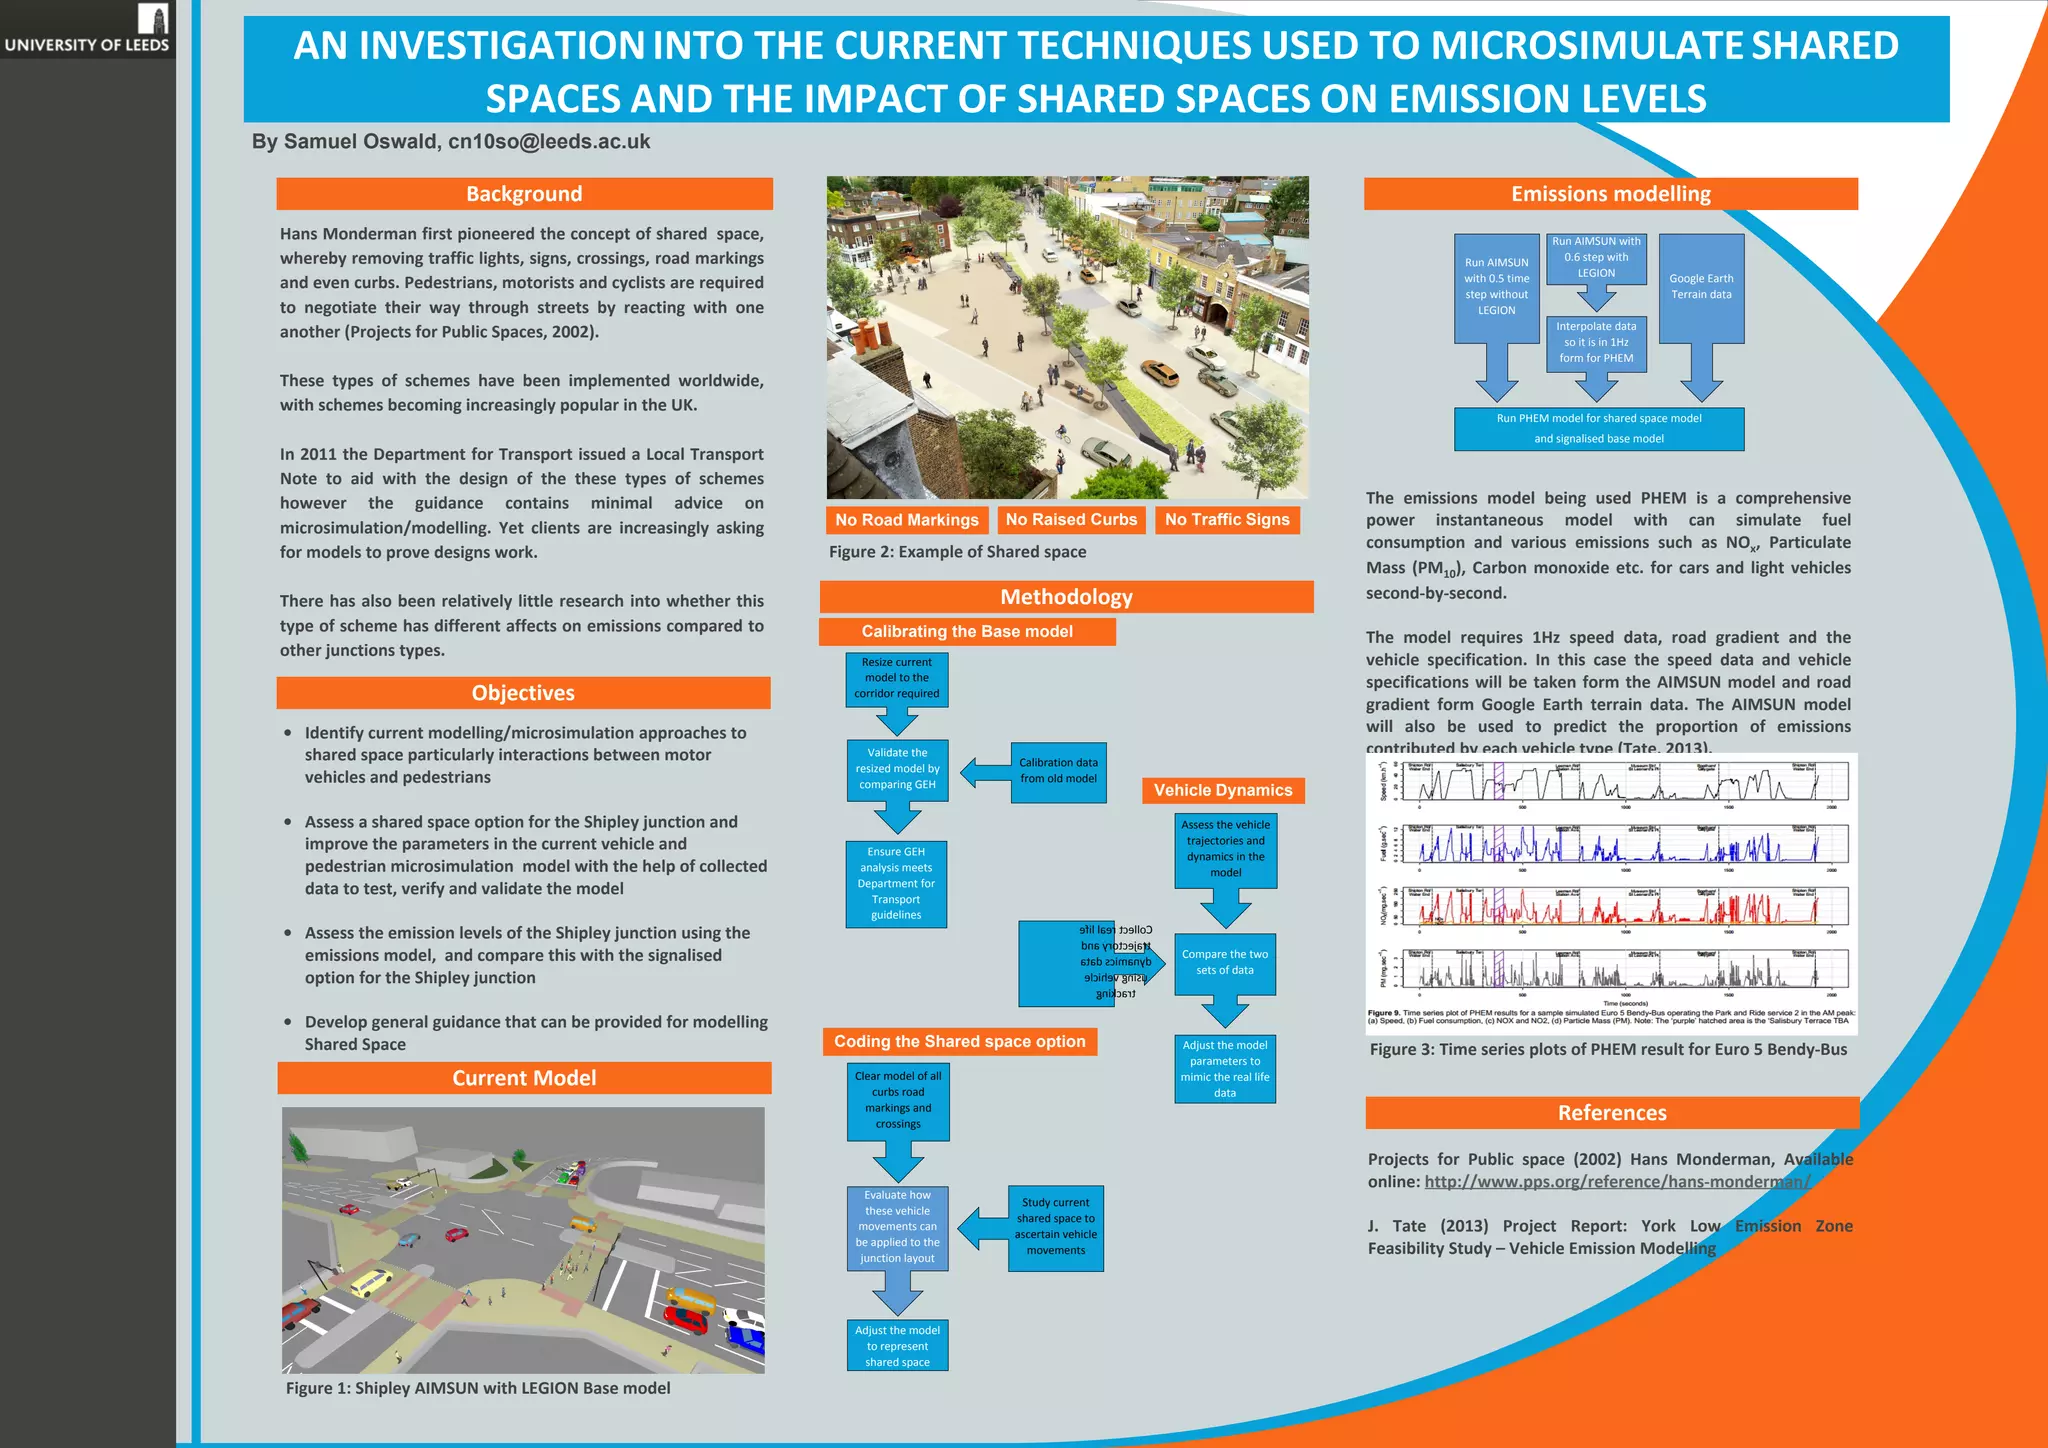
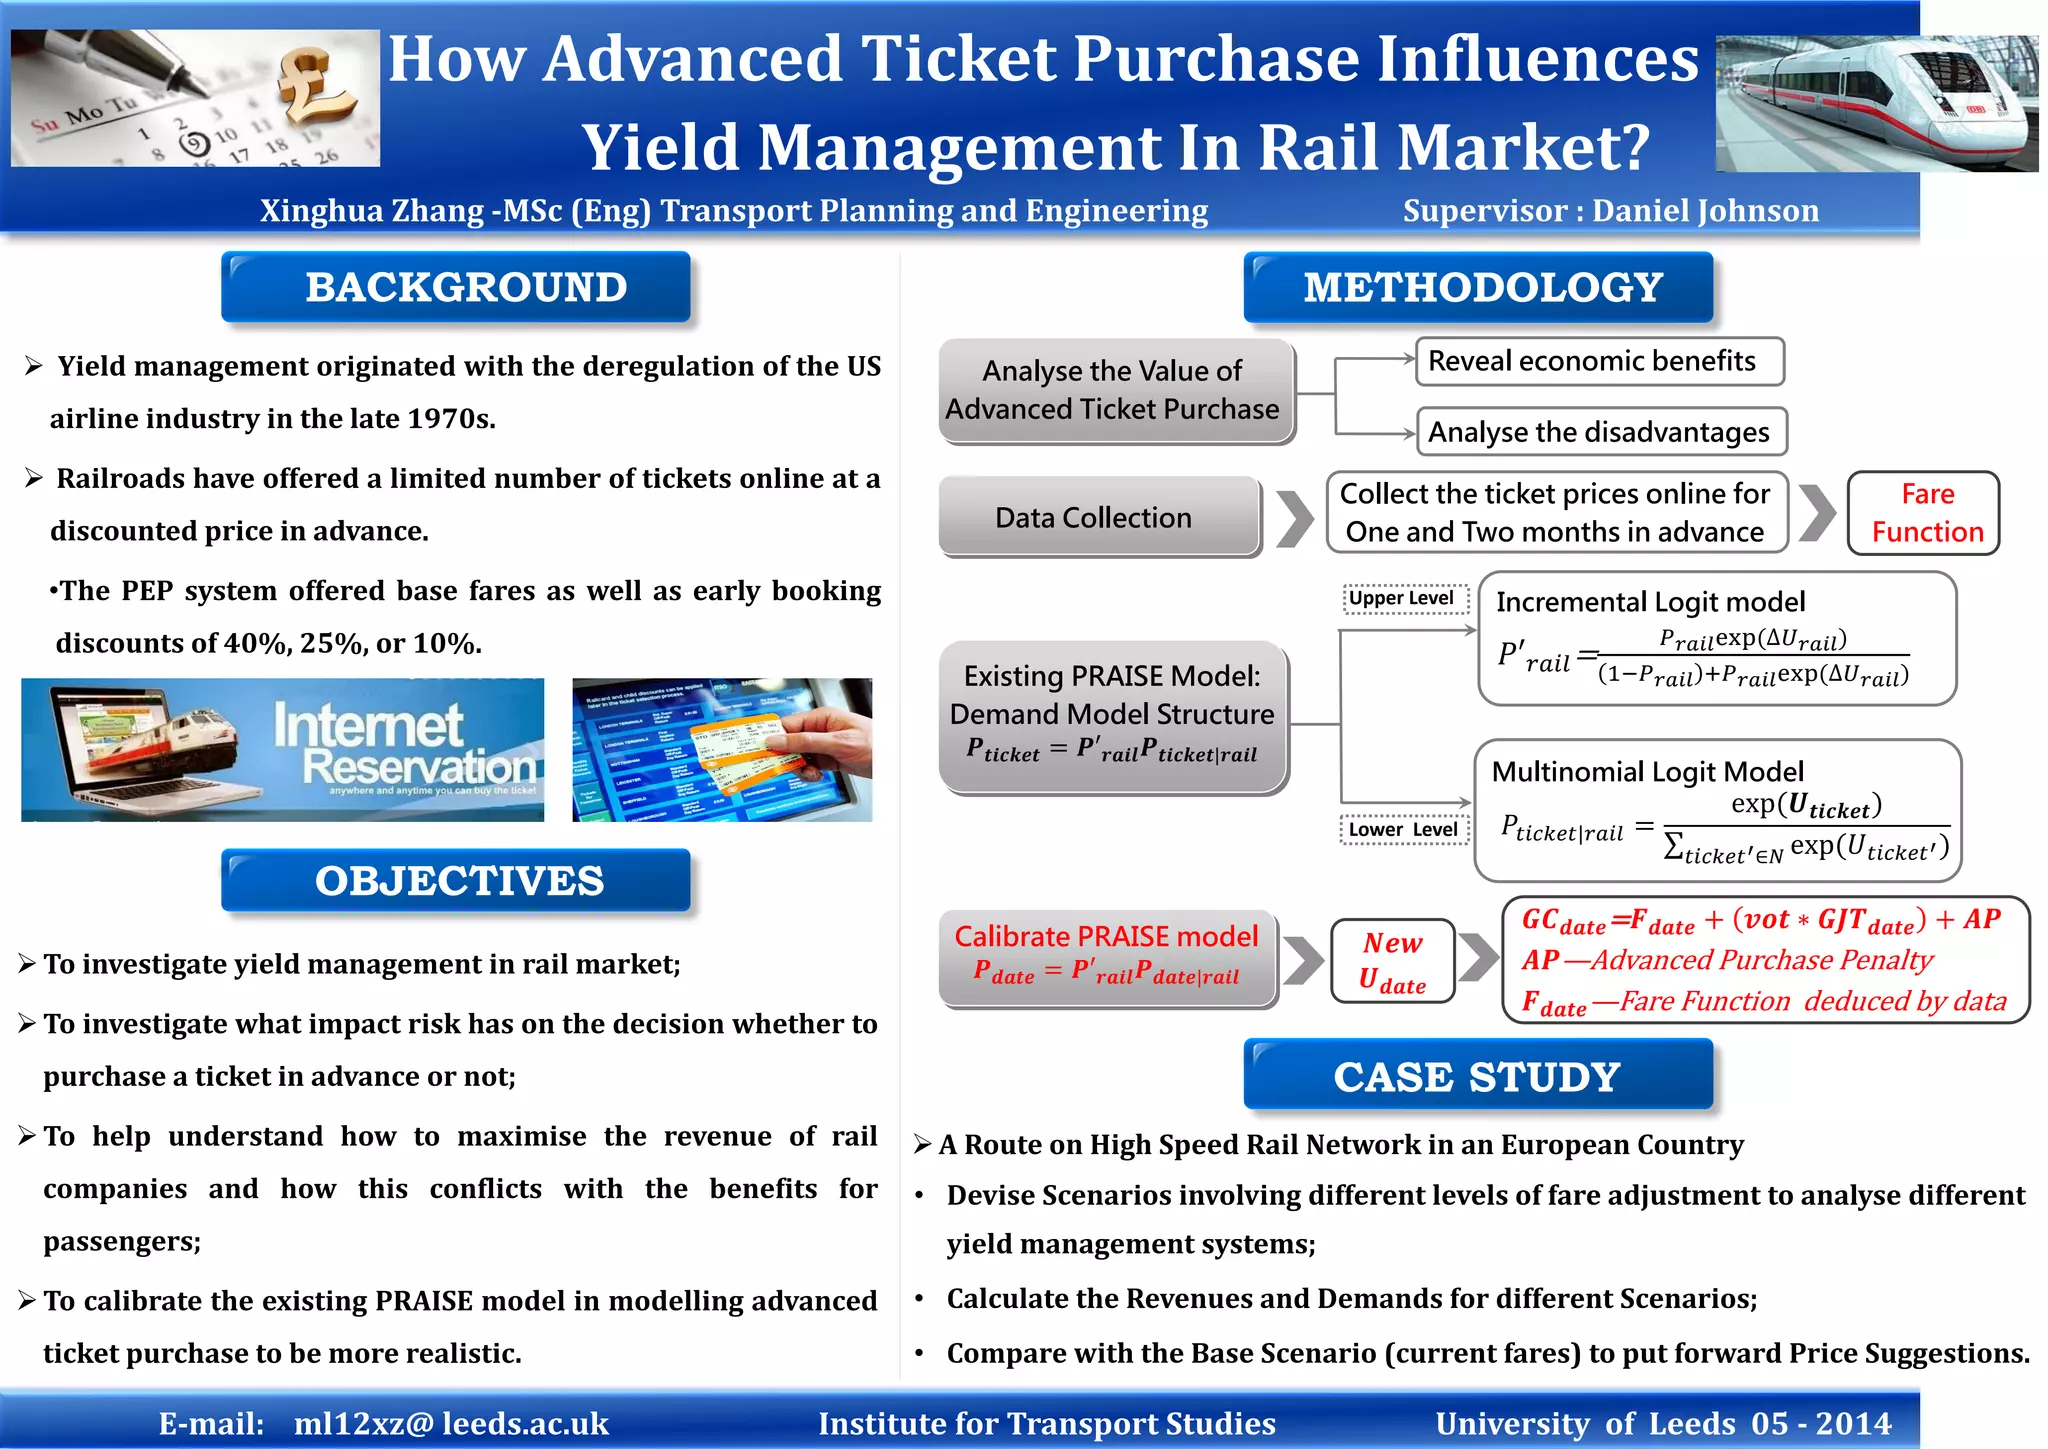
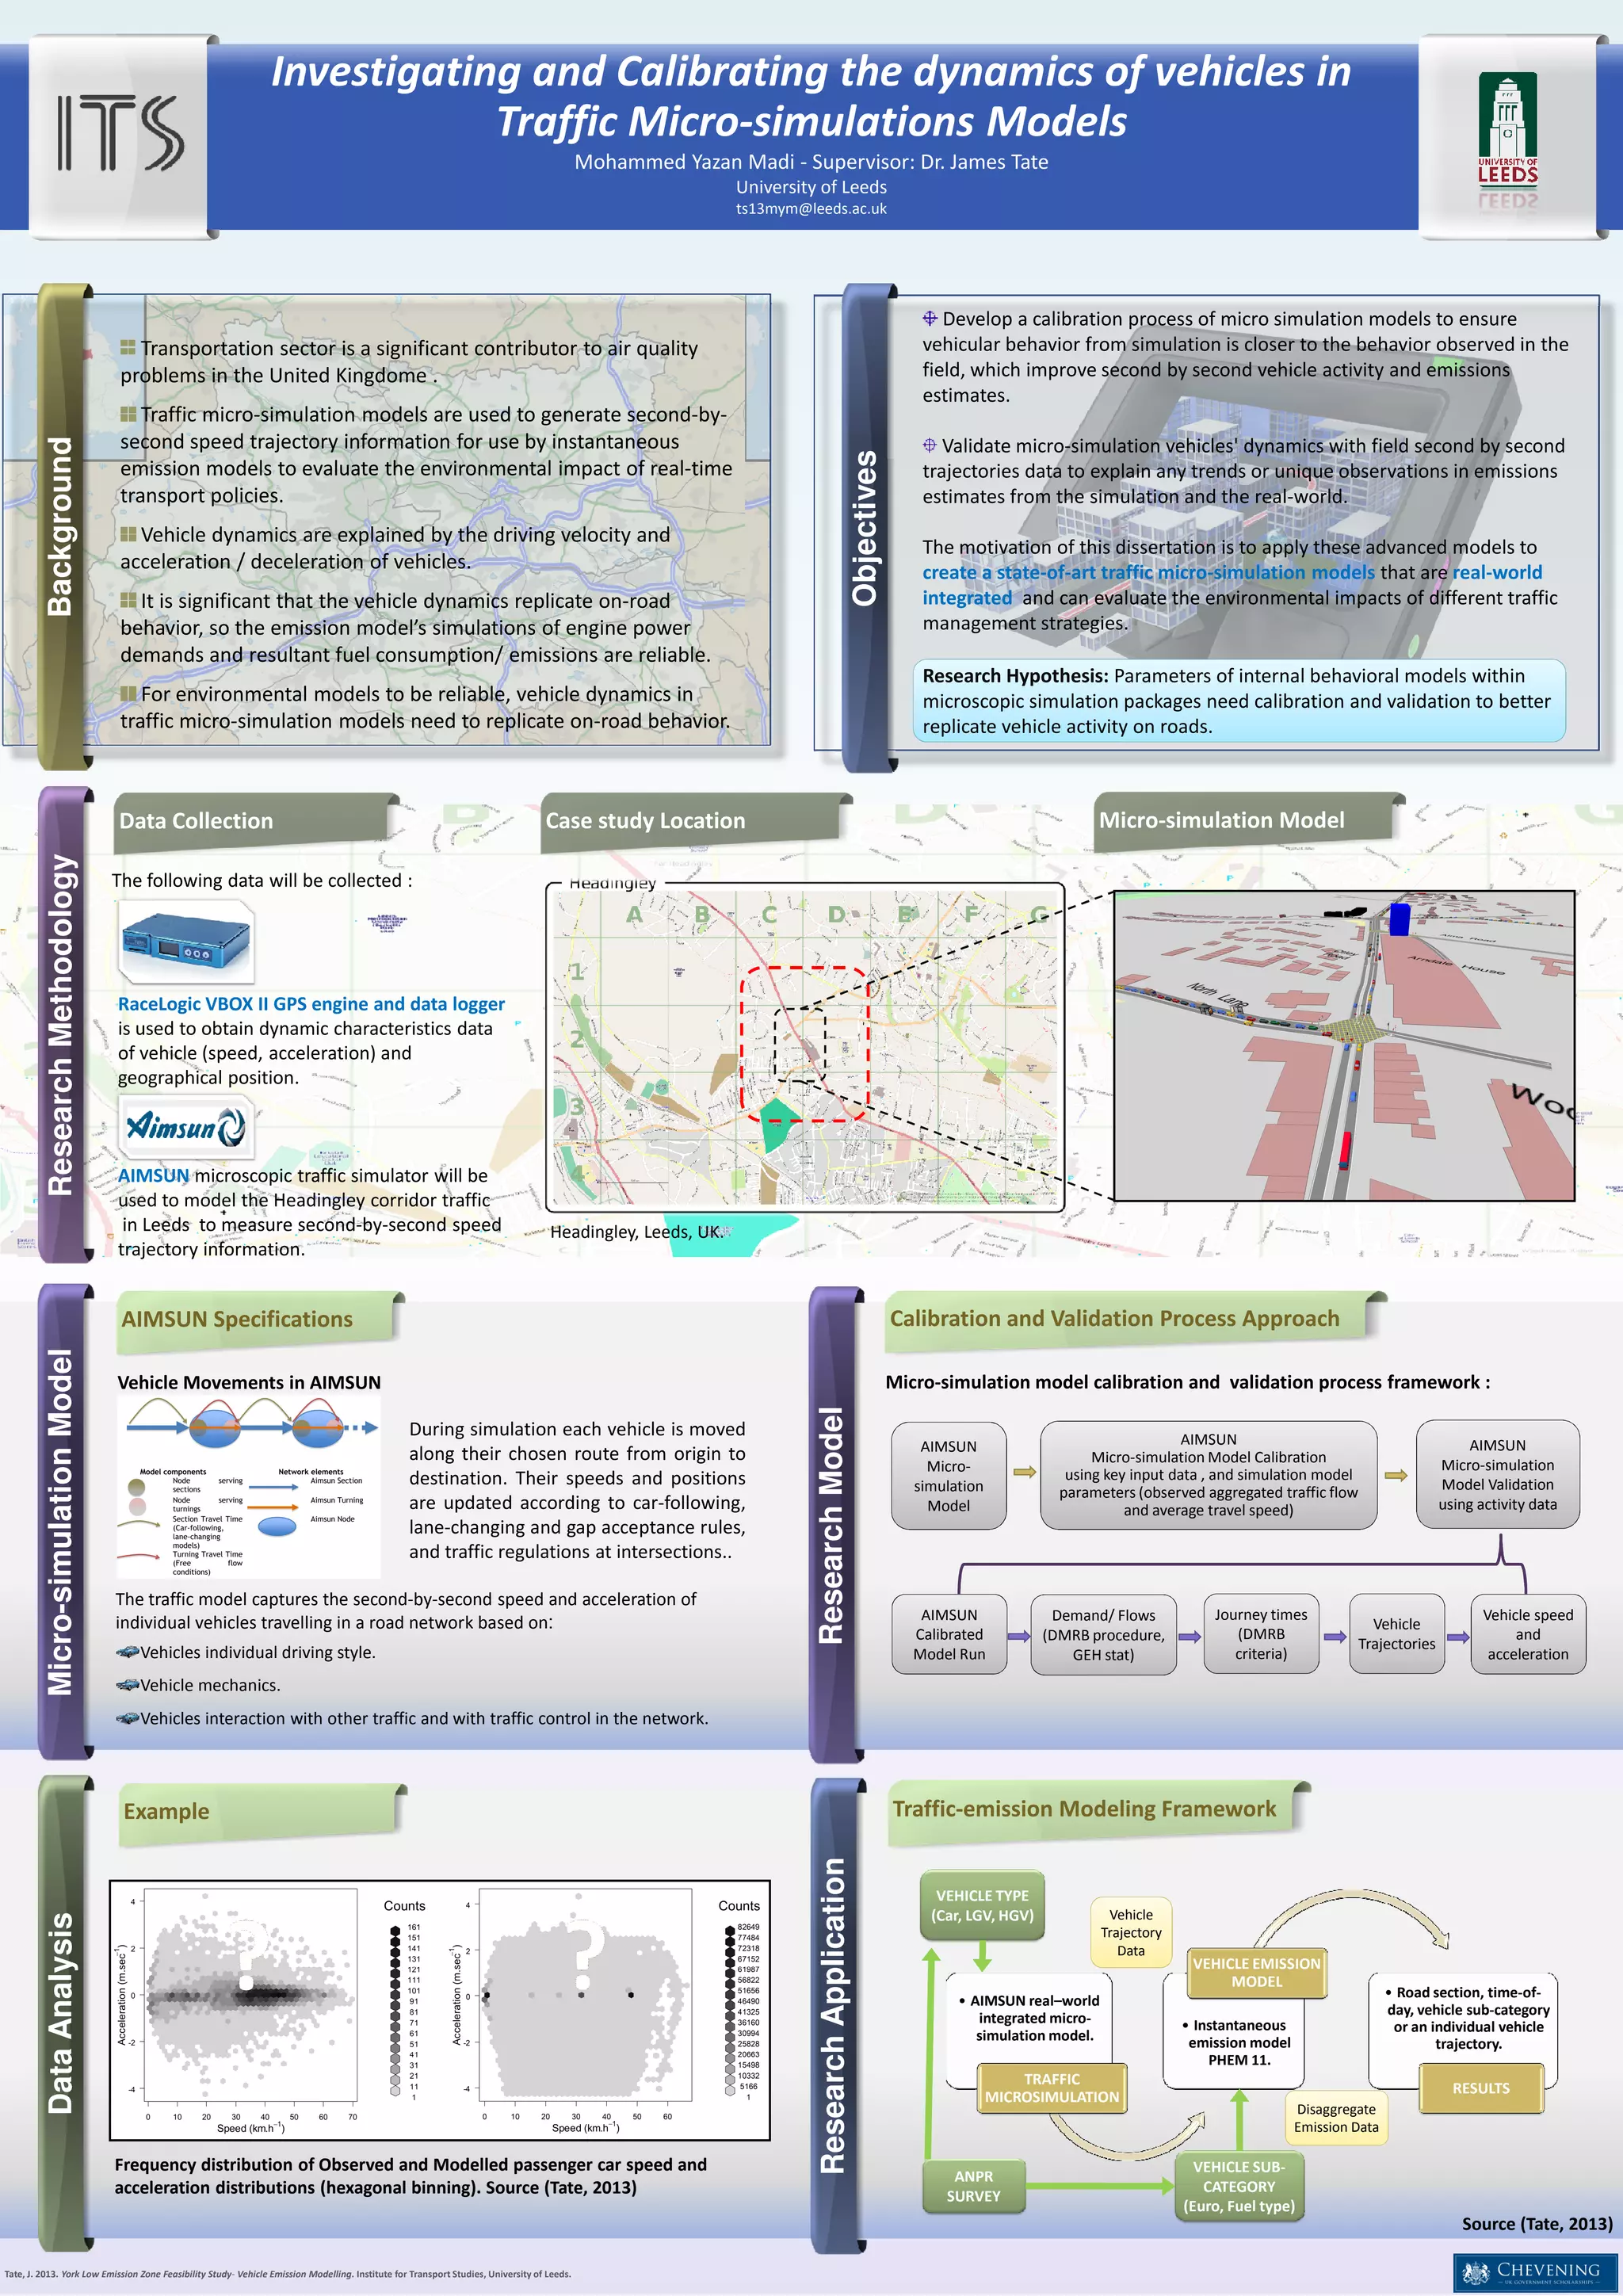
Road Pricing: A Case of Competing Private Road Toll Operators
The study intends to:
• Study techniques of identifying Nash Equilibrium for multiple toll
operators;
• Examine toll levels that ensure private operators maximise
revenue and meet the Nash Equilibrium conditions;
• Establish how revenue maximising tolls compare with social
welfare maximising tolls.
By Jonah Mumbya | Supervisor – Mr. Andrew Koh | Second Reader – Dr. Chandra Balijepalli
Introduction
Objectives
Motivation
Effects of Increasing Congestion Environmental Costs of Traffic Government Budget Constraints
• Global costs of congestion are high and
projected to increase with increasing
traffic delays;
• In UK, congestion costs (due to delay)
stood at £20bn in 2000 and projected to
increase to £30bn by 2020;
• NTM projects traffic to grow by 43% as a
result of a 66% GDP growth from 2010-
2040 in England alone;
• This would lead to congestion increasing
by 114% and lost seconds per mile would
increase by 36% hence cost as travel
speeds would reduce by 8%.
• Transport is the third largest
contributor to global warming
just behind energy (electricity
and heating) and industry;
• In UK, Road transport
contributed over 27% to
Green House Gasses with
cars having 58% of this in
2009;
• With increasing motorisation,
this is likely to be the same or
worse with time.
• Governments are continually
getting constrained to finance
road infrastructure using
traditional budget
appropriations;
• Hence road users ought to
meet part of the road
infrastructure investment
costs/budgets;
• Road pricing supports about
32% of Norway’s national road
system budget and 46% of
Spain's road budget.
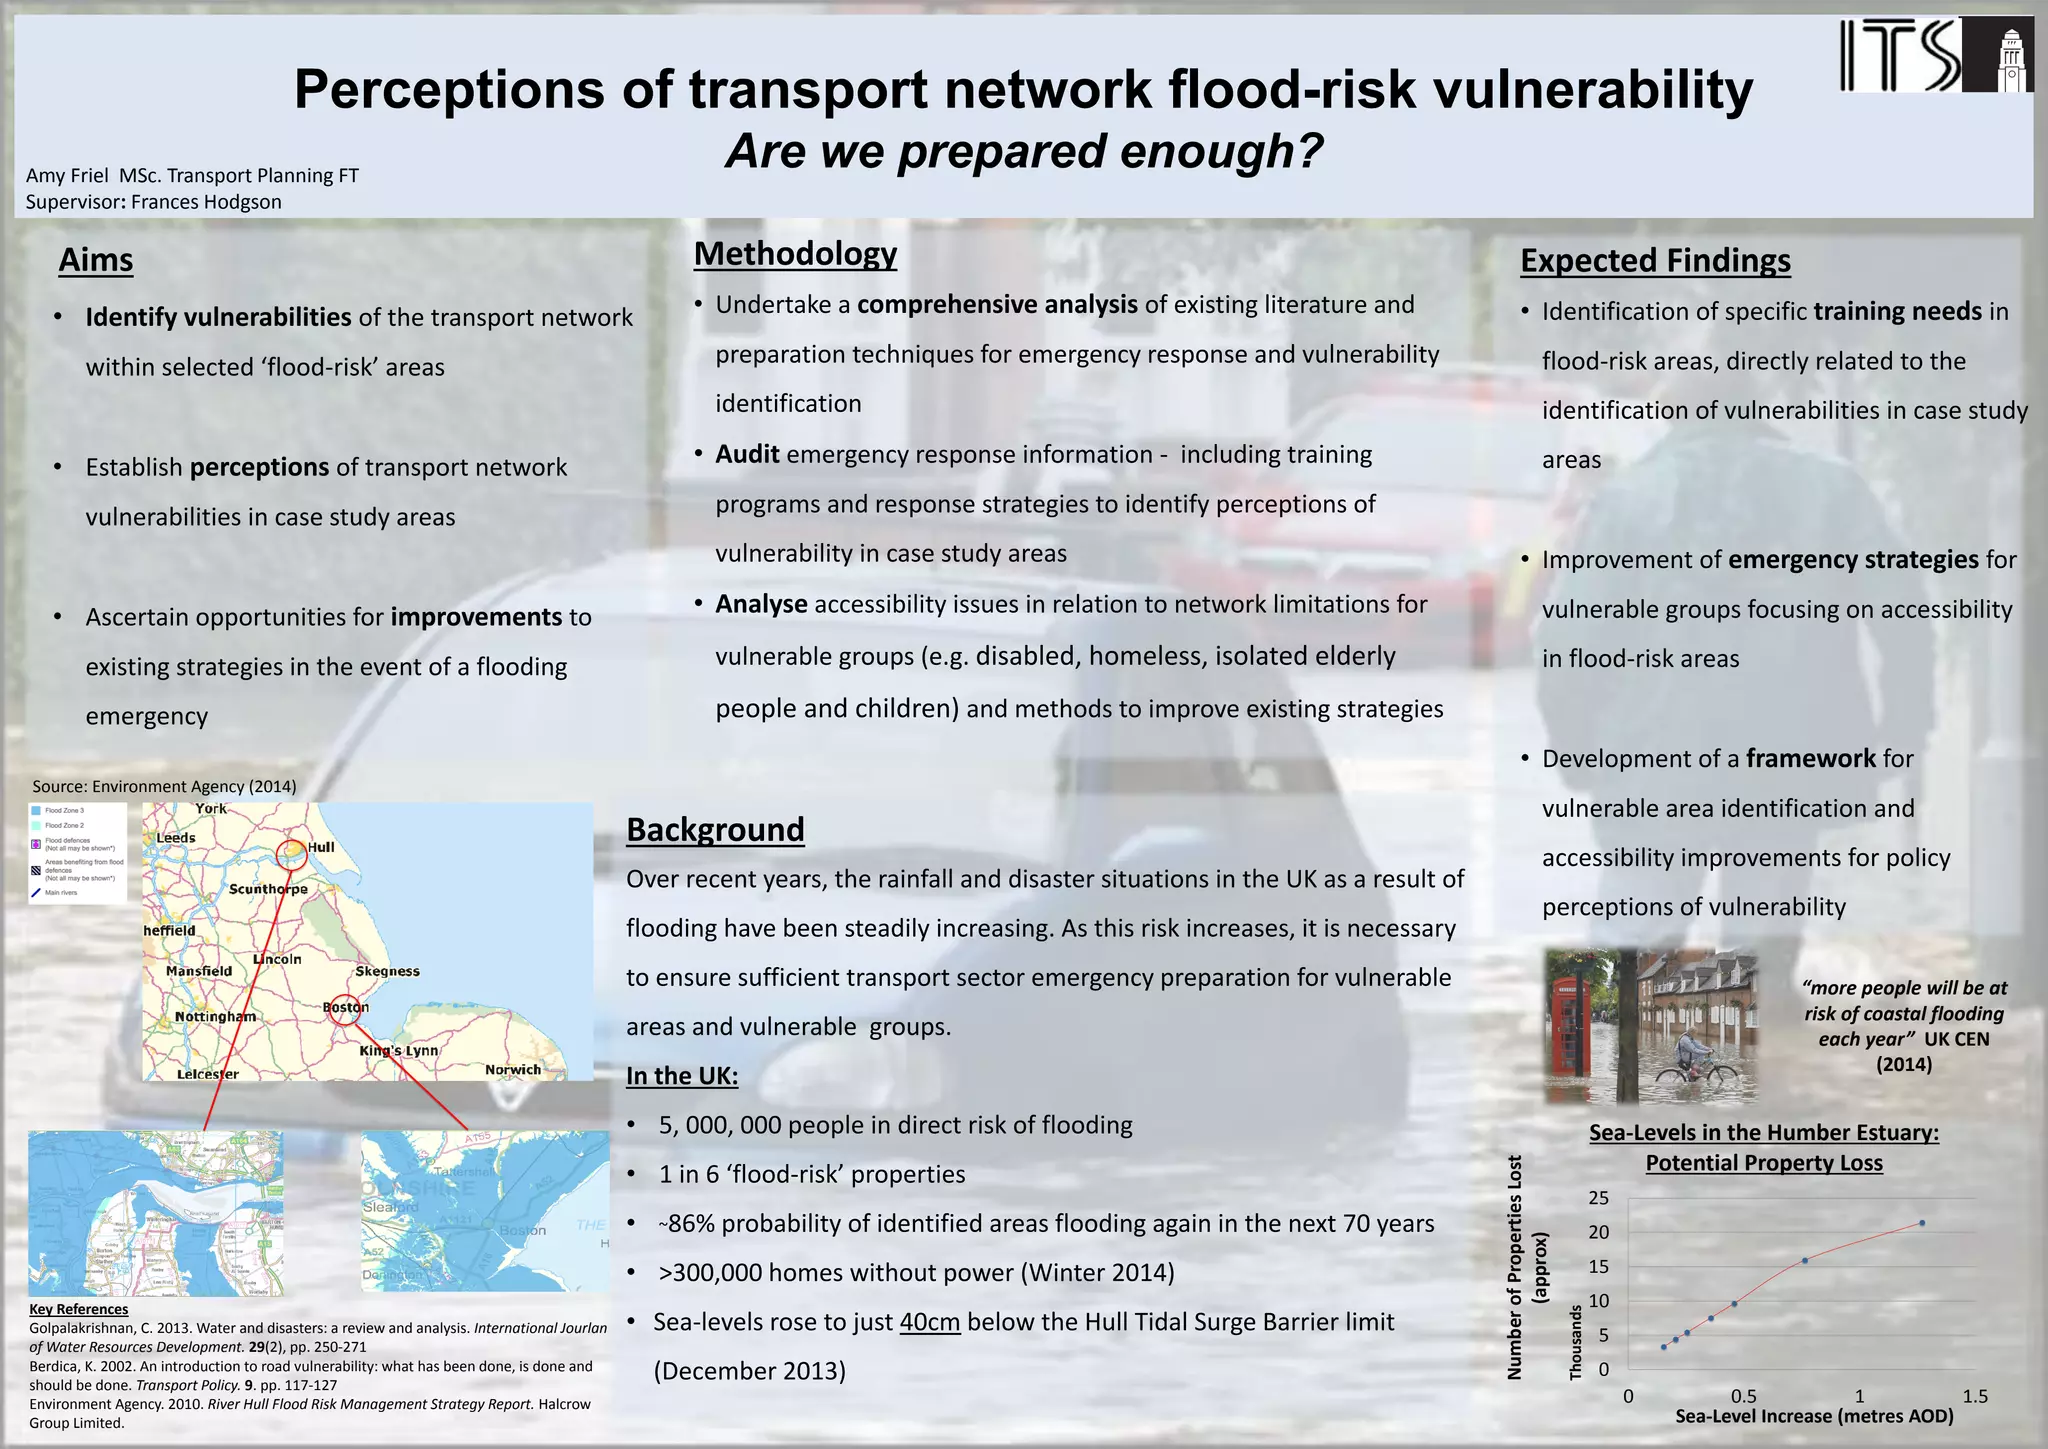
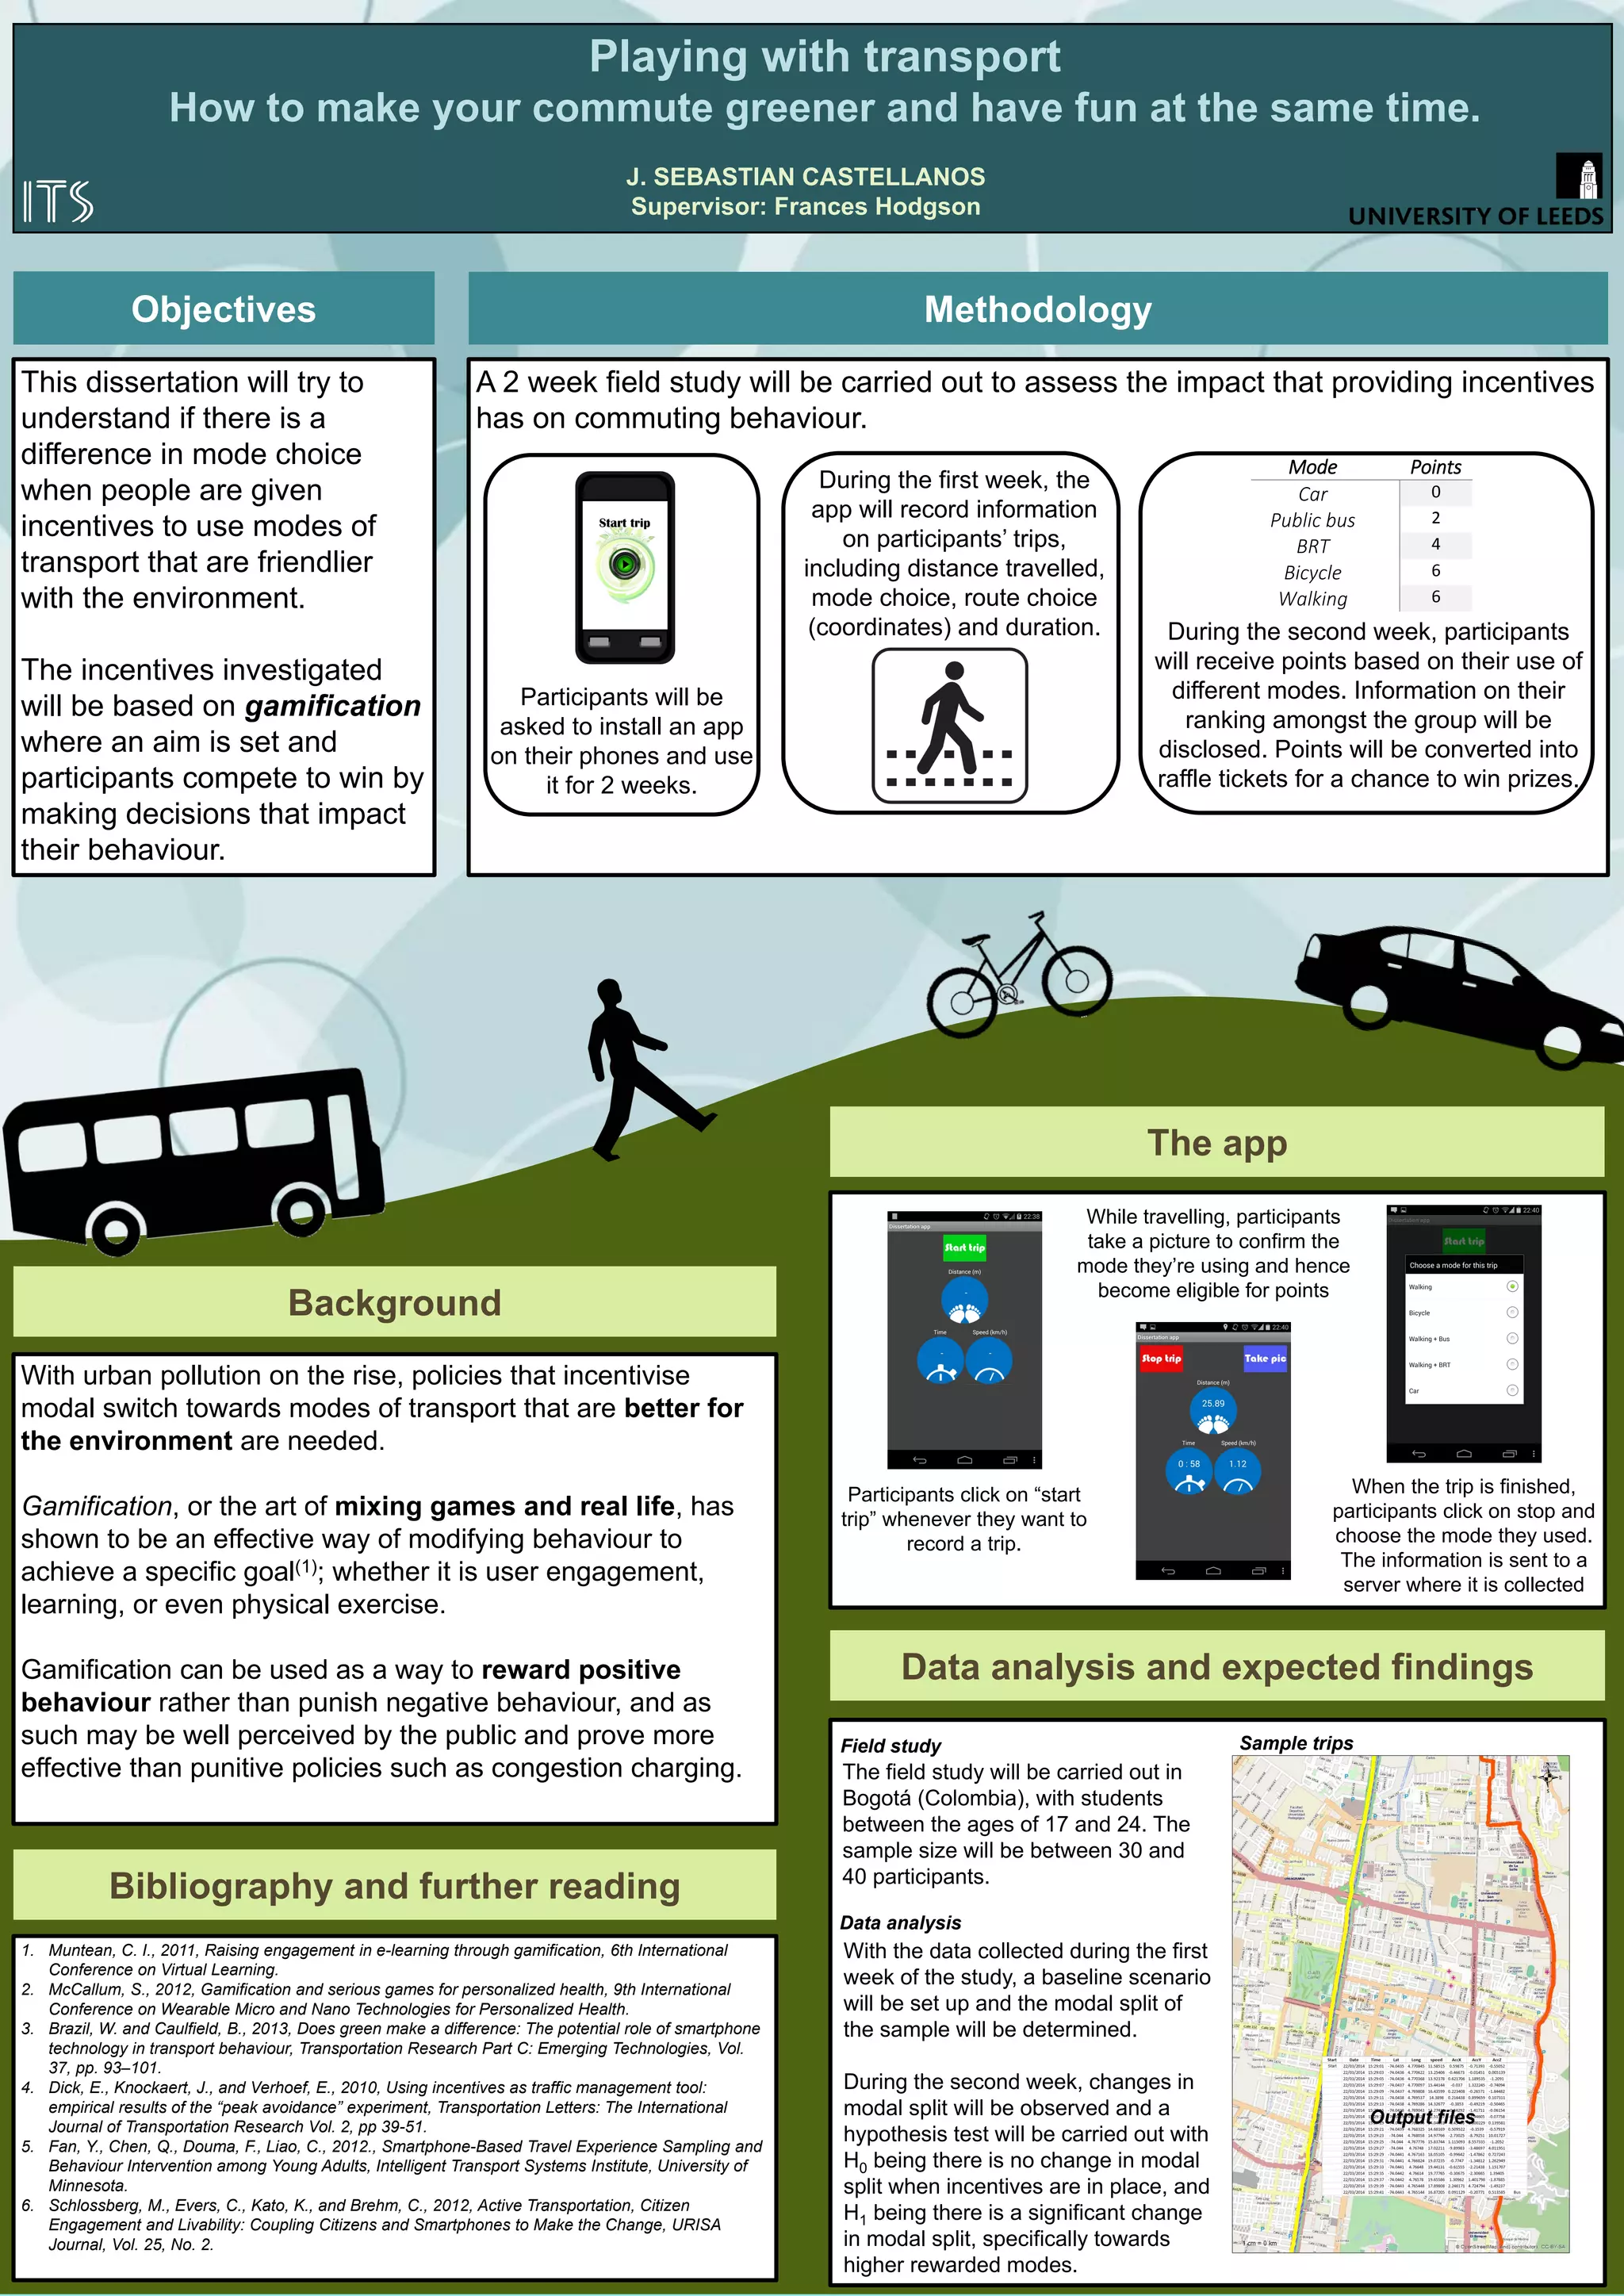
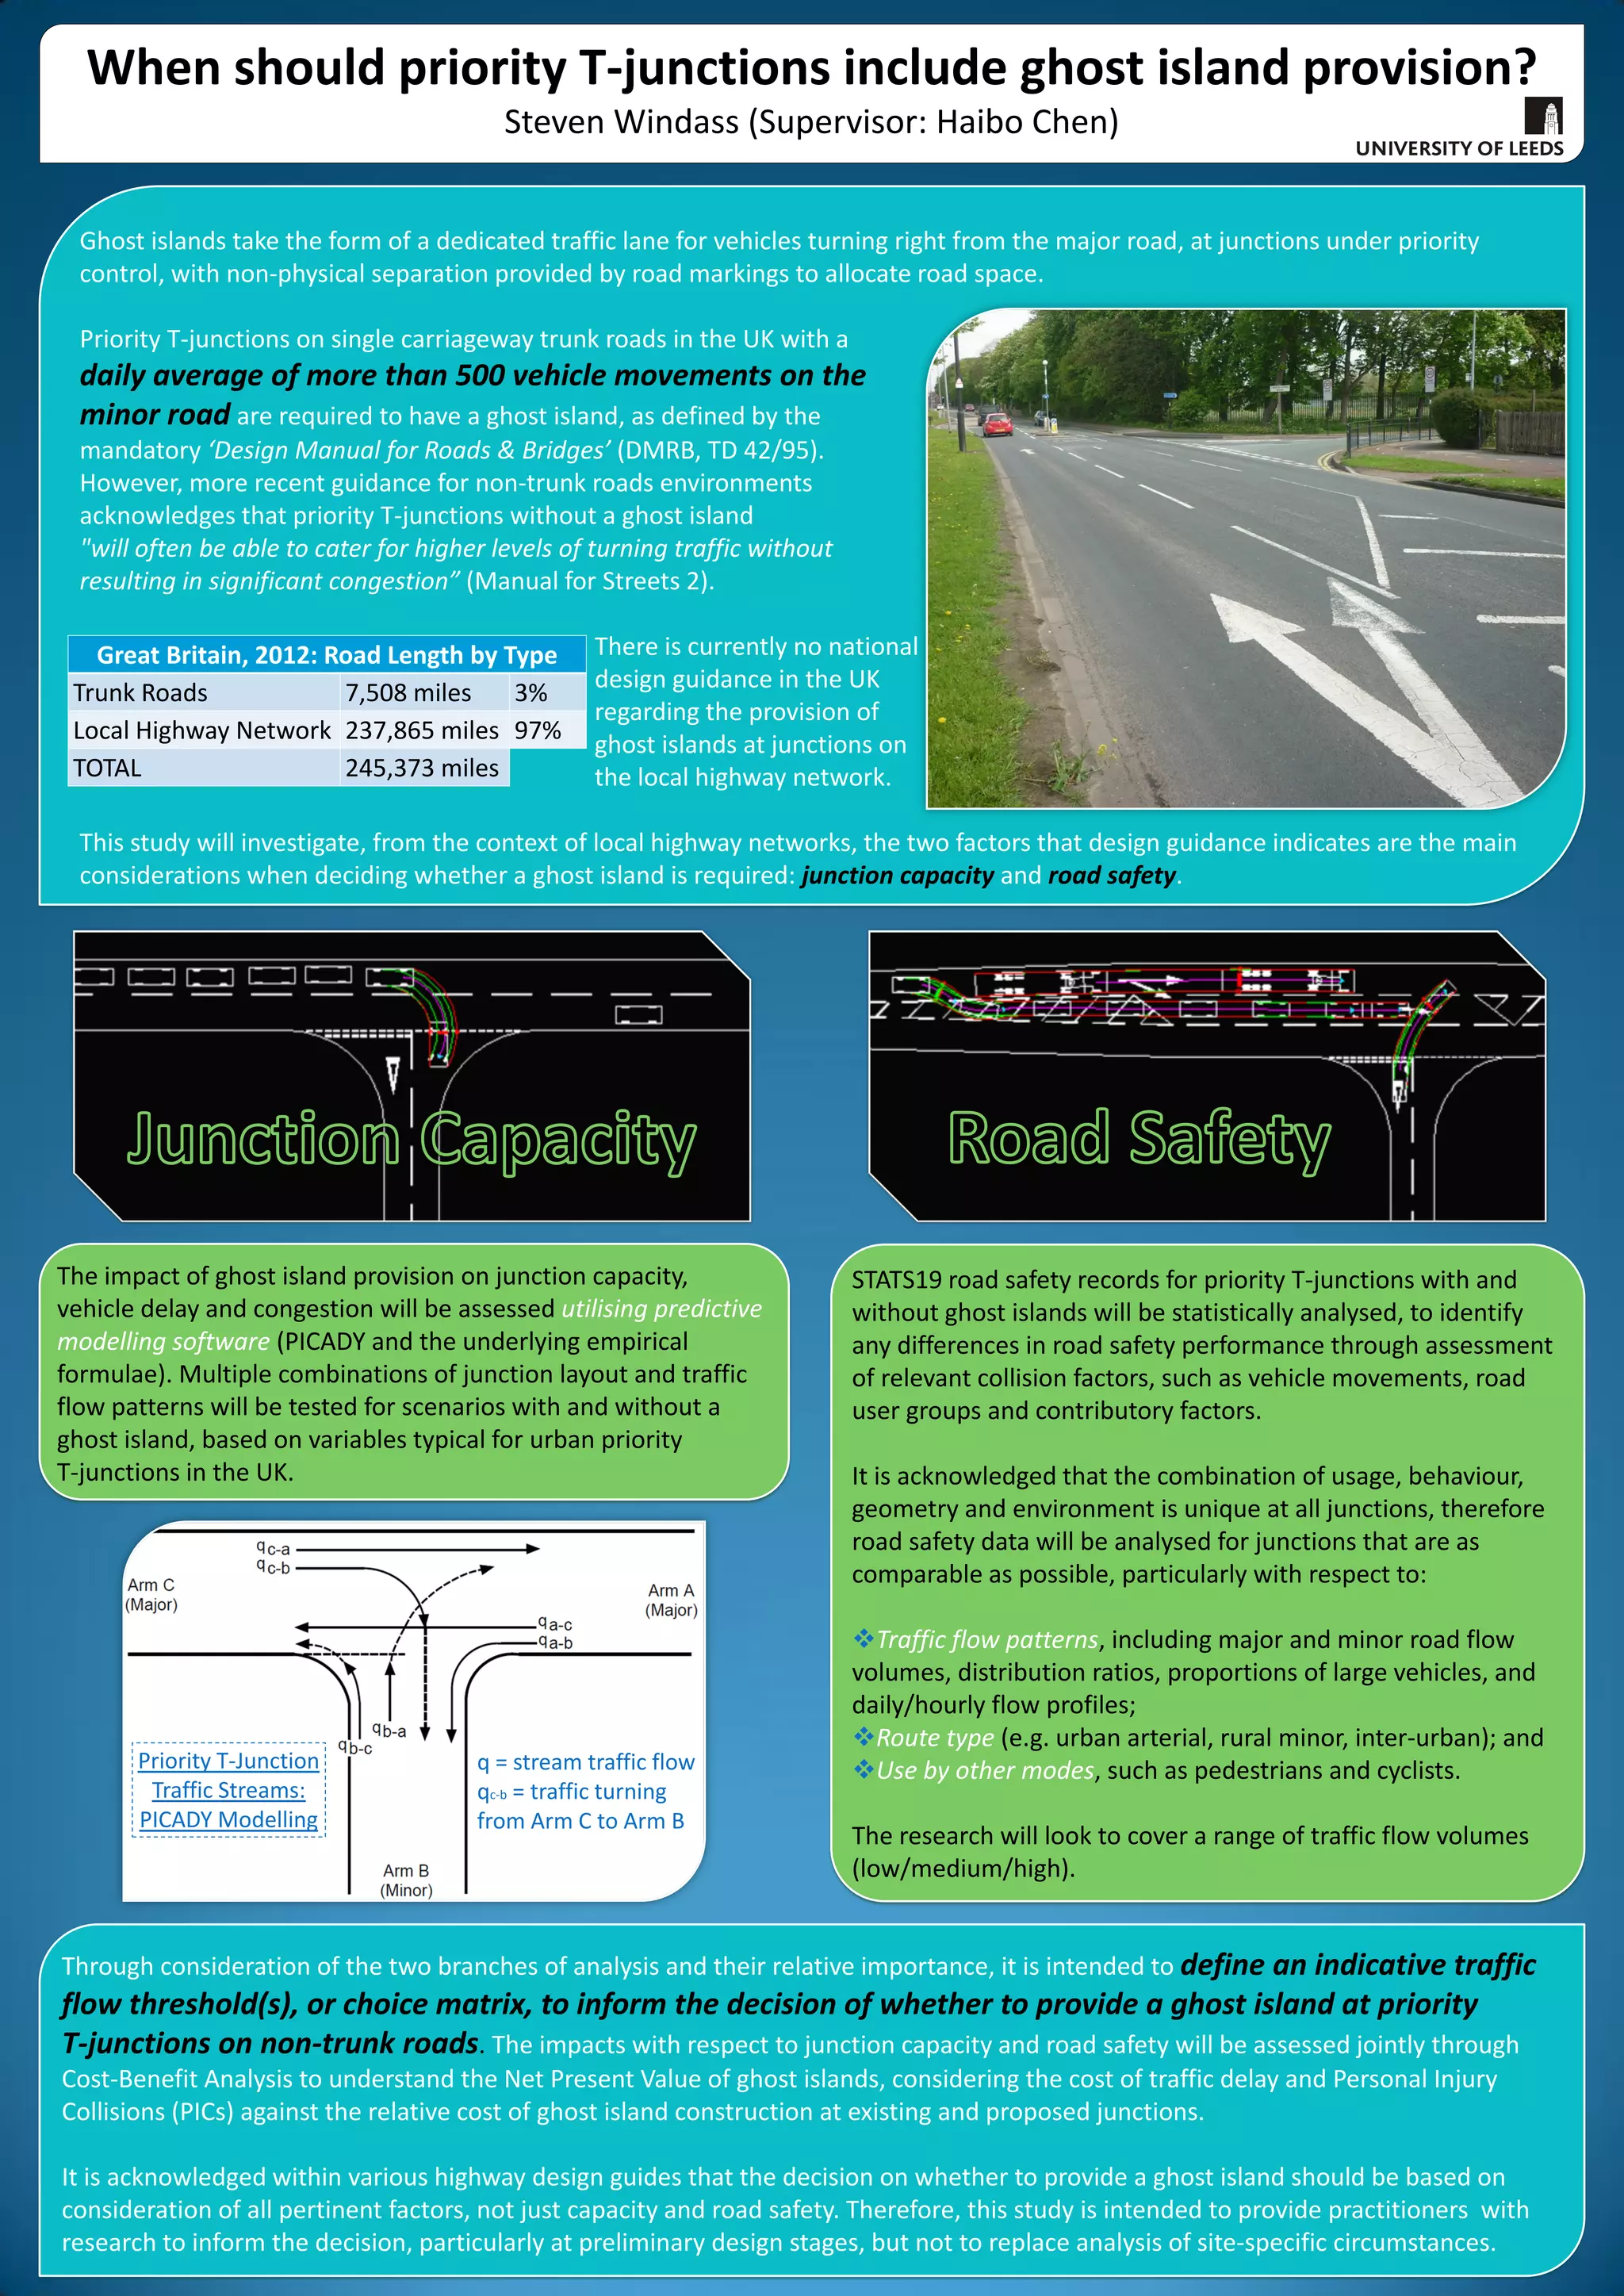
Methodology
a) Link Selection;
Link selection shall be based on the difference
between link marginal cost and average cost and the
level of congestion of the do-nothing scenario.
b) Determine Tolls;
Iteratively, tolls will be set until a Nash Equilibrium is
achieved for the competing toll operators.
c) Traffic Assignment;
Using SATURN, traffic shall be assigned to the
network based on Wardrop’s first equilibrium
principle.
d) Calculation of Revenue and Benefits.
Based on assigned link flows from SATURN,
revenues and social benefits will be calculated.
Test Network – Edinburgh
1
2
3
4 5
Select Links
[SATURN]
Set Tolls
Assign Traffic to
the Network
[SATURN]
Is Nash
Equilibrium
Achieved?
Calculate
Revenue and
Social
Benefits
No
Yes](https://image.slidesharecdn.com/allall-140515044924-phpapp01/75/Masters-Dissertation-Posters-2014-27-2048.jpg)
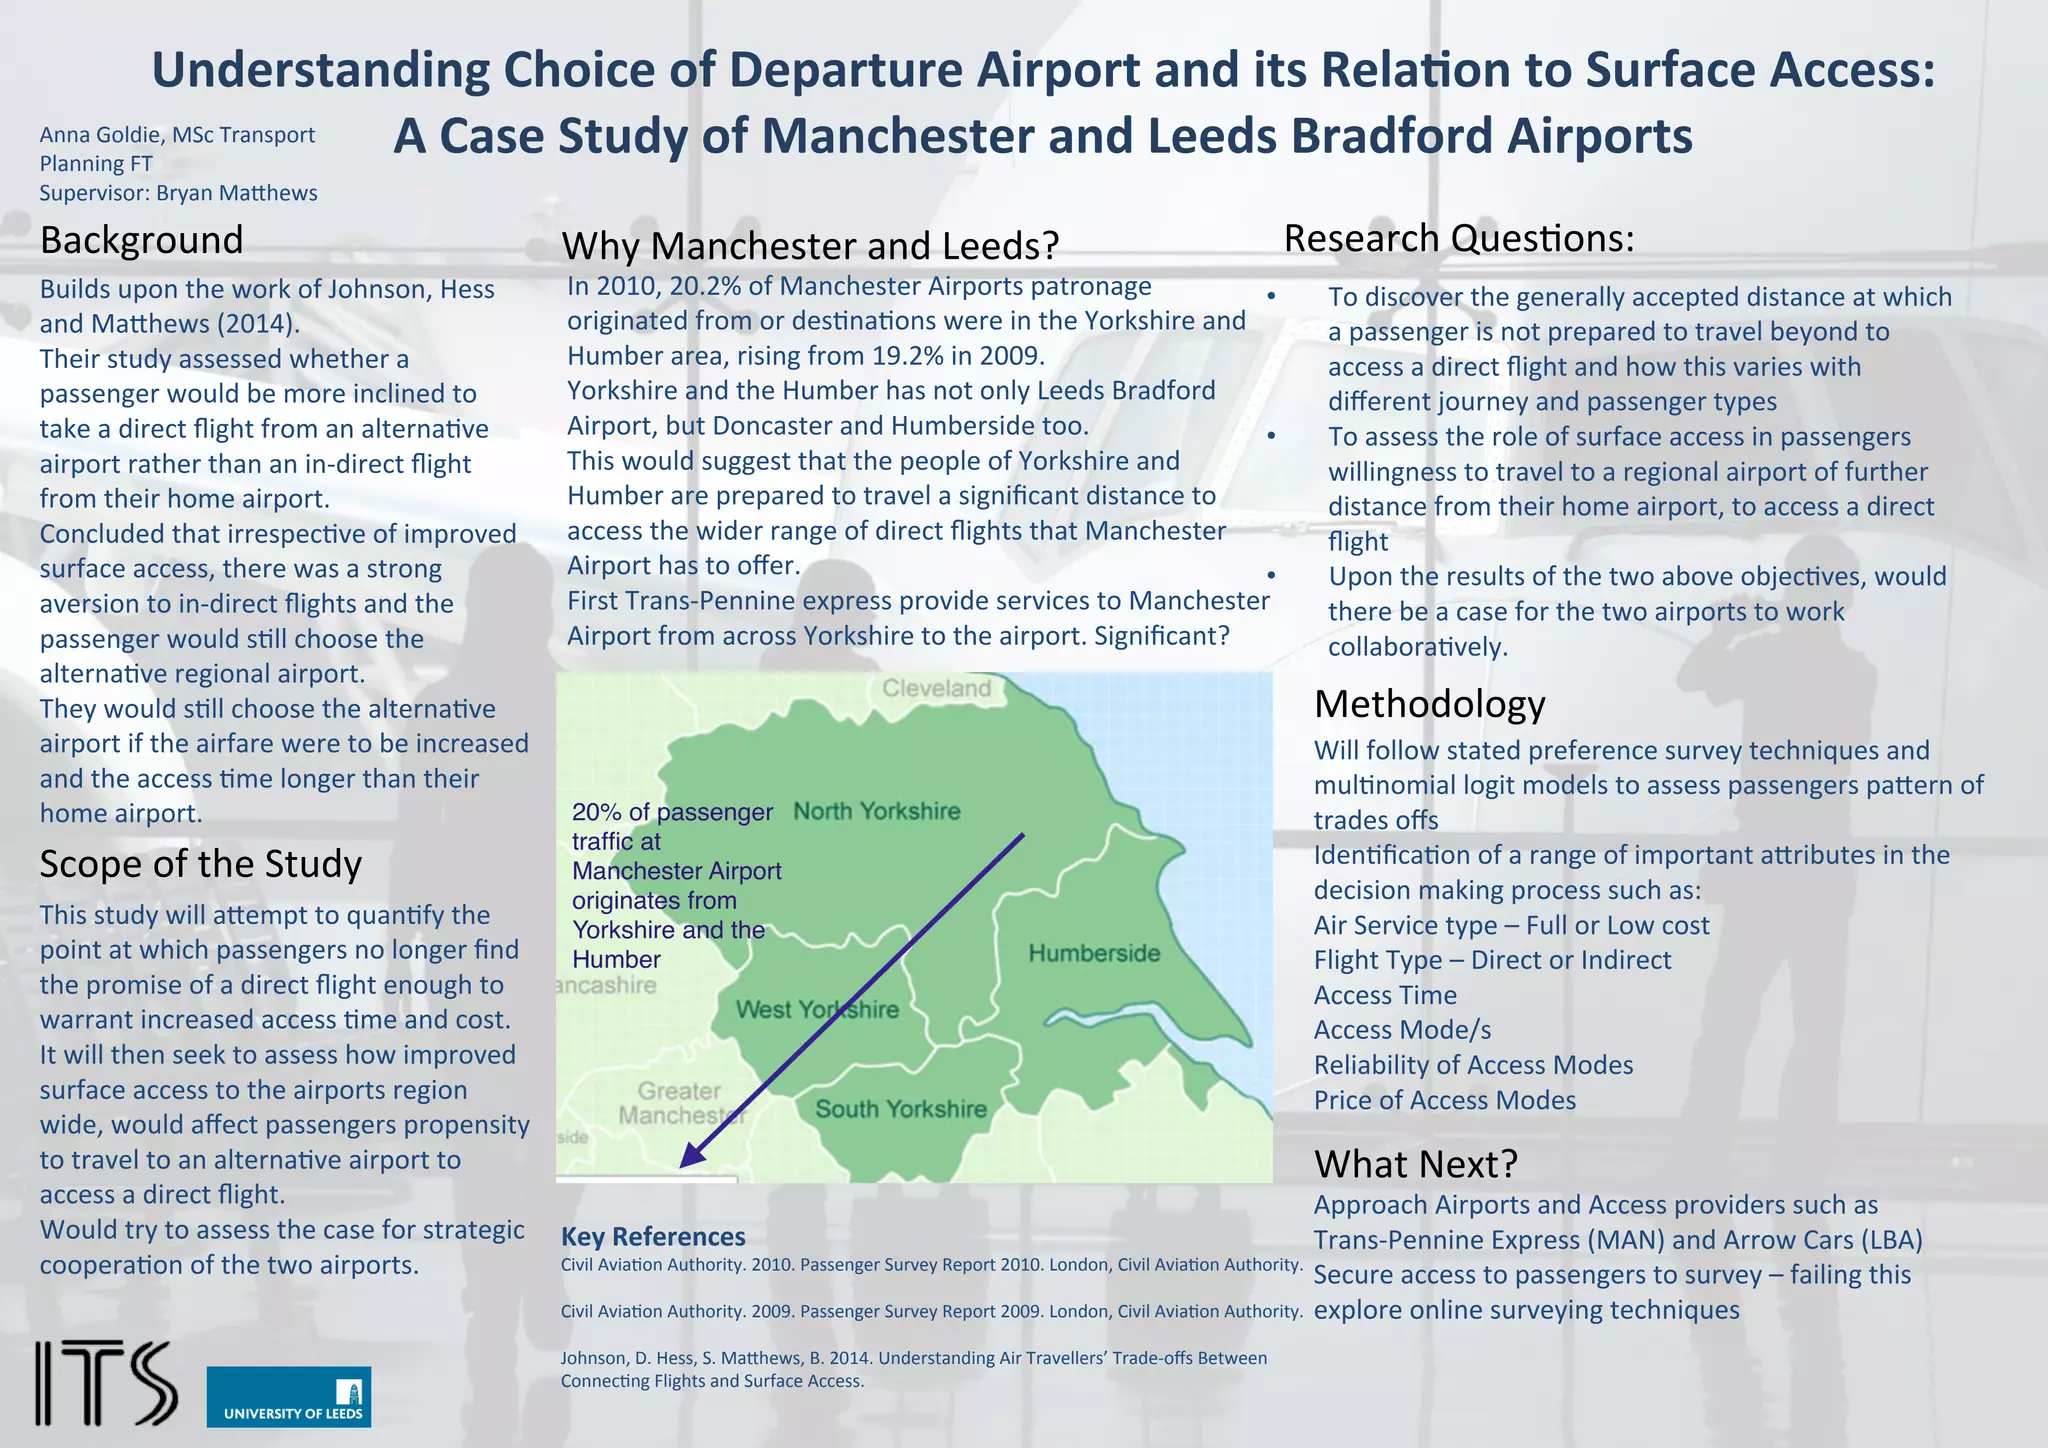
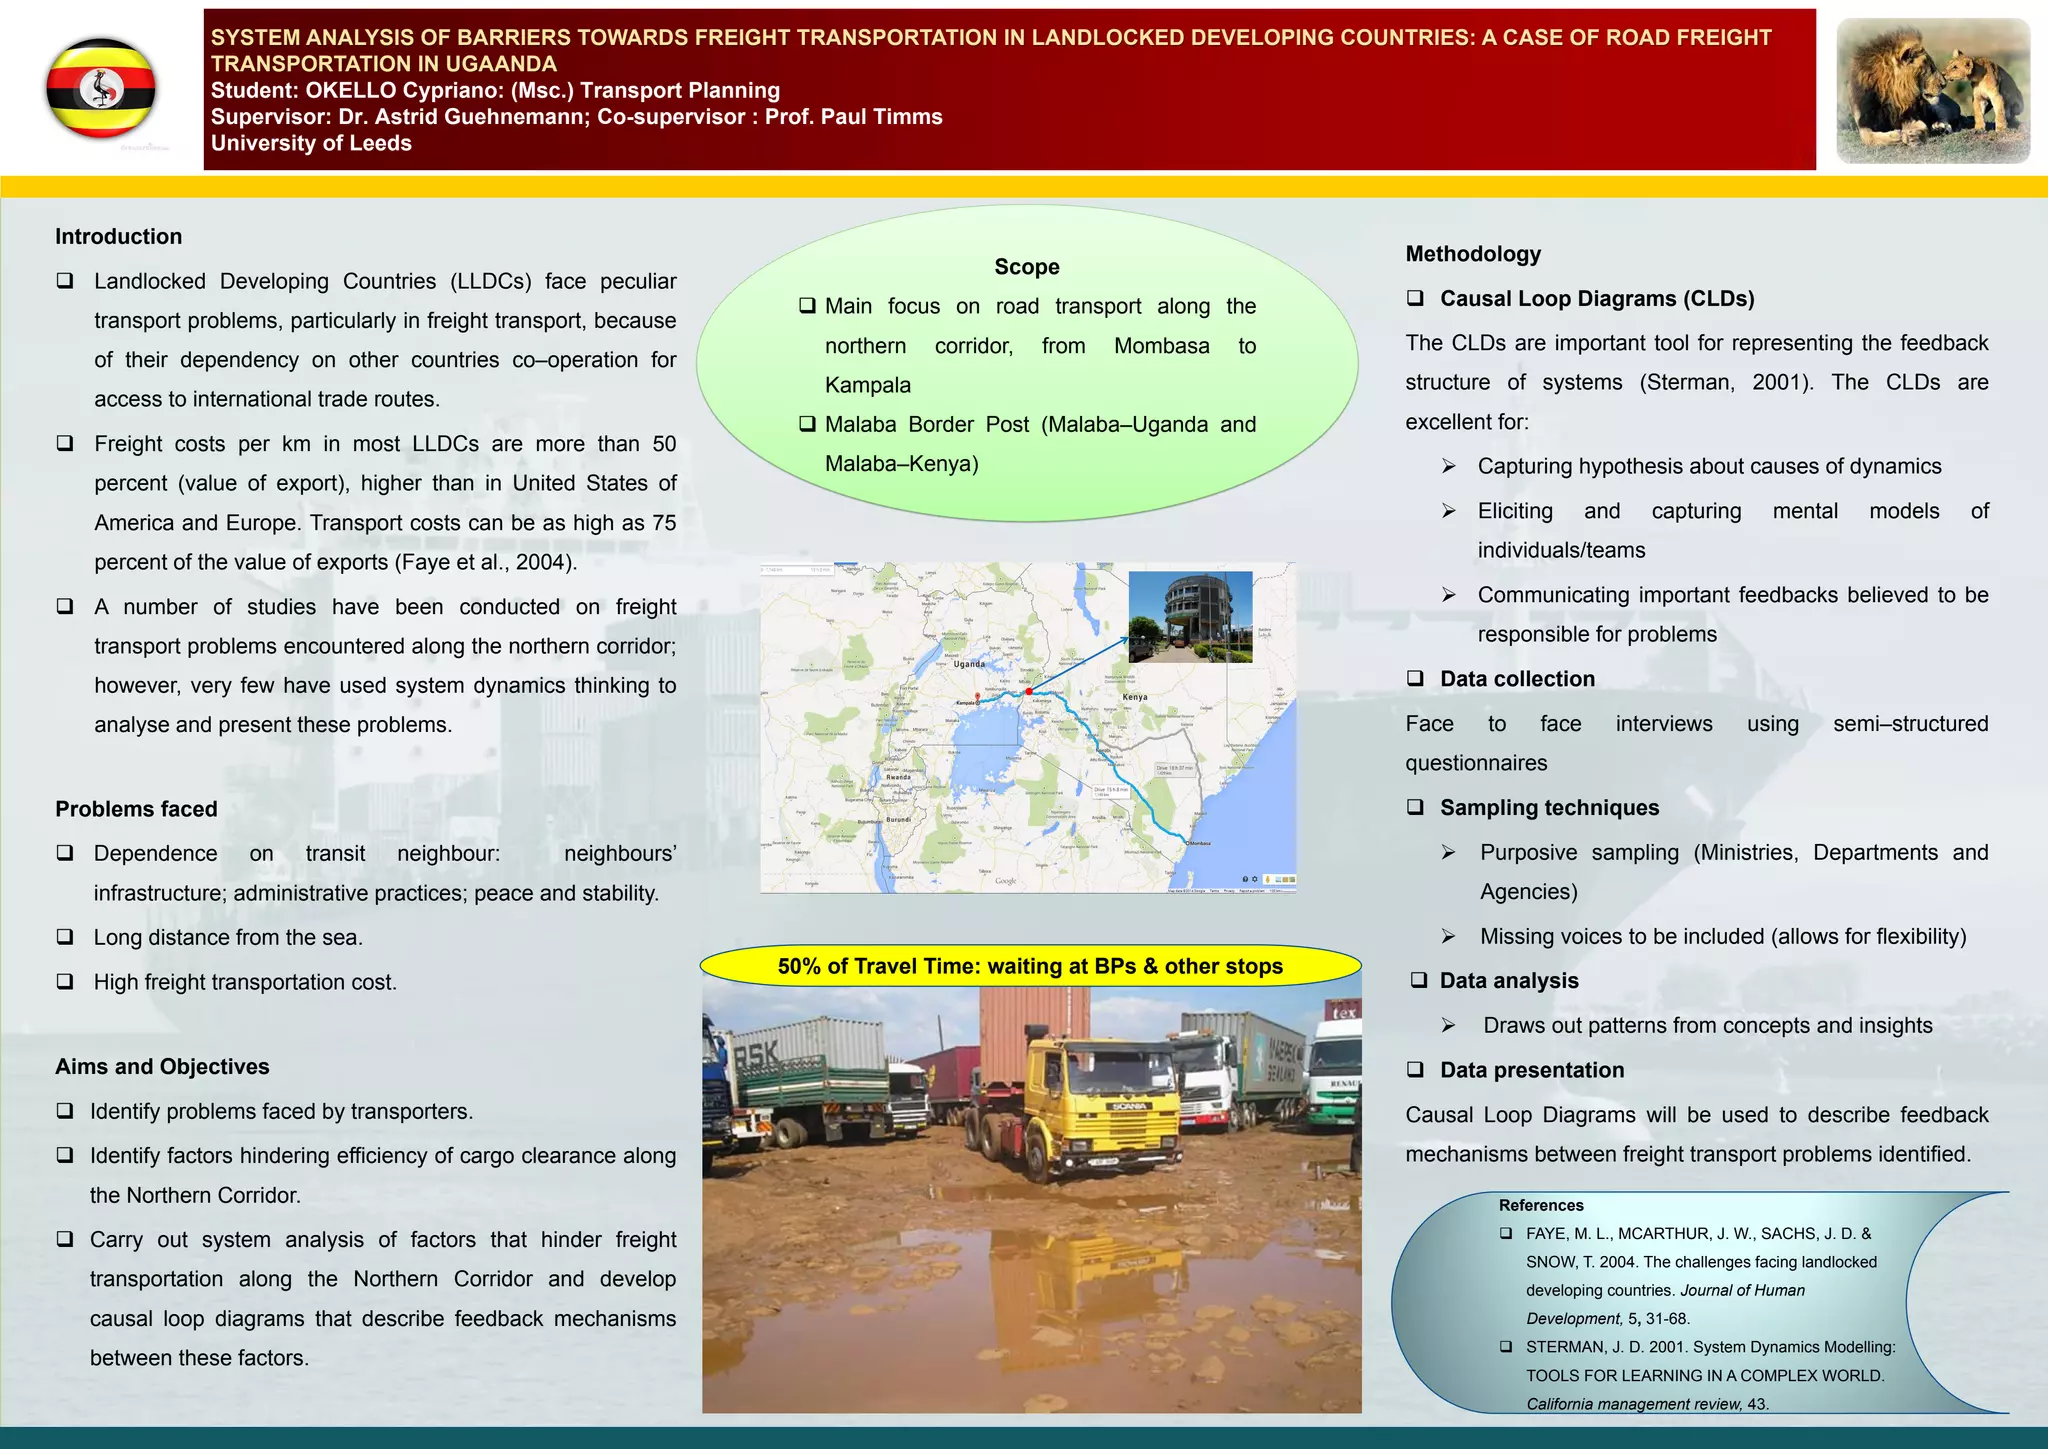
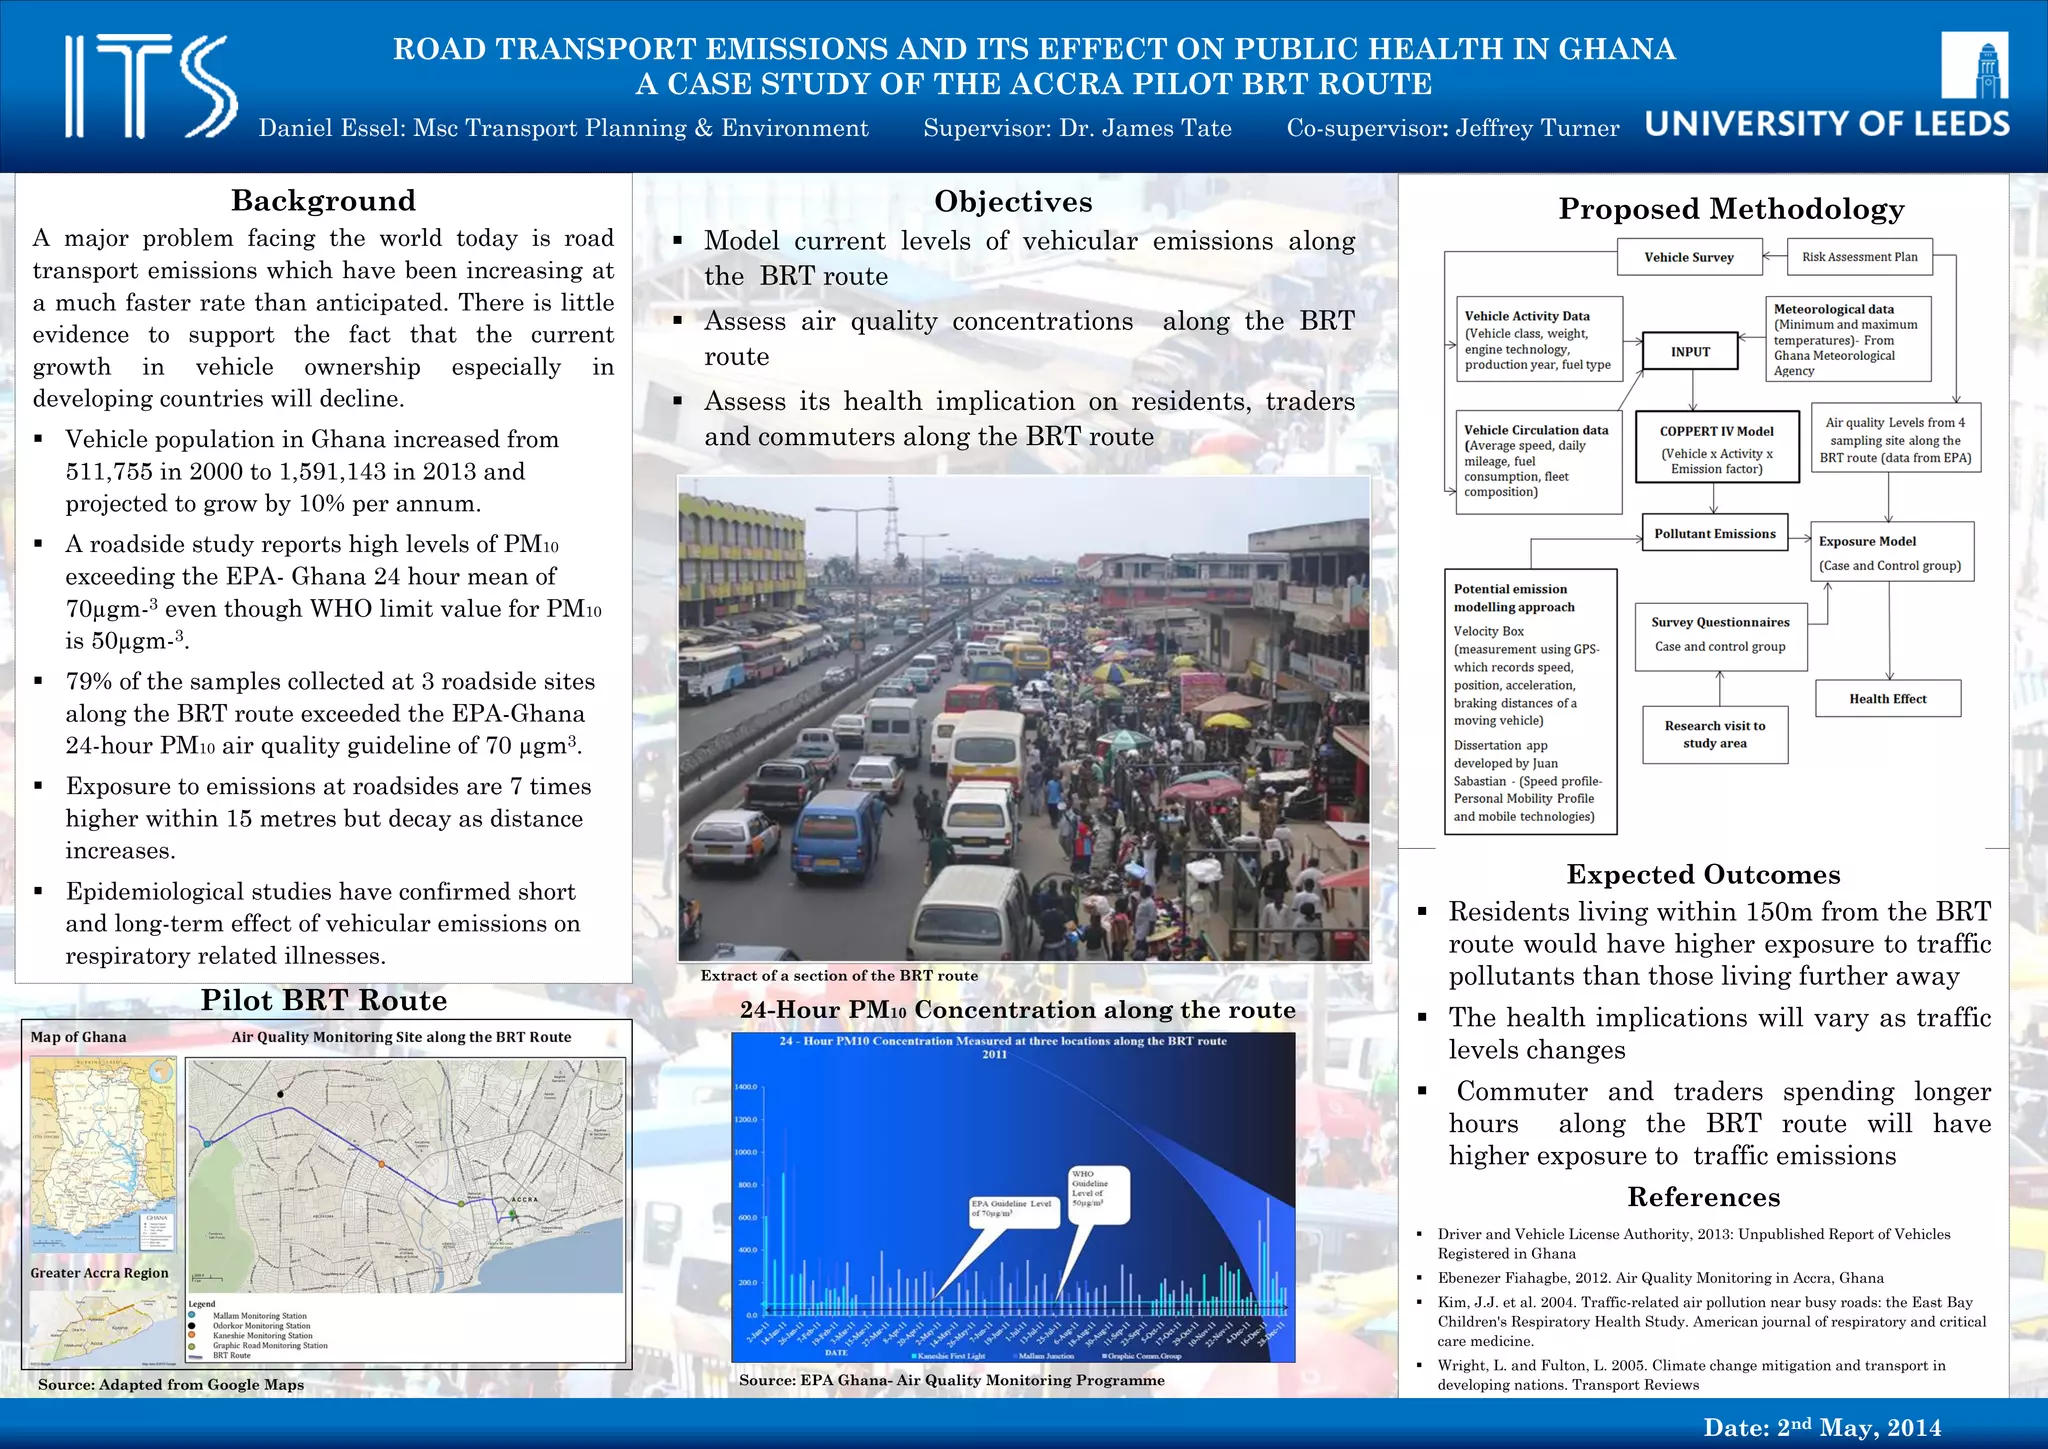
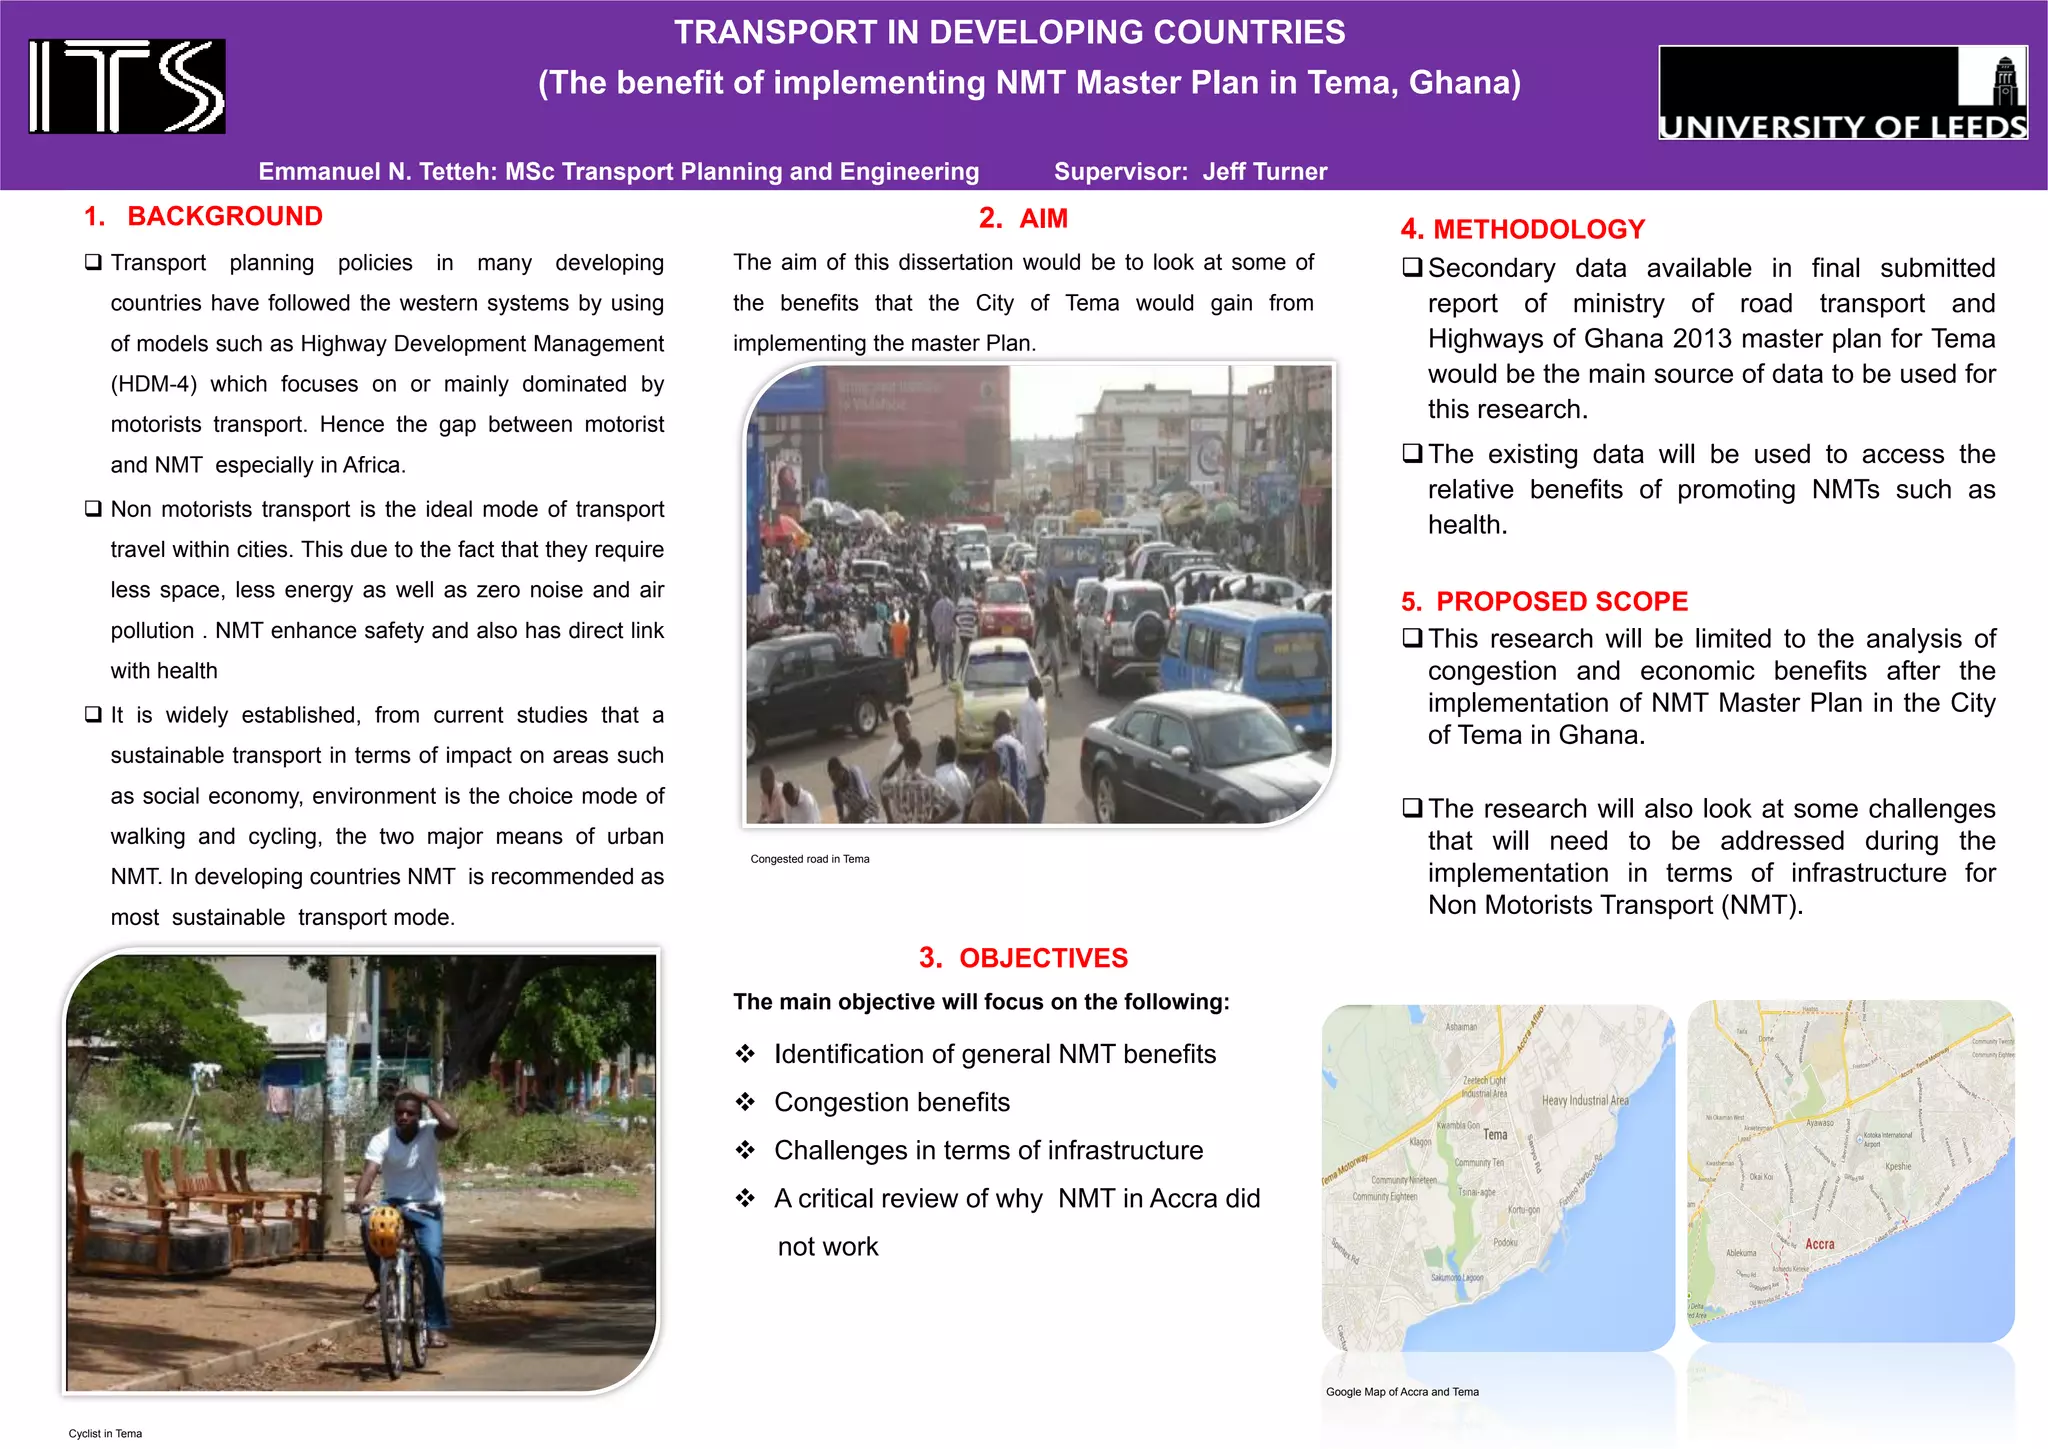
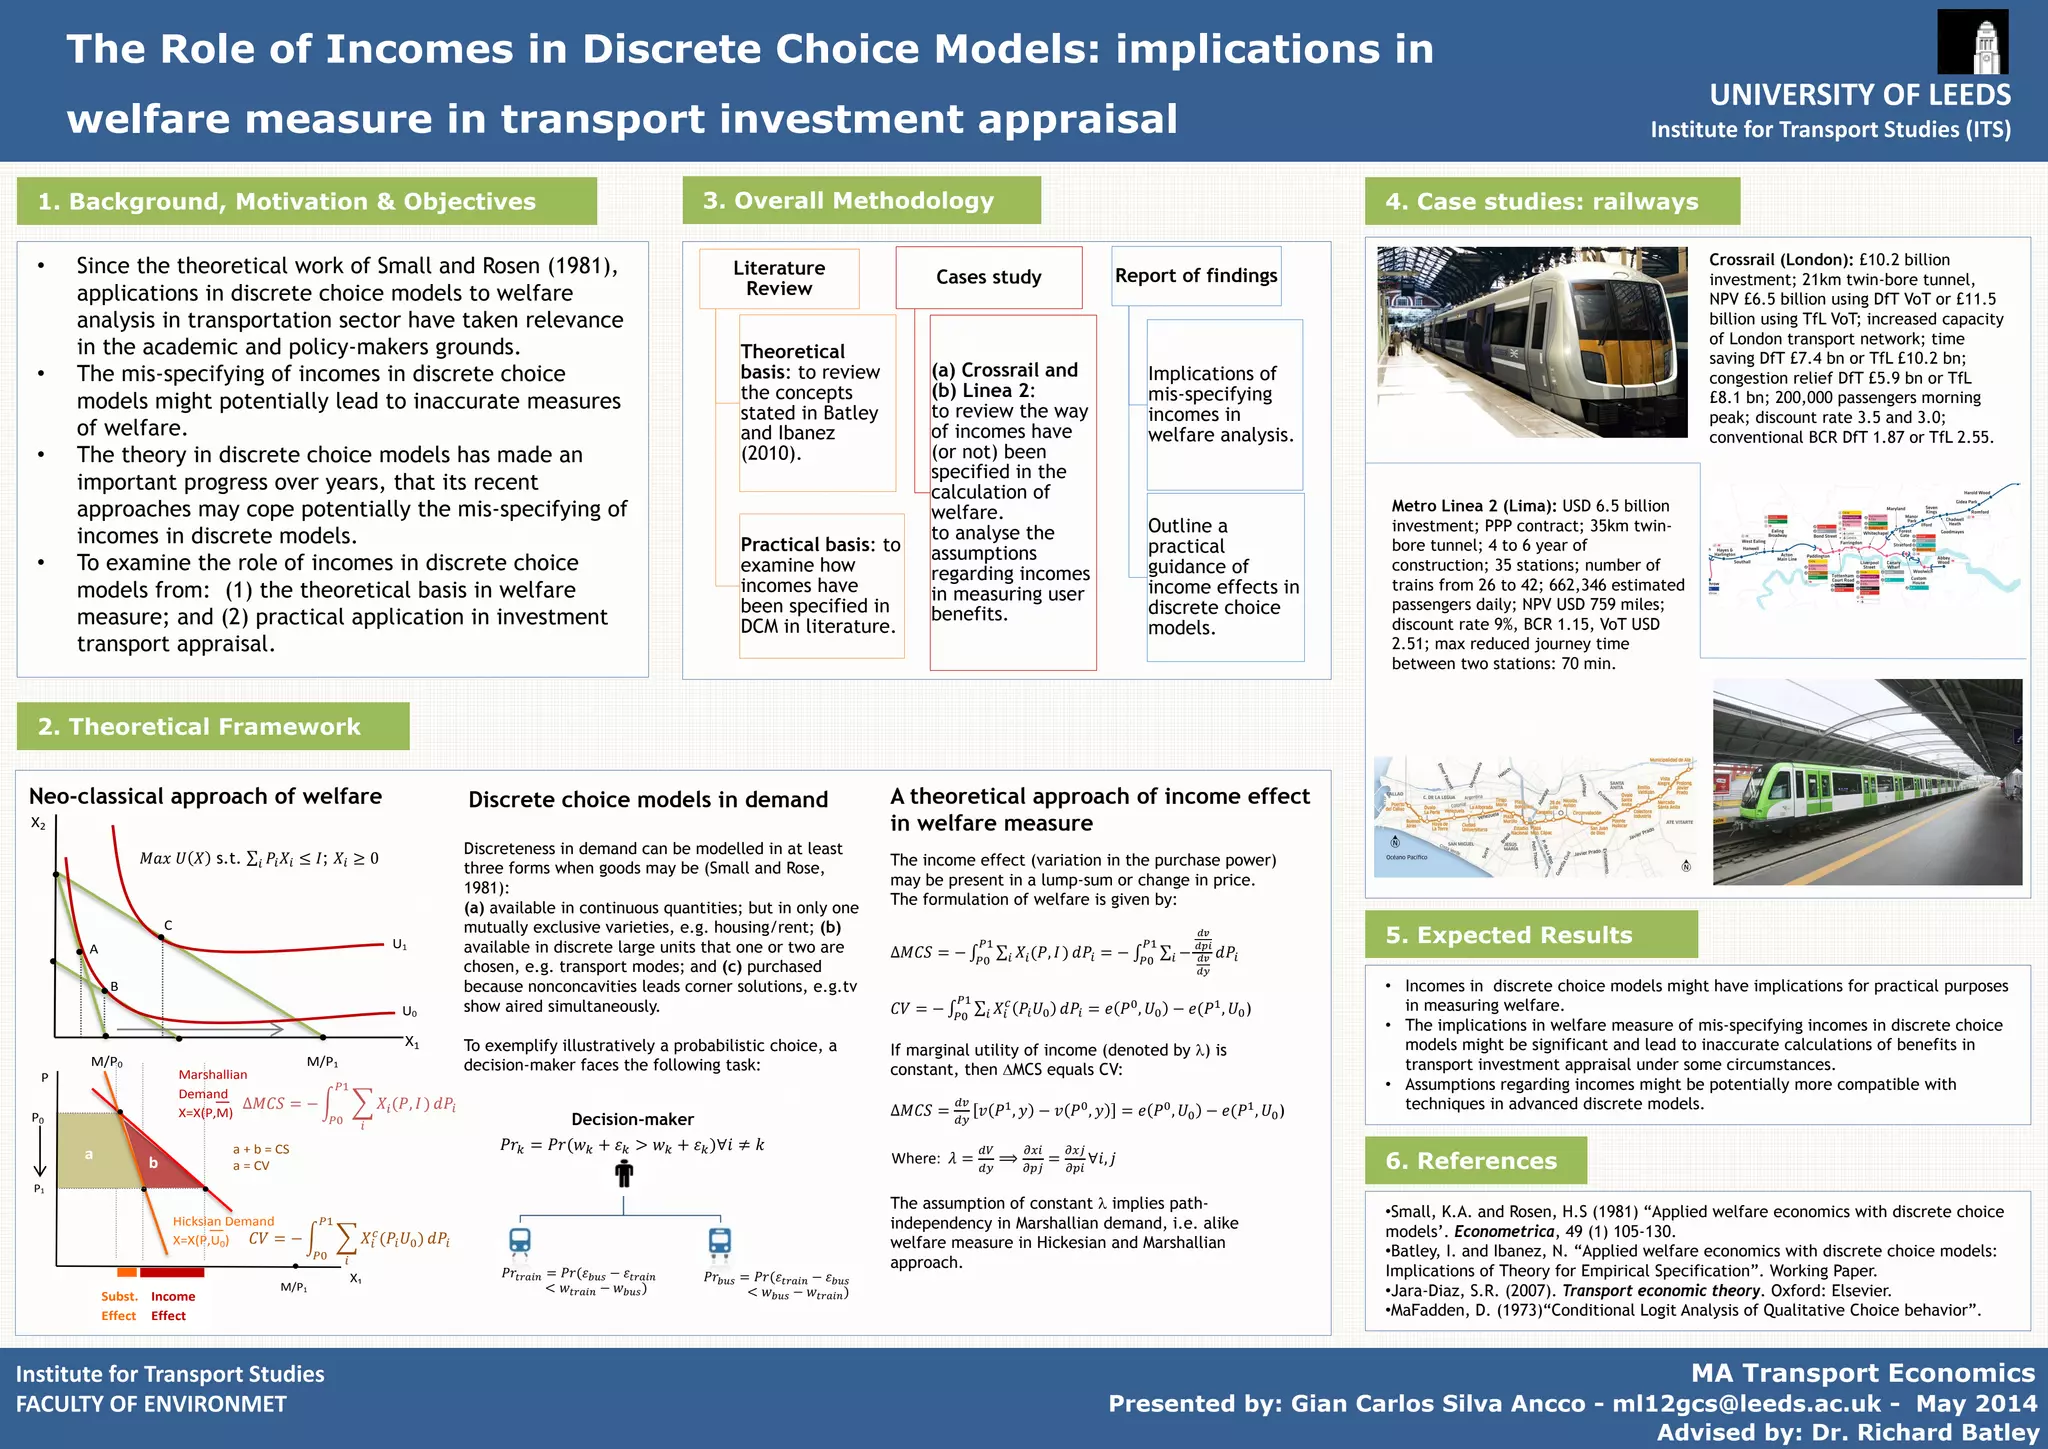
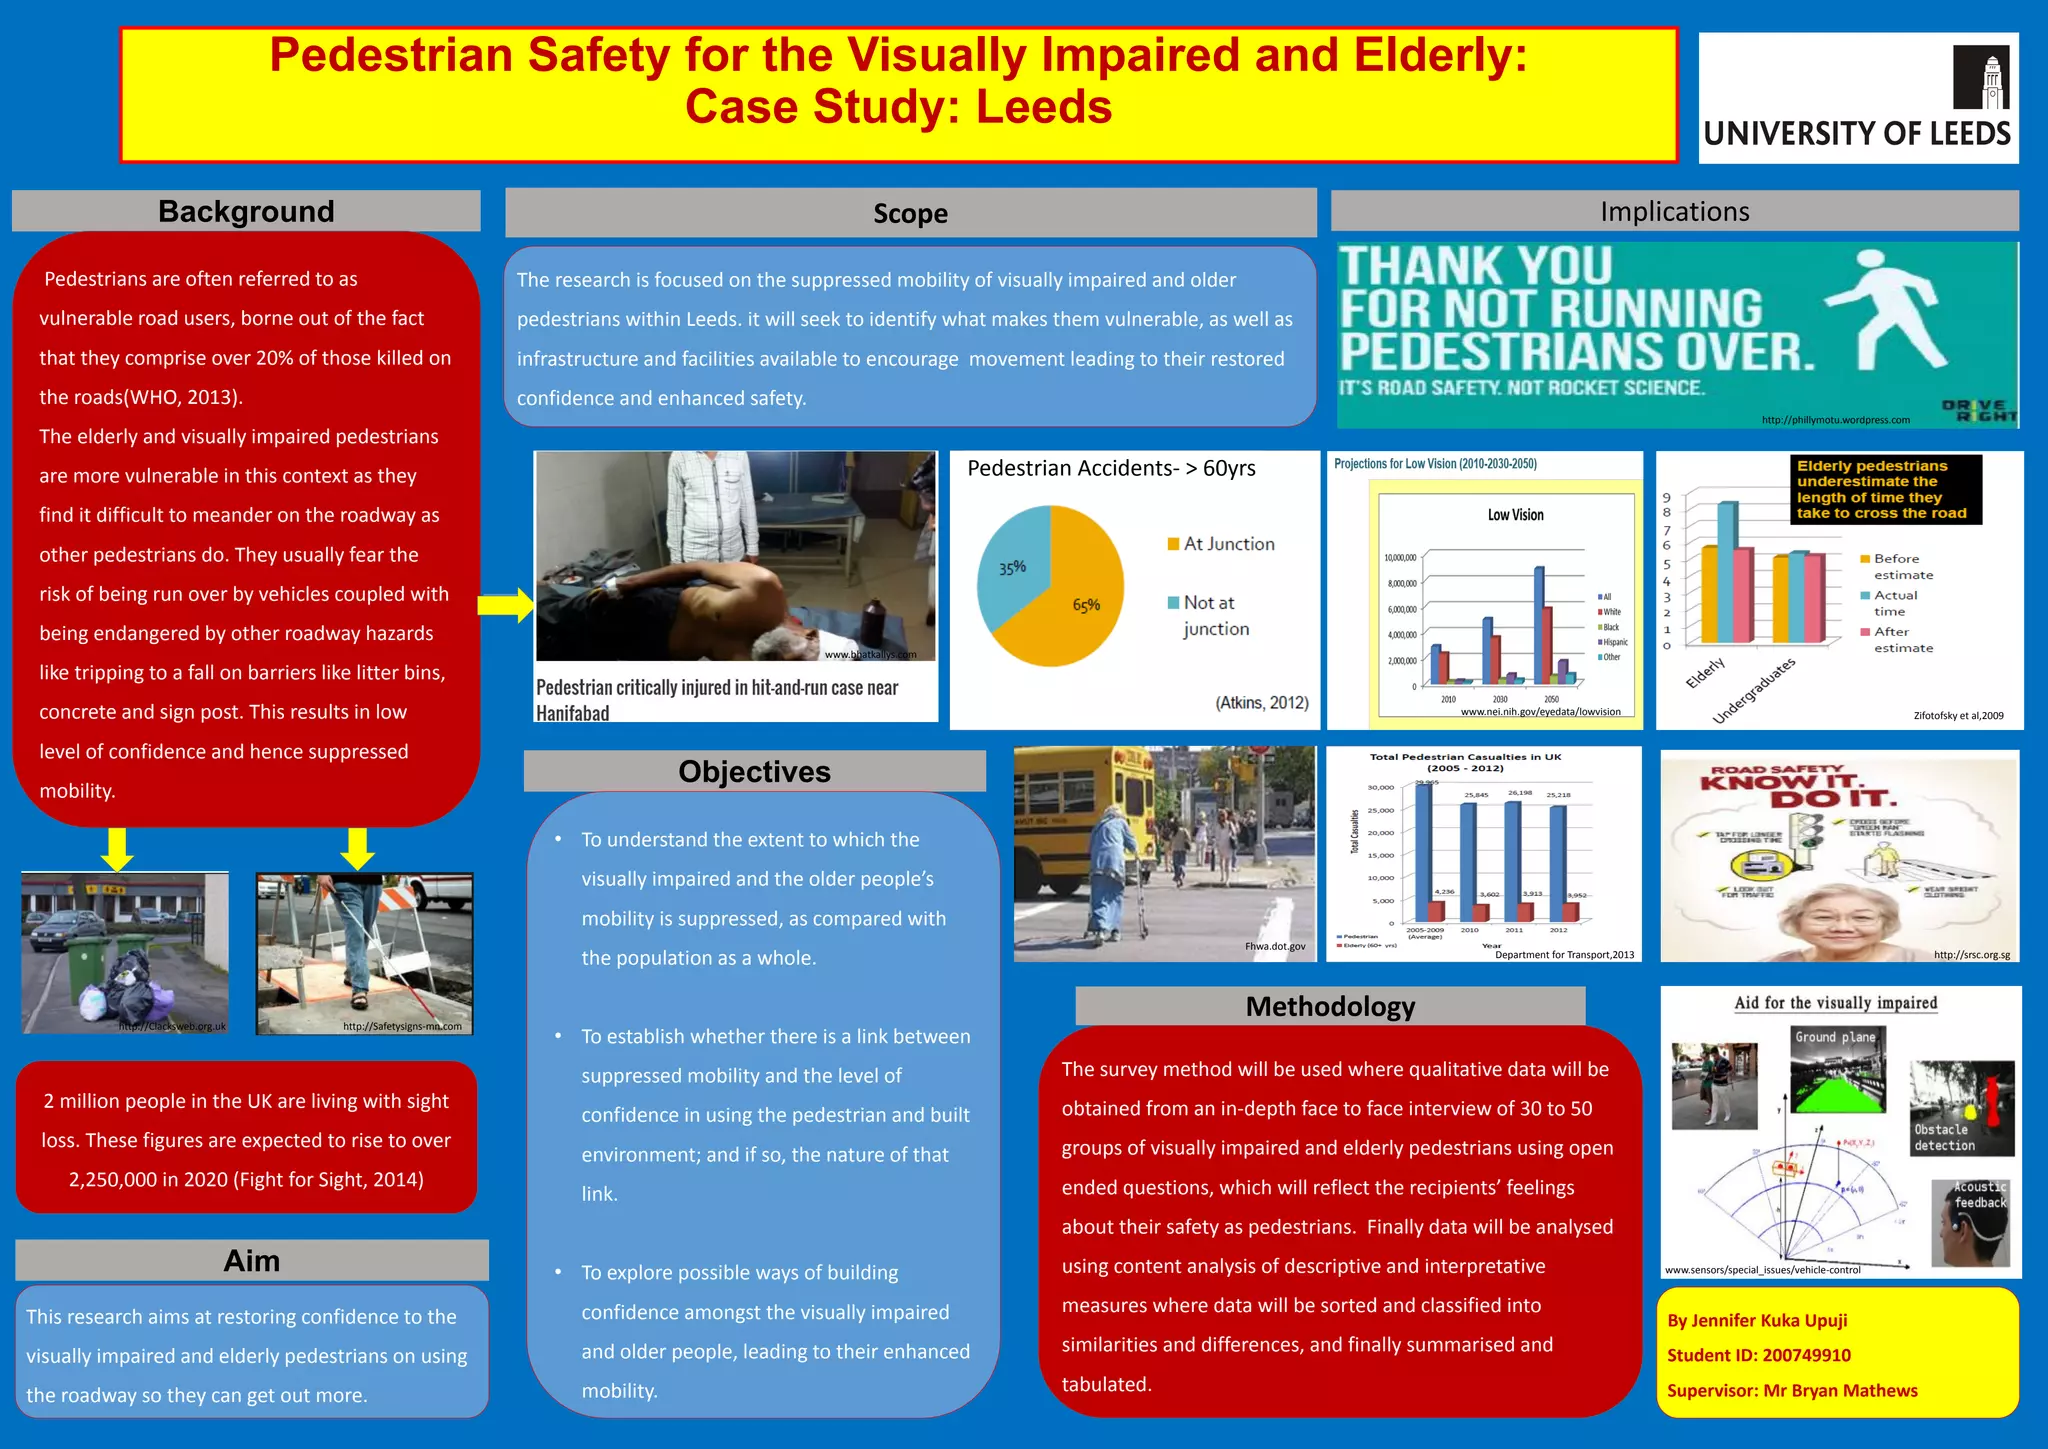
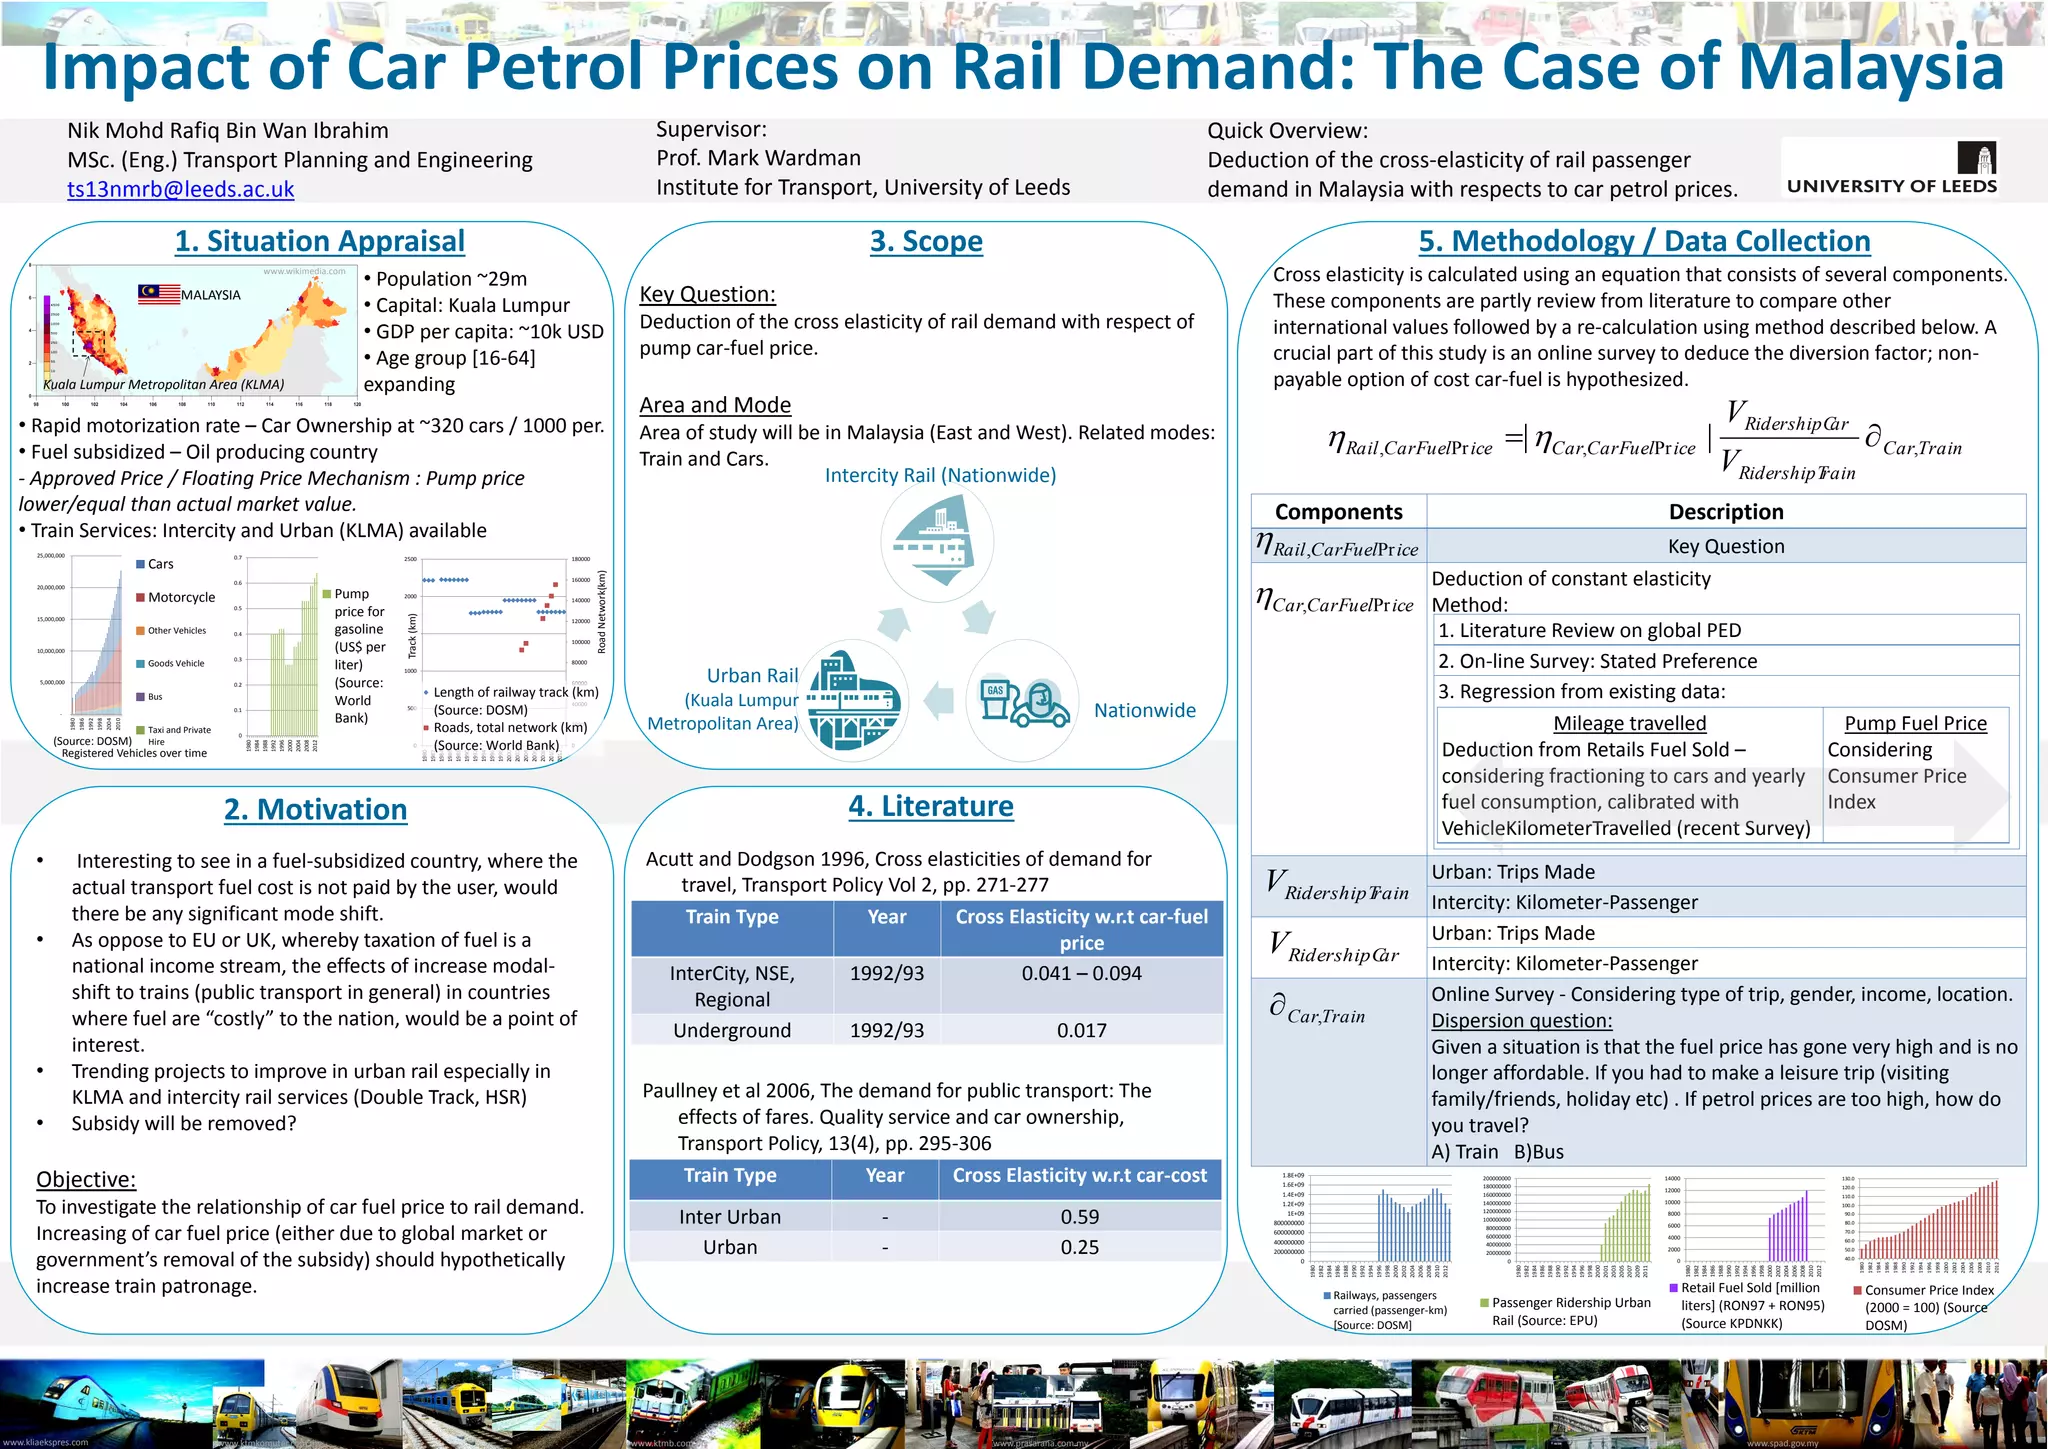
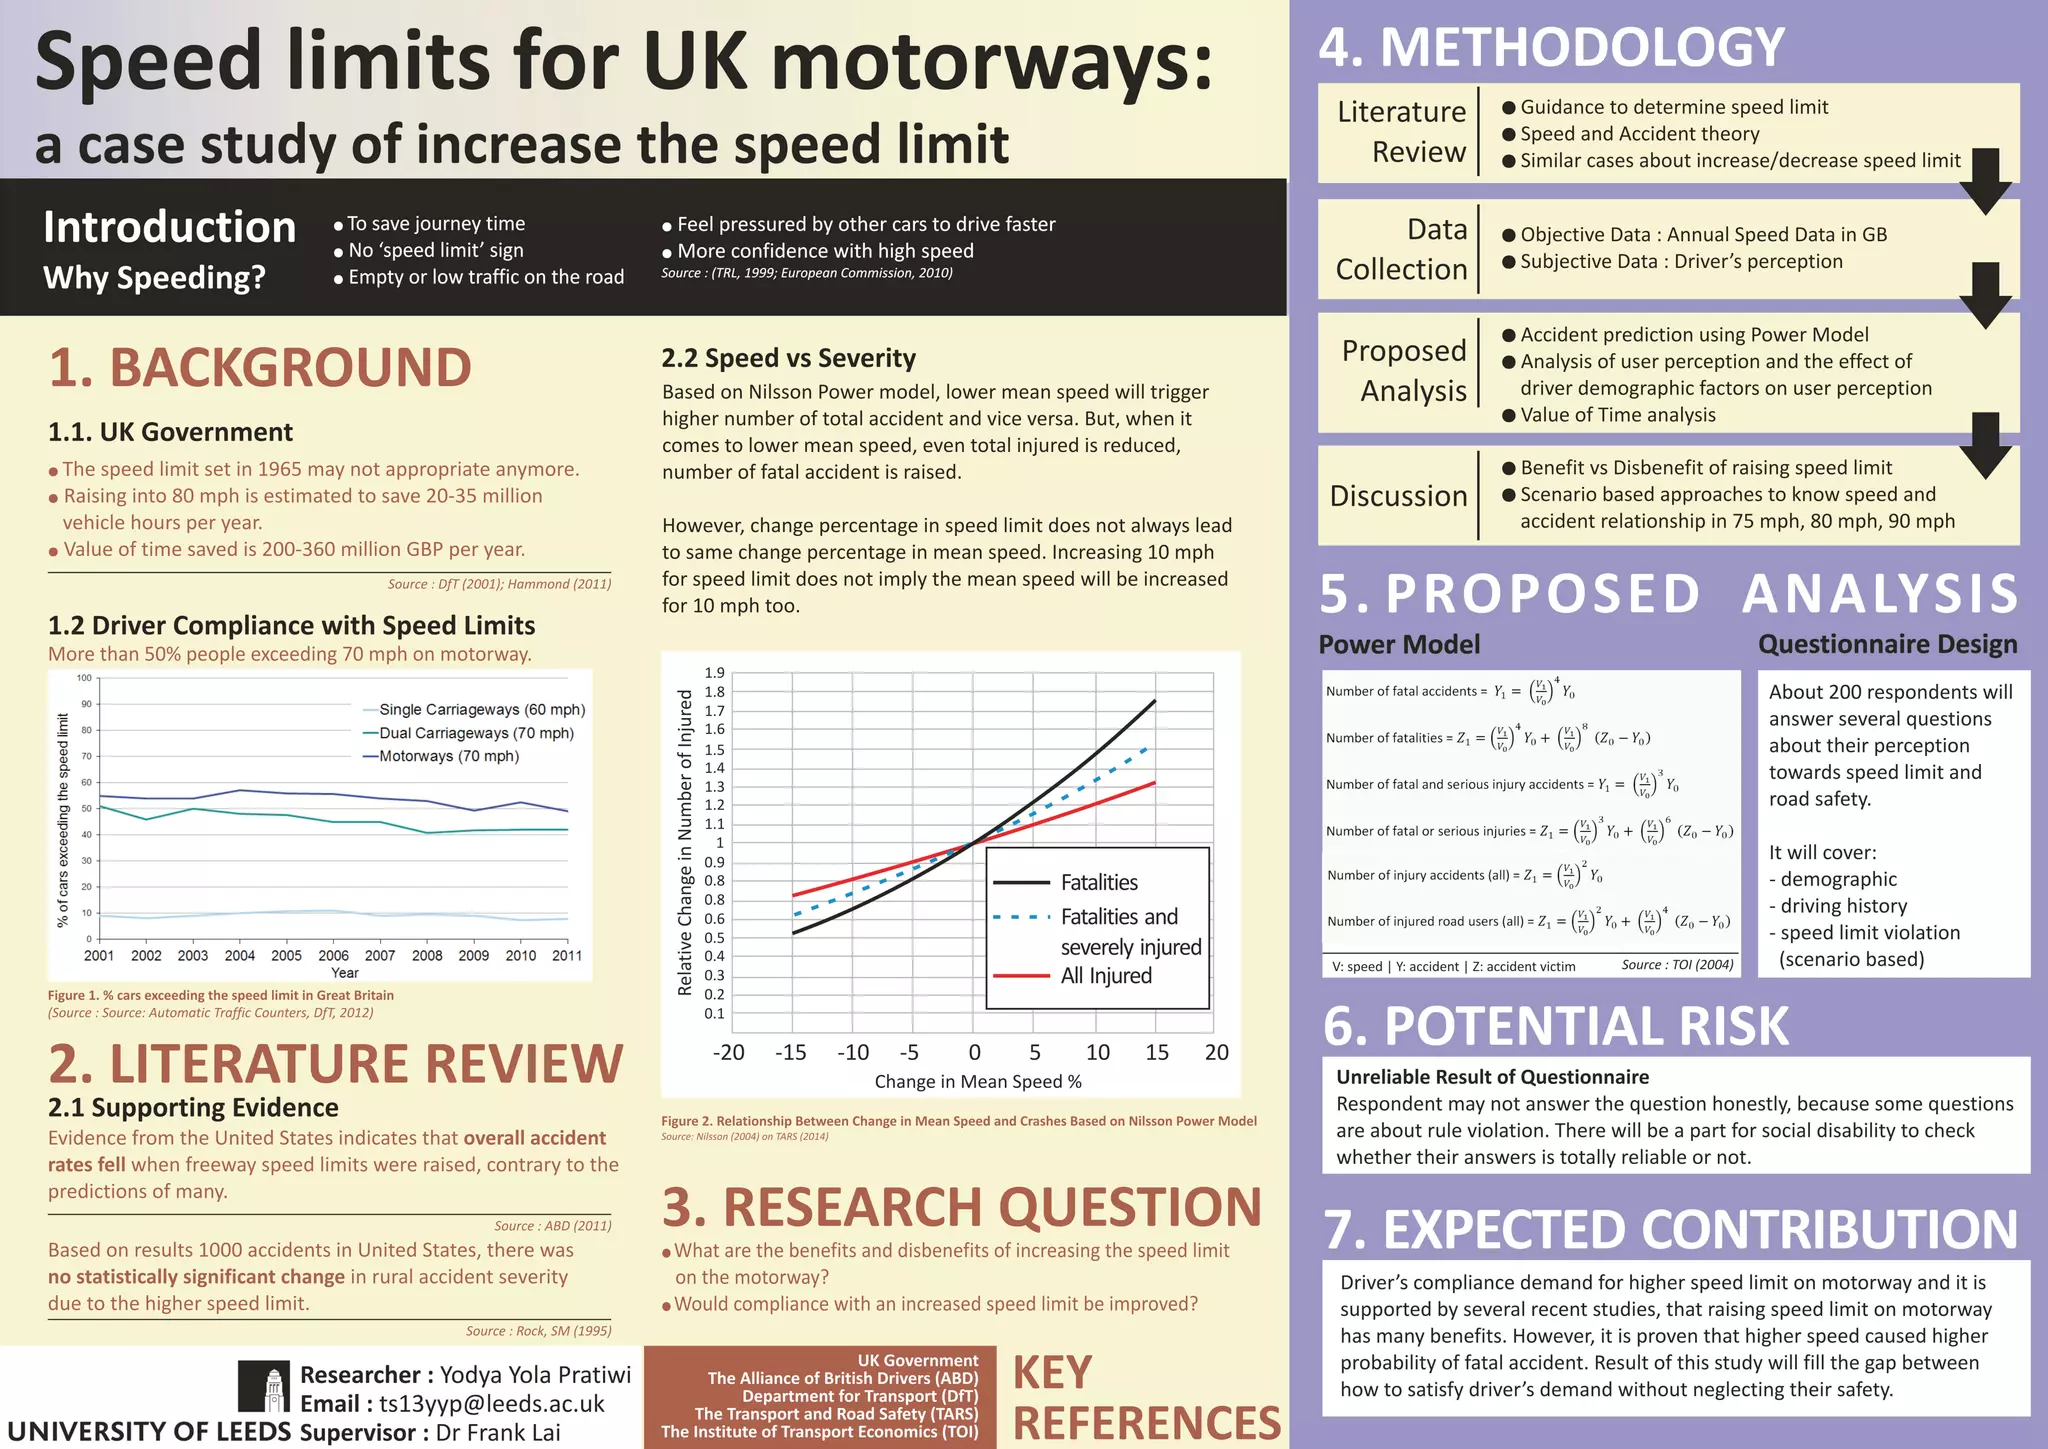
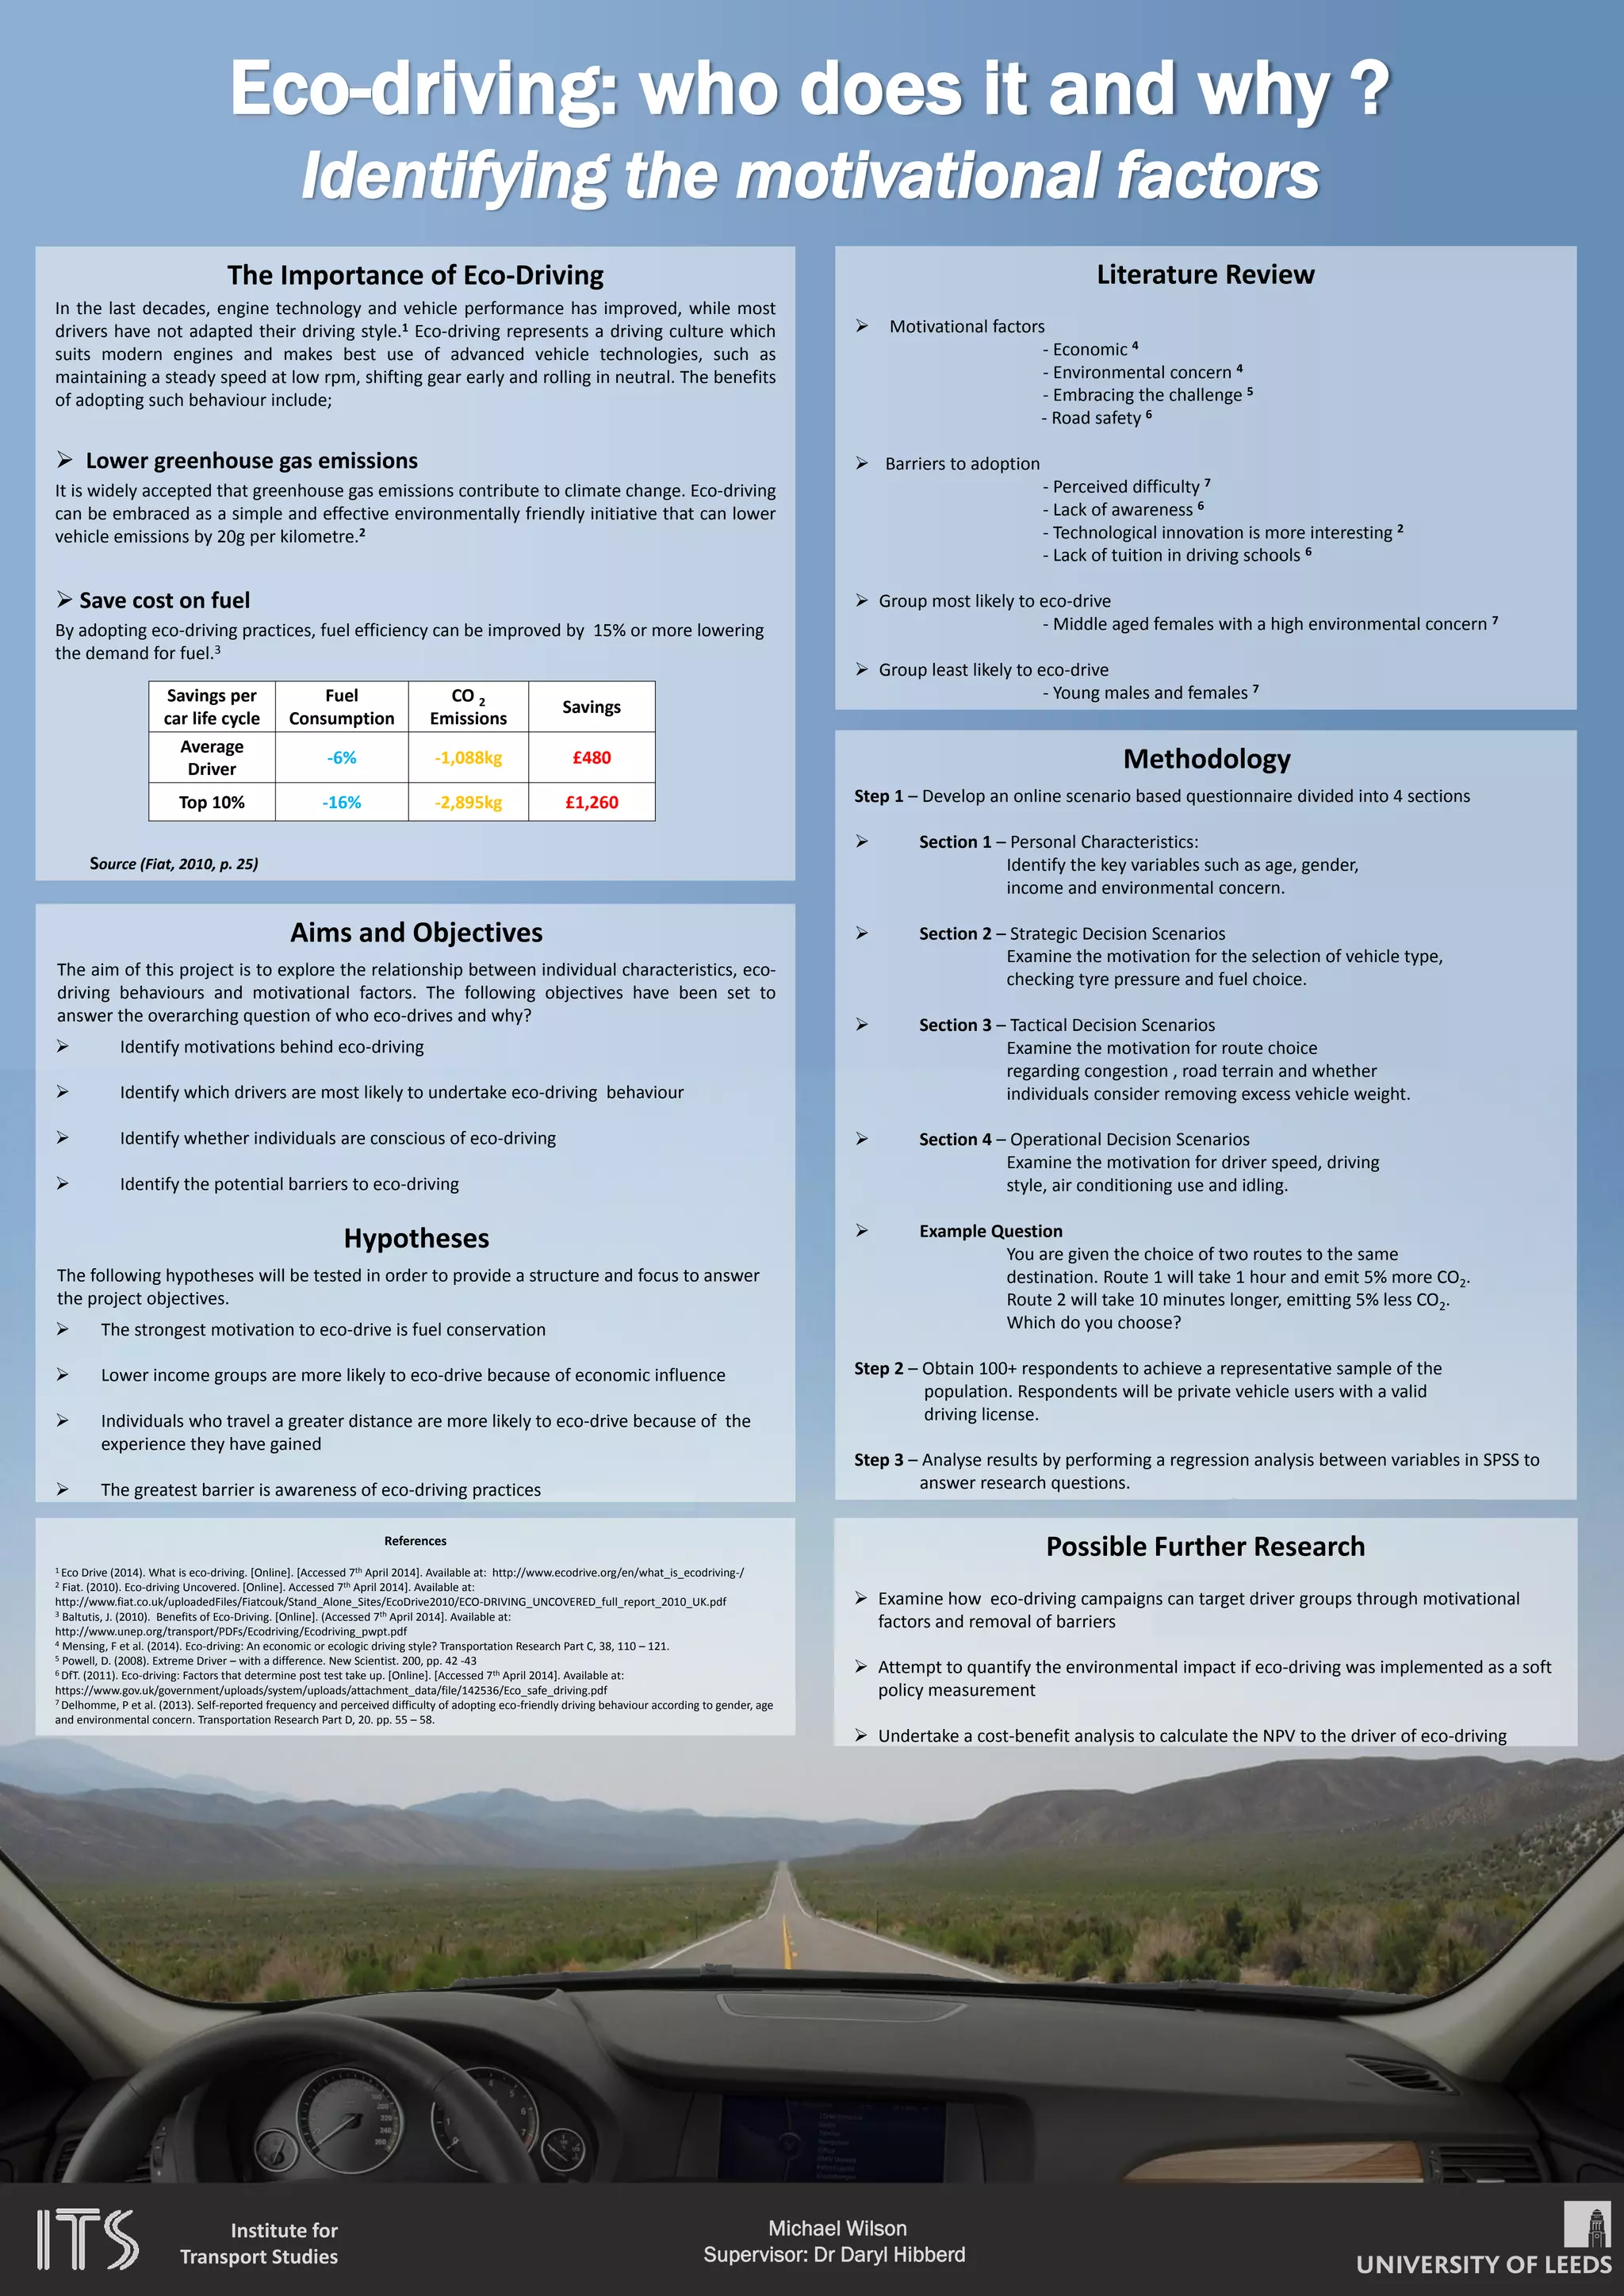
![INVESTMENT DECISIONS FOR RESILIENT TRANSPORT INFRASTRUCTURE:
A CASE STUDY OF THE DAWLISH RAILWAY LINE COLLAPSE
Kwame Nimako: MSc Transport Planning and Engineering (2013-2014) Supervisors: Prof. Greg Marsden and Prof. Nigel Wright
1. BACKGROUND
• A good transport system promotes the movement of people,
goods and services from one point to another under normal
conditions (Amdal and Swigart, 2010). A nation’s economic
vitality to a large extent depends on its transport network
(Amdal and Swigart, 2010).
• The occurrences of natural disasters such as flooding, make
transport networks such as railway lines vulnerable (Doll et
al., 2013), thereby impacting negatively on train services.
• For the disruption at Dawlish, the Train Operating Companies
will be paid £16 million by Network Rail for lost revenue over
the period (BBC, 2014).
• As the frequency and magnitude of such disruptive events
become more probable in future due to climate change, the
cost of providing engineering interventions required for
reliable transport services increases significantly.
• Since most transport infrastructure are long term assets (Doll
et al., 2013), there is the need for adequate investment
decisions on cost effective strategies to be employed to
enhance their resilience over their life span.
2. AIM
The aim of this dissertation is to develop a methodology to be
utilised in making cost-effective investment decisions to
improve the resilience of railway lines to disruptions.
3. OBJECTIVES
To achieve this aim, the following objectives have been set:
i. Understanding how demand for transport changes during
a major flooding event
ii. Estimating the impacts of the resultant disruption on
users of the infrastructure
iii. Collecting estimates of alternative flood risk mitigation
investments
iv. Developing a methodology to assess the cost-
effectiveness of such investments under different future
scenarios of flood risk
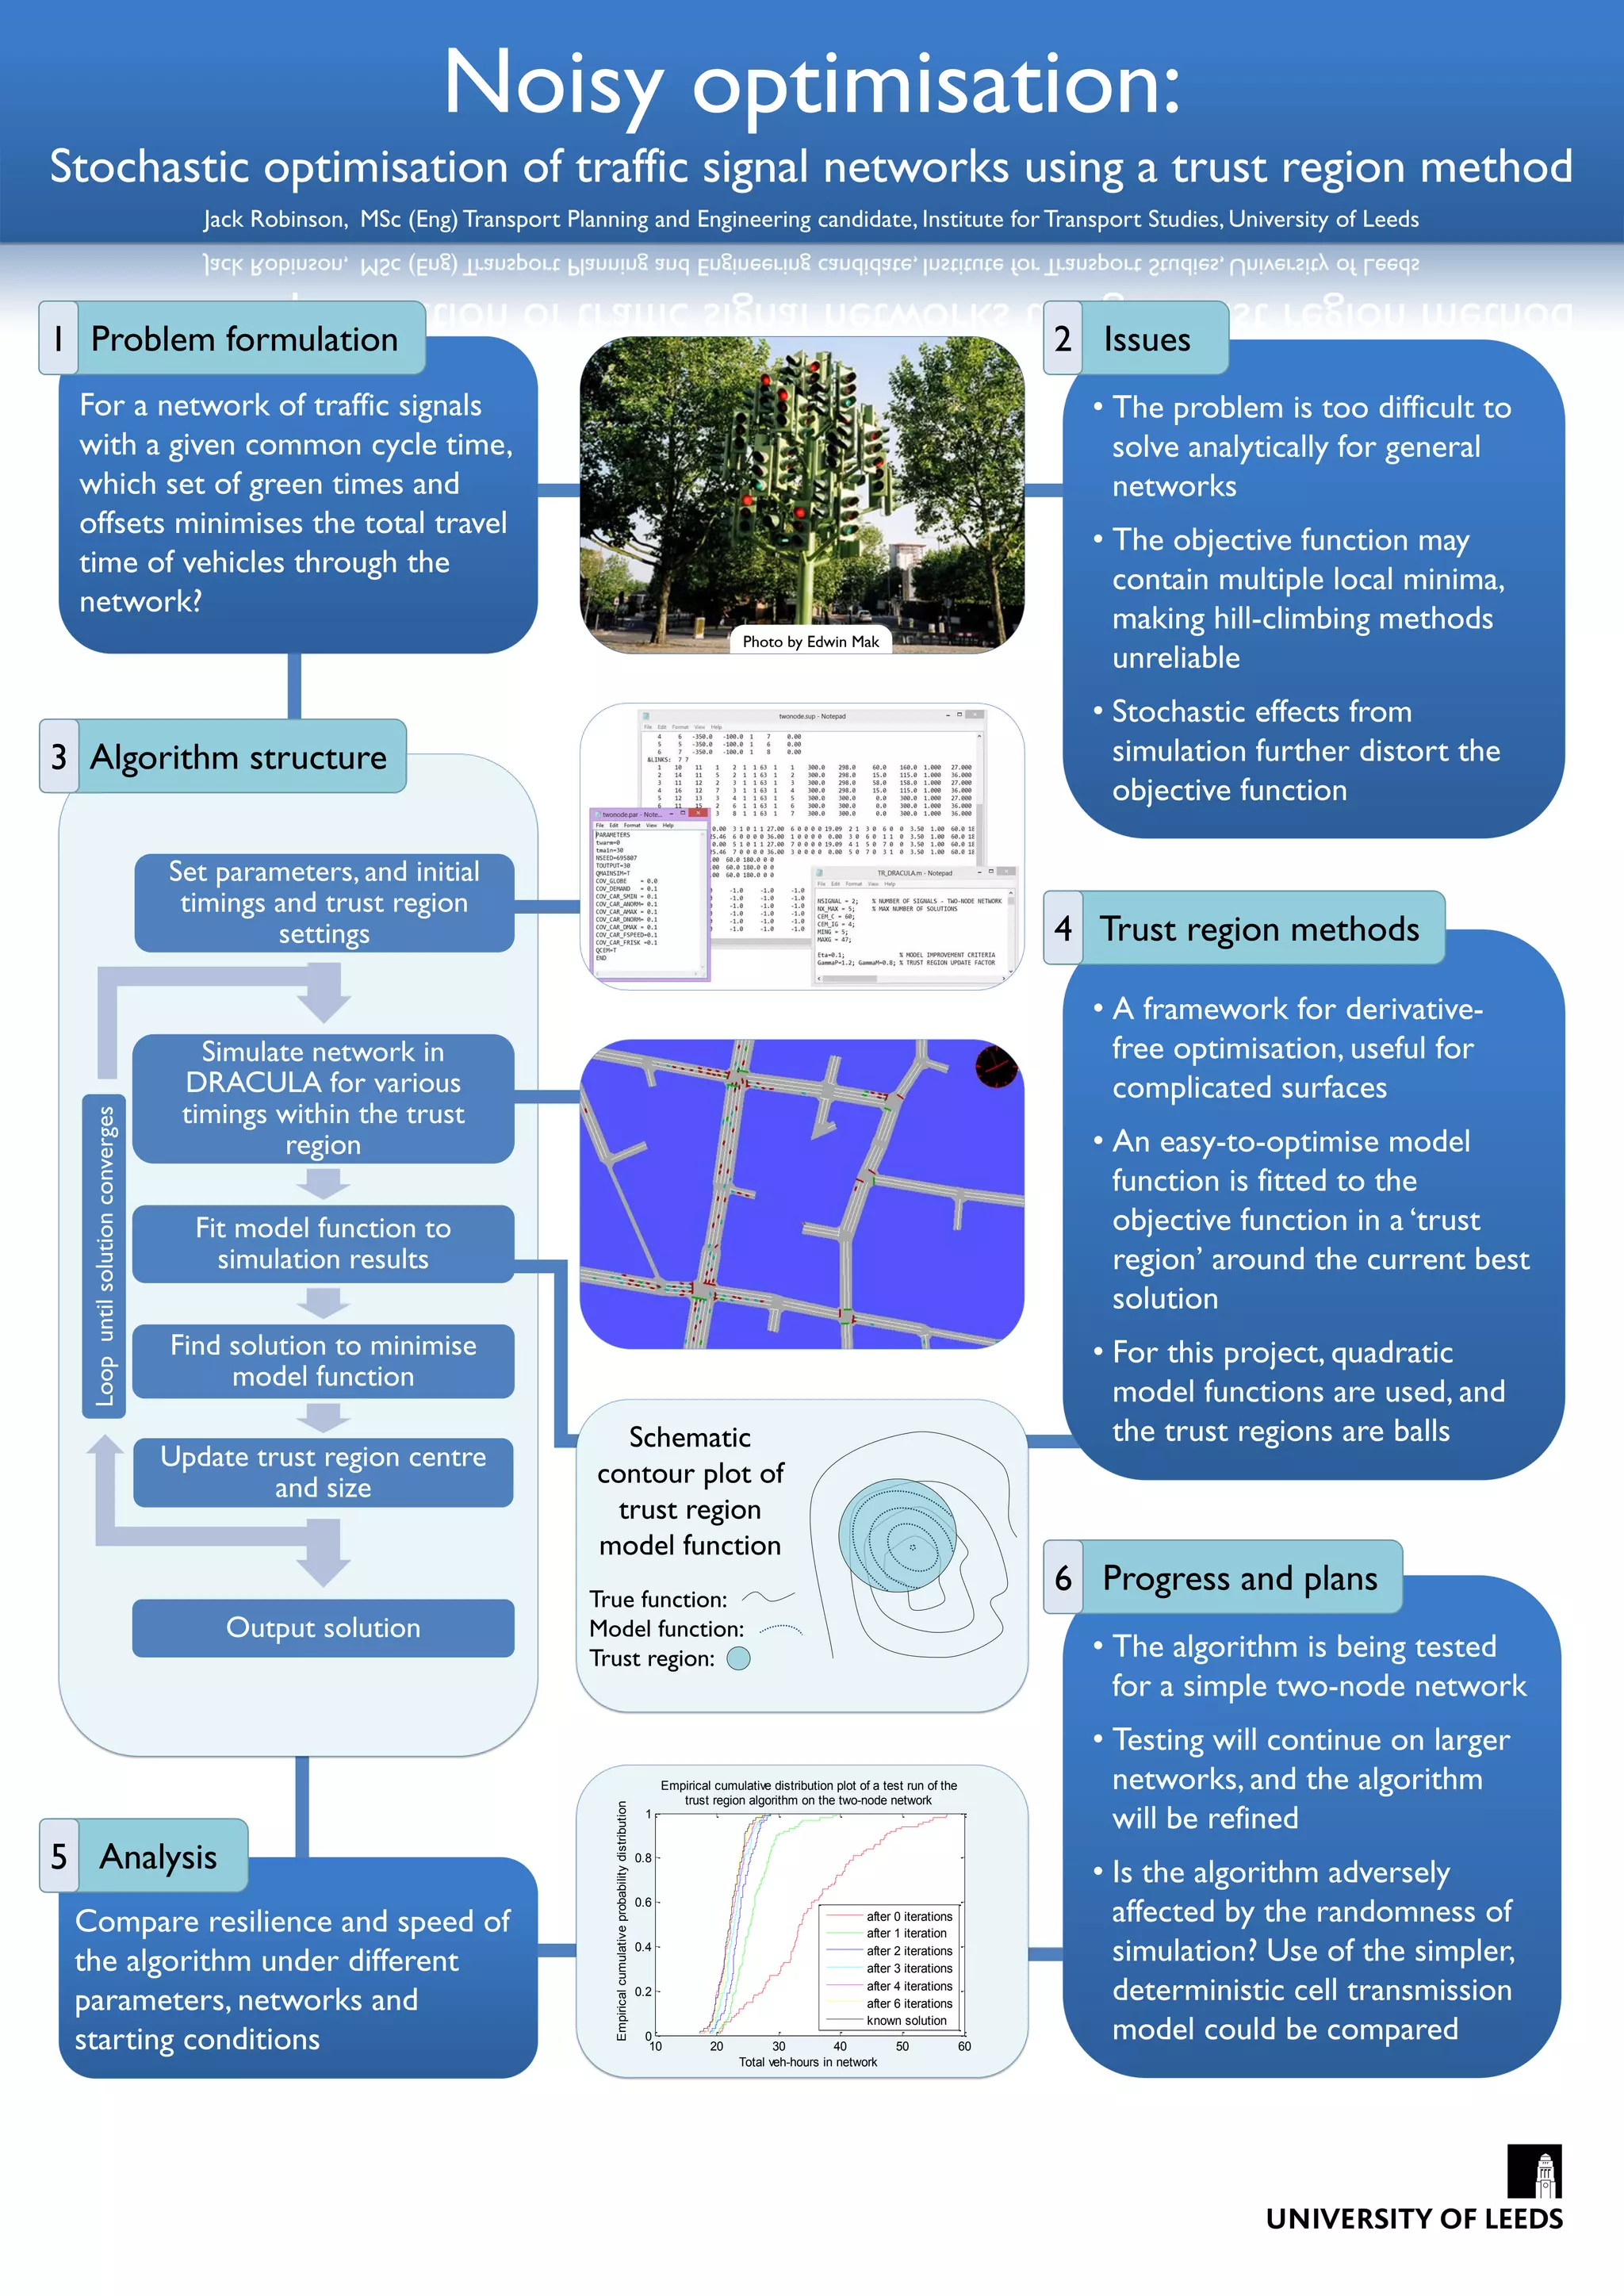
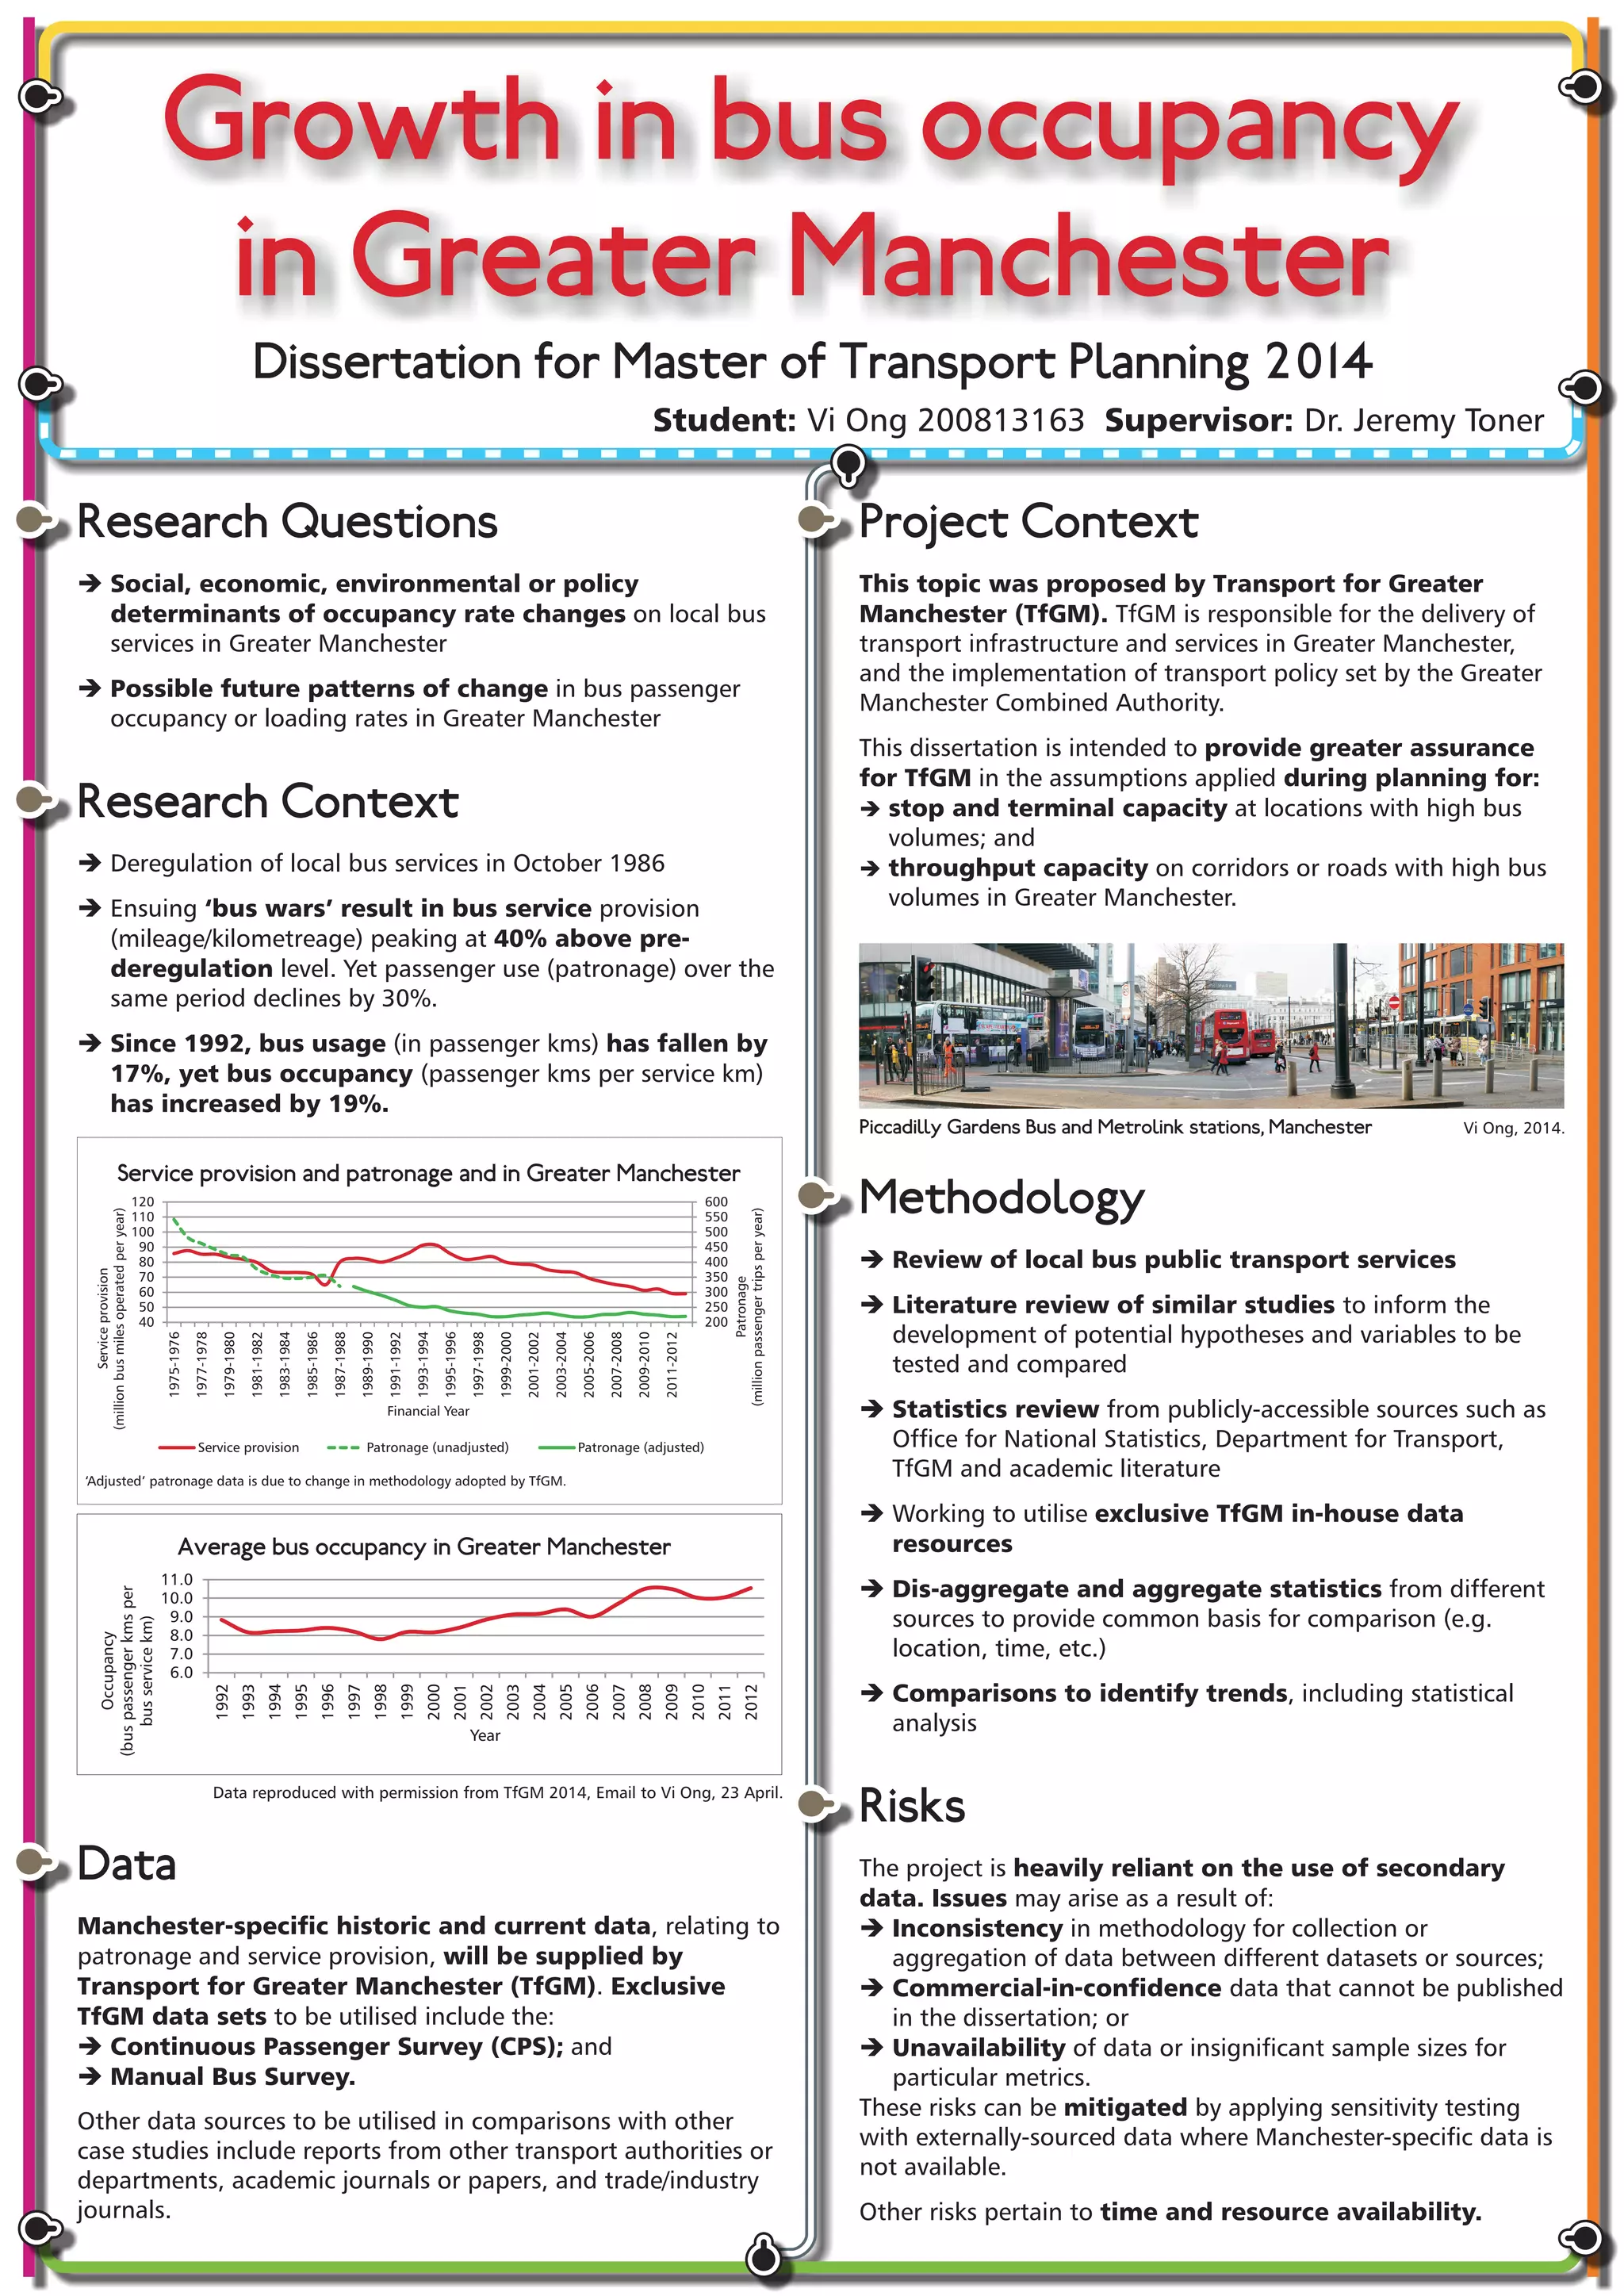
Great Western Rail line - London-Exeter-Dawlish-Plymouth-Penzance. (Source: First Great Western network map)
Location of Dawlish and the Railway line Disruption (Source: Google.com)
4. PROPOSED METHODOLOGY
5. EXPECTED OUTCOME
It is anticipated that this study will produce an Investment-
Frequency Matrix based on current and future scenarios of
disruptions to be utilised to improve the resilience of railway
lines.
6. REFERENCES
• Amdal, J.R. and Swigart, S.L. 2010. Resilient Transportation Systems
in a Post-Disaster Environment: A Case Study of Opportunities
Realized and Missed in the Greater New Orleans Region, 2010.
• Doll, C. et al. 2013. Adapting rail and road networks to weather
extremes: case studies for southern Germany and Austria. Natural
Hazards. pp.1-23.
• British Broadcasting Corporation. 2014. Storm-hit Dawlish rail line
compensation payout revealed. [Online]. [Accessed 28 April 2014].
Available from:http://www.bbc.co.uk/news/uk-england-devon-
27055780.](https://image.slidesharecdn.com/allall-140515044924-phpapp01/75/Masters-Dissertation-Posters-2014-28-2048.jpg)
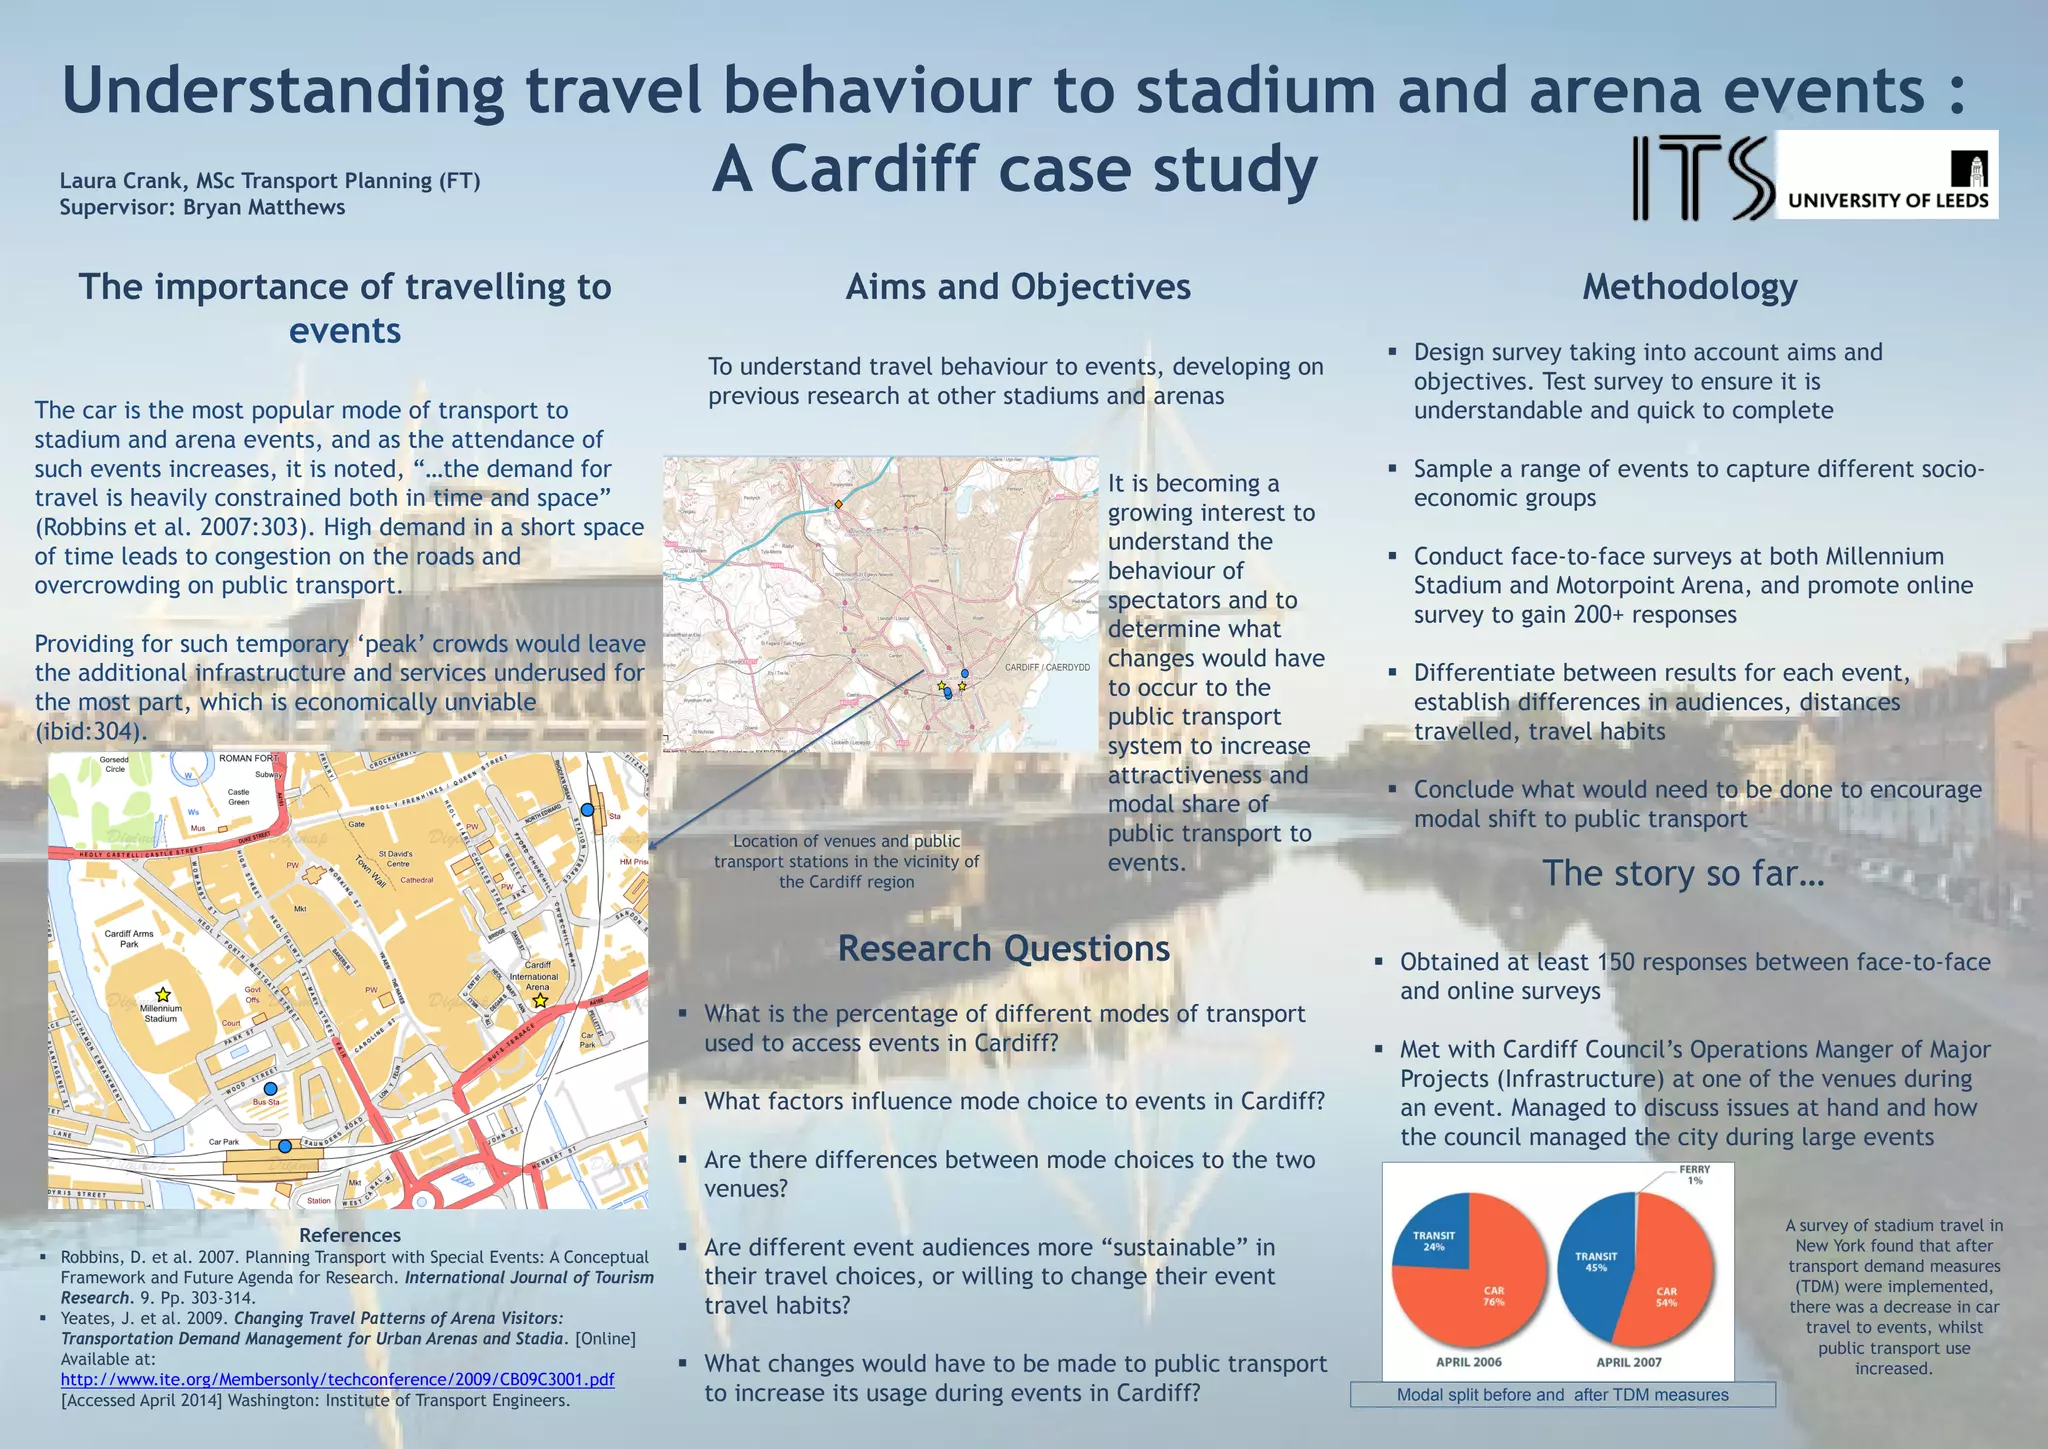
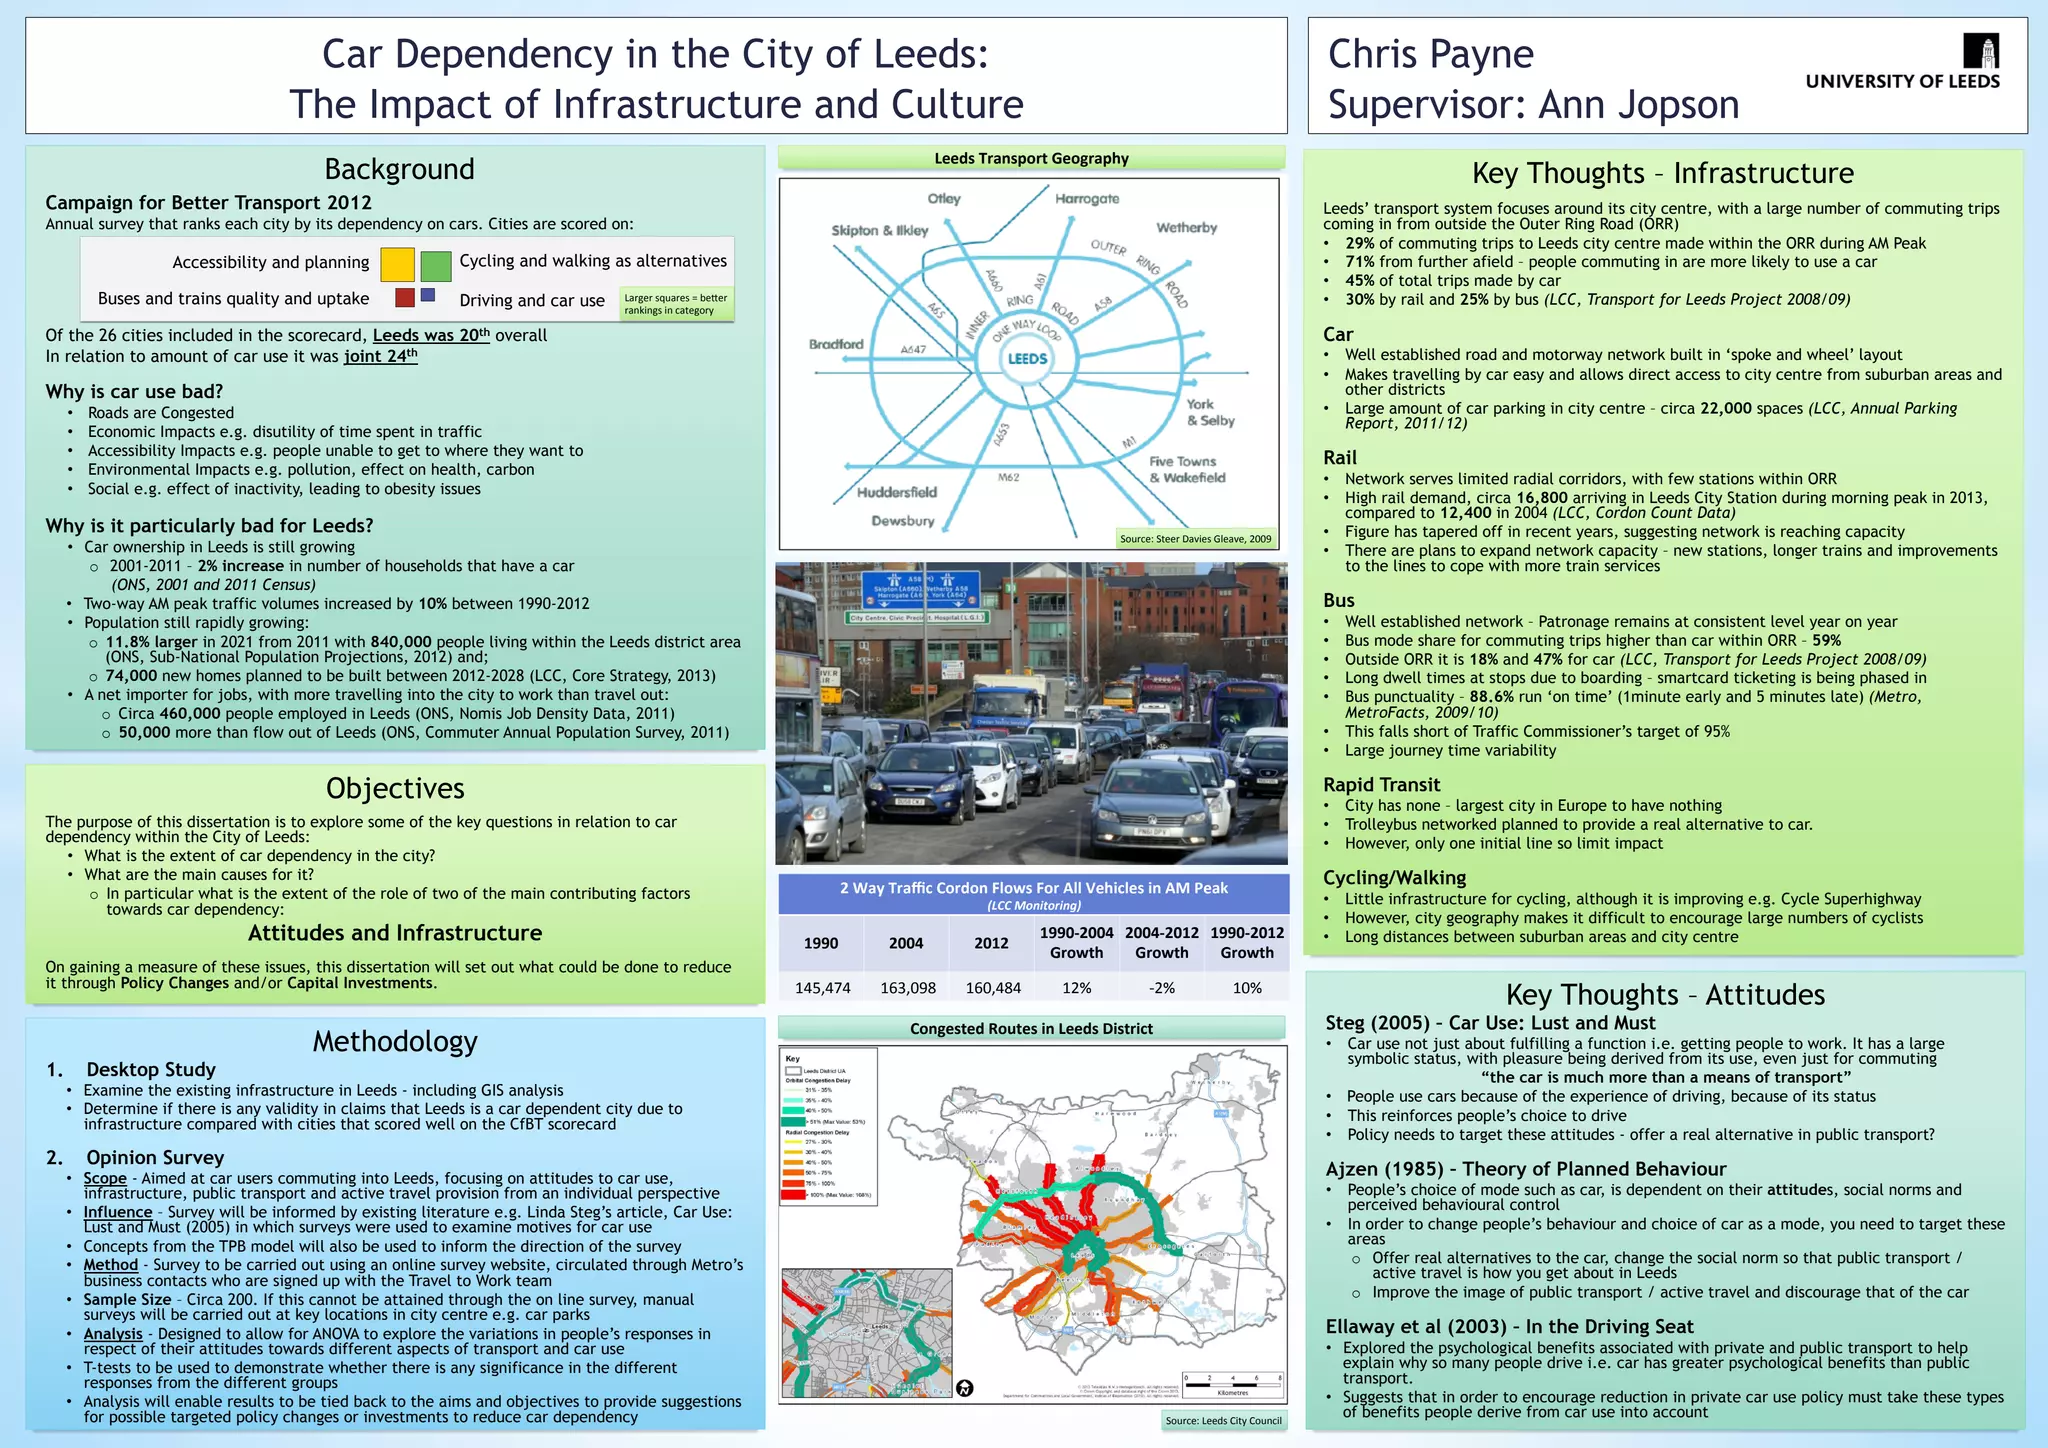
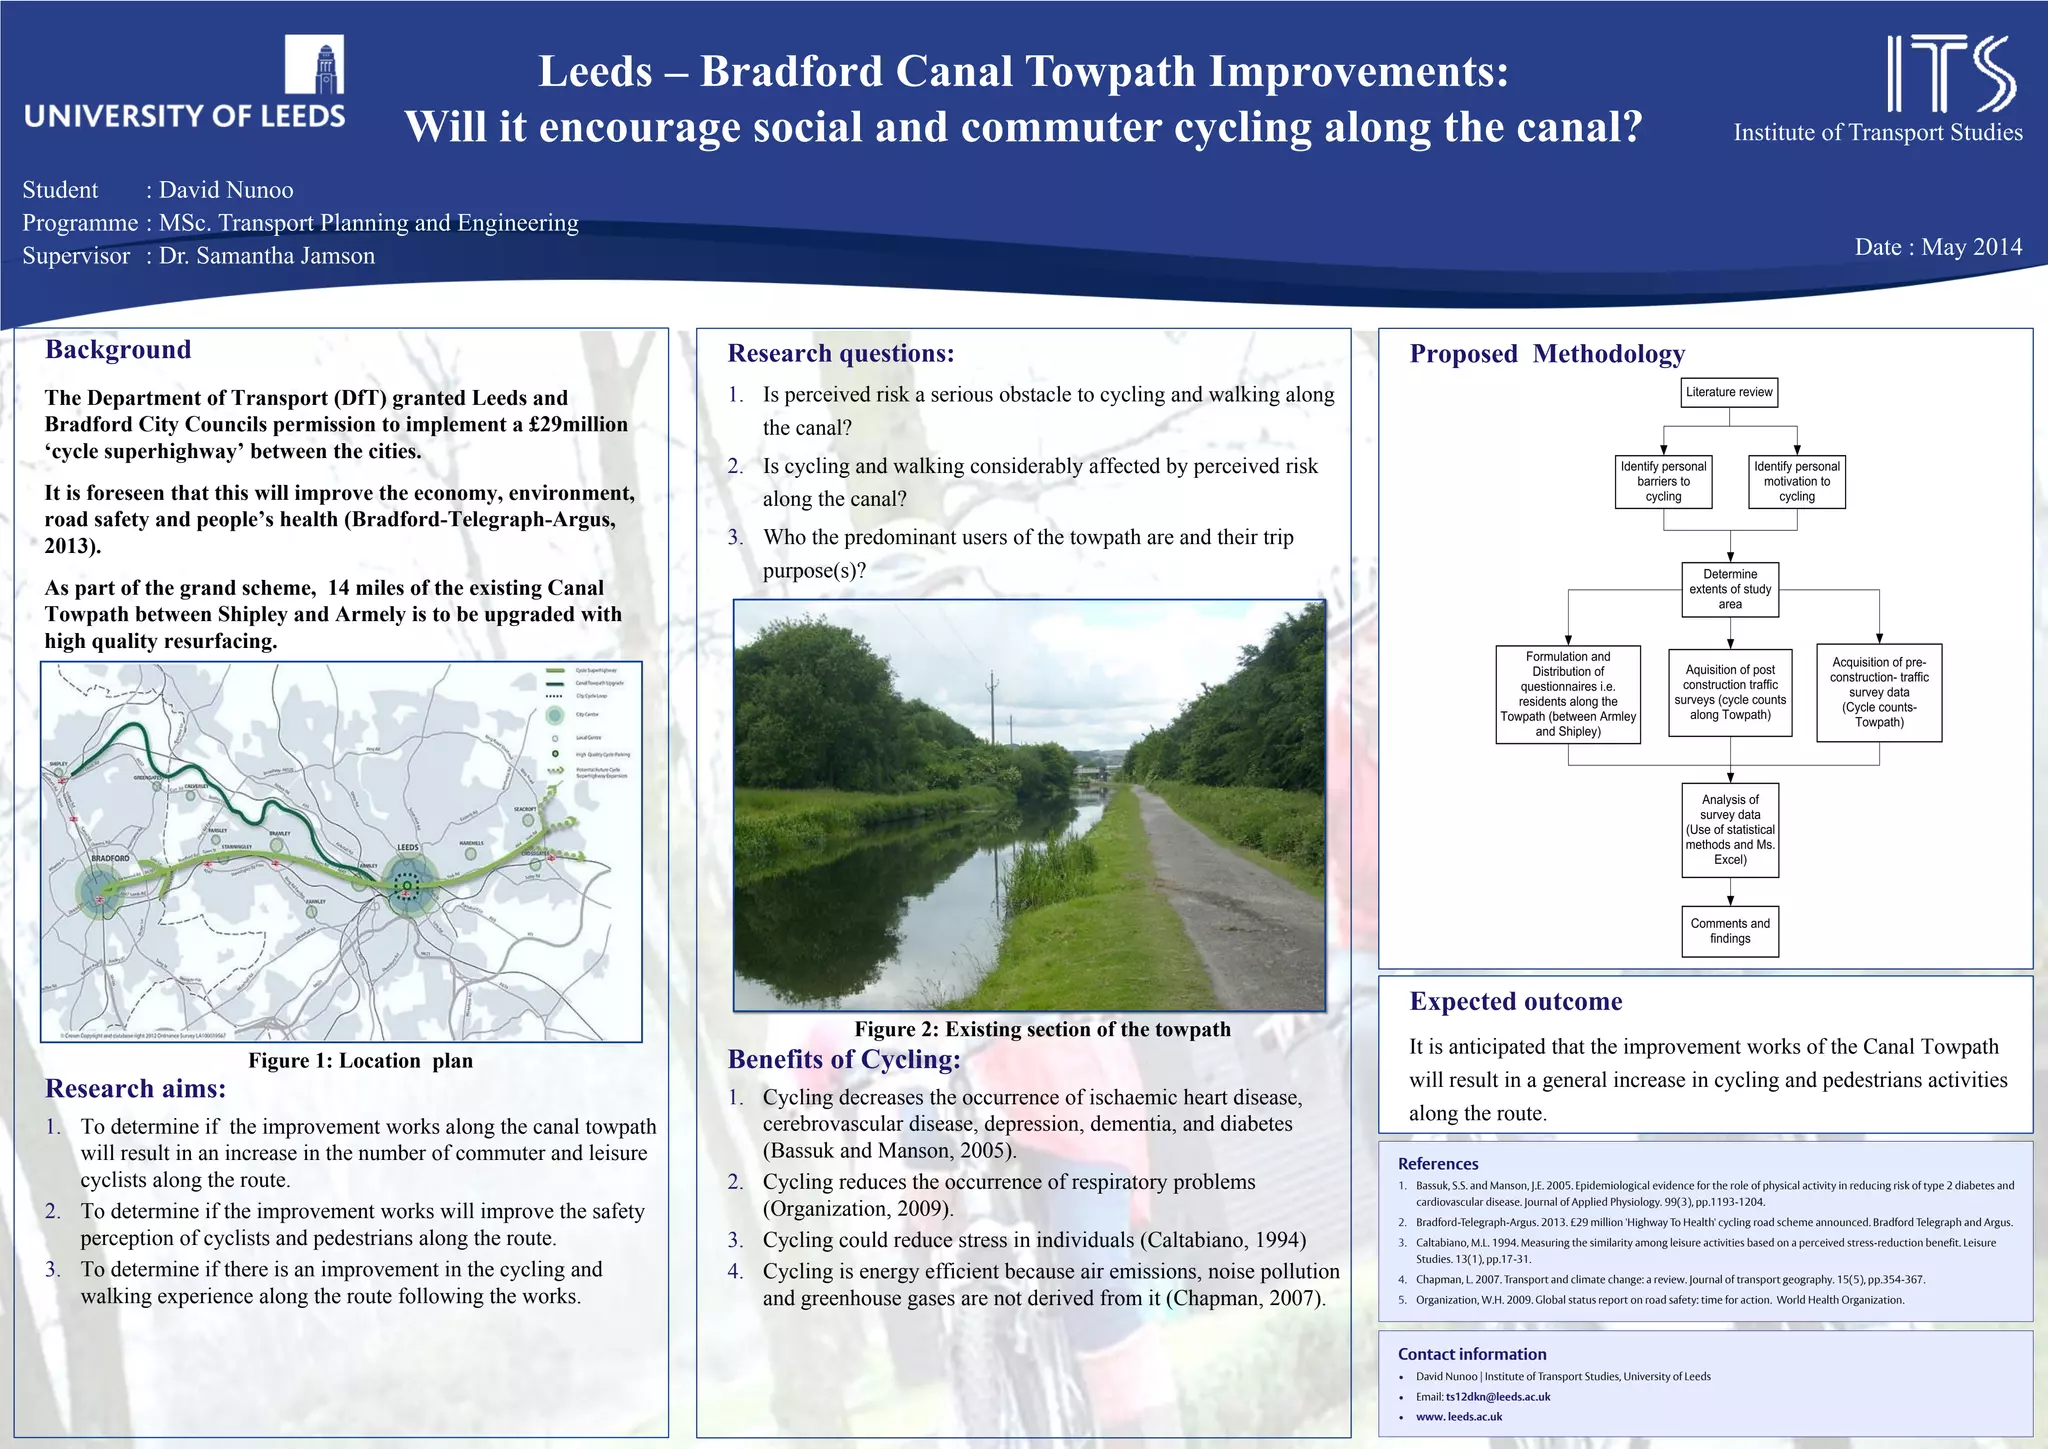
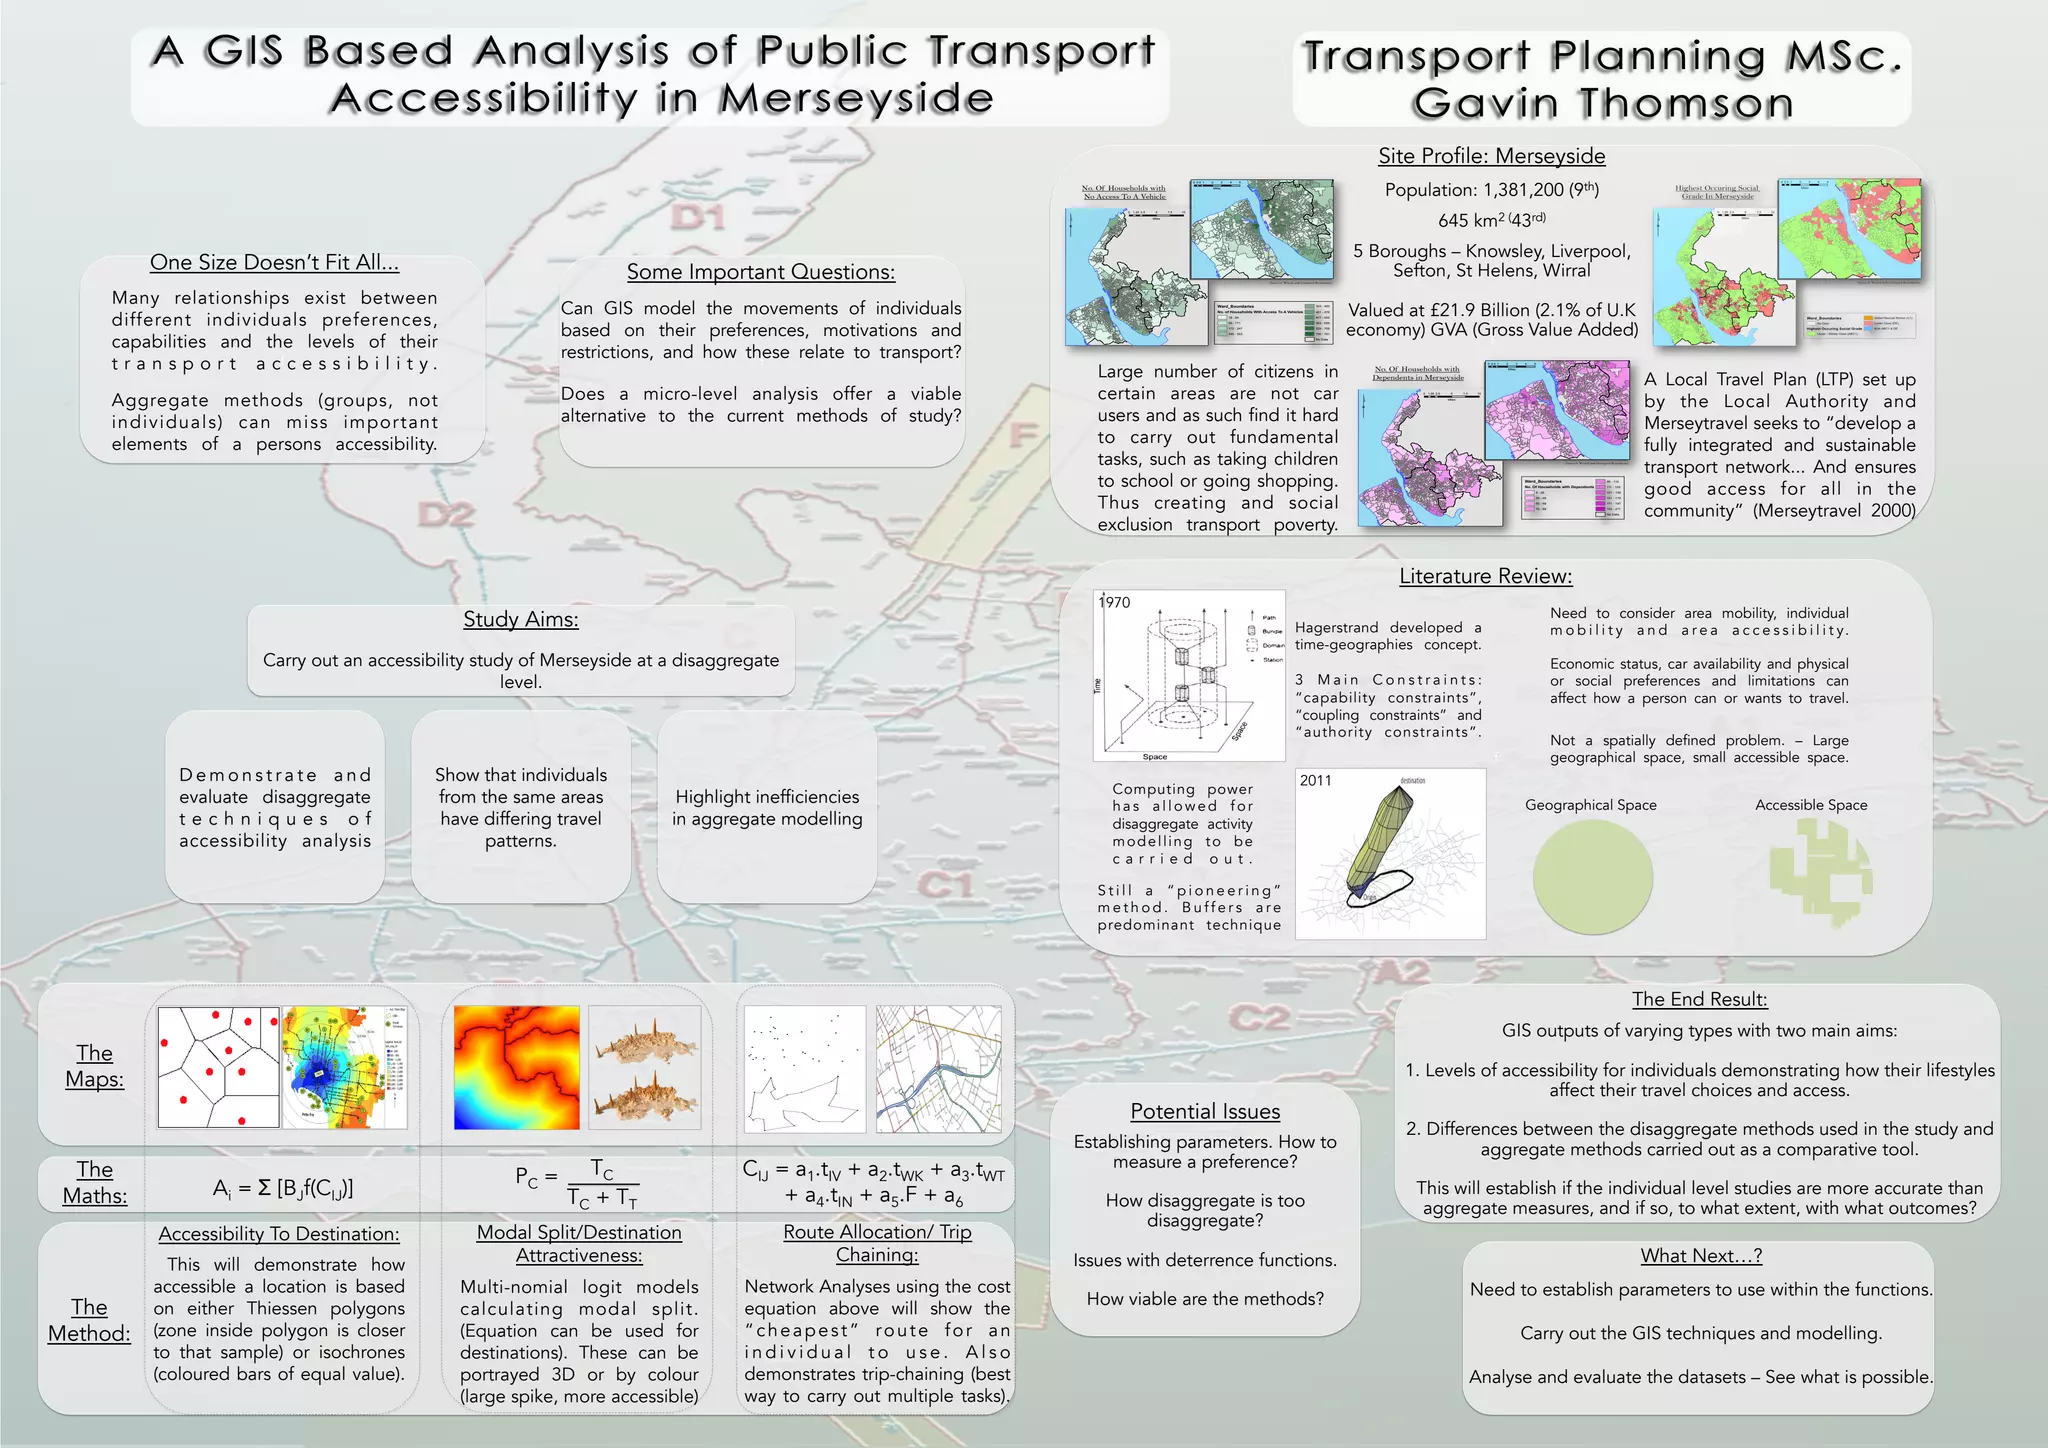
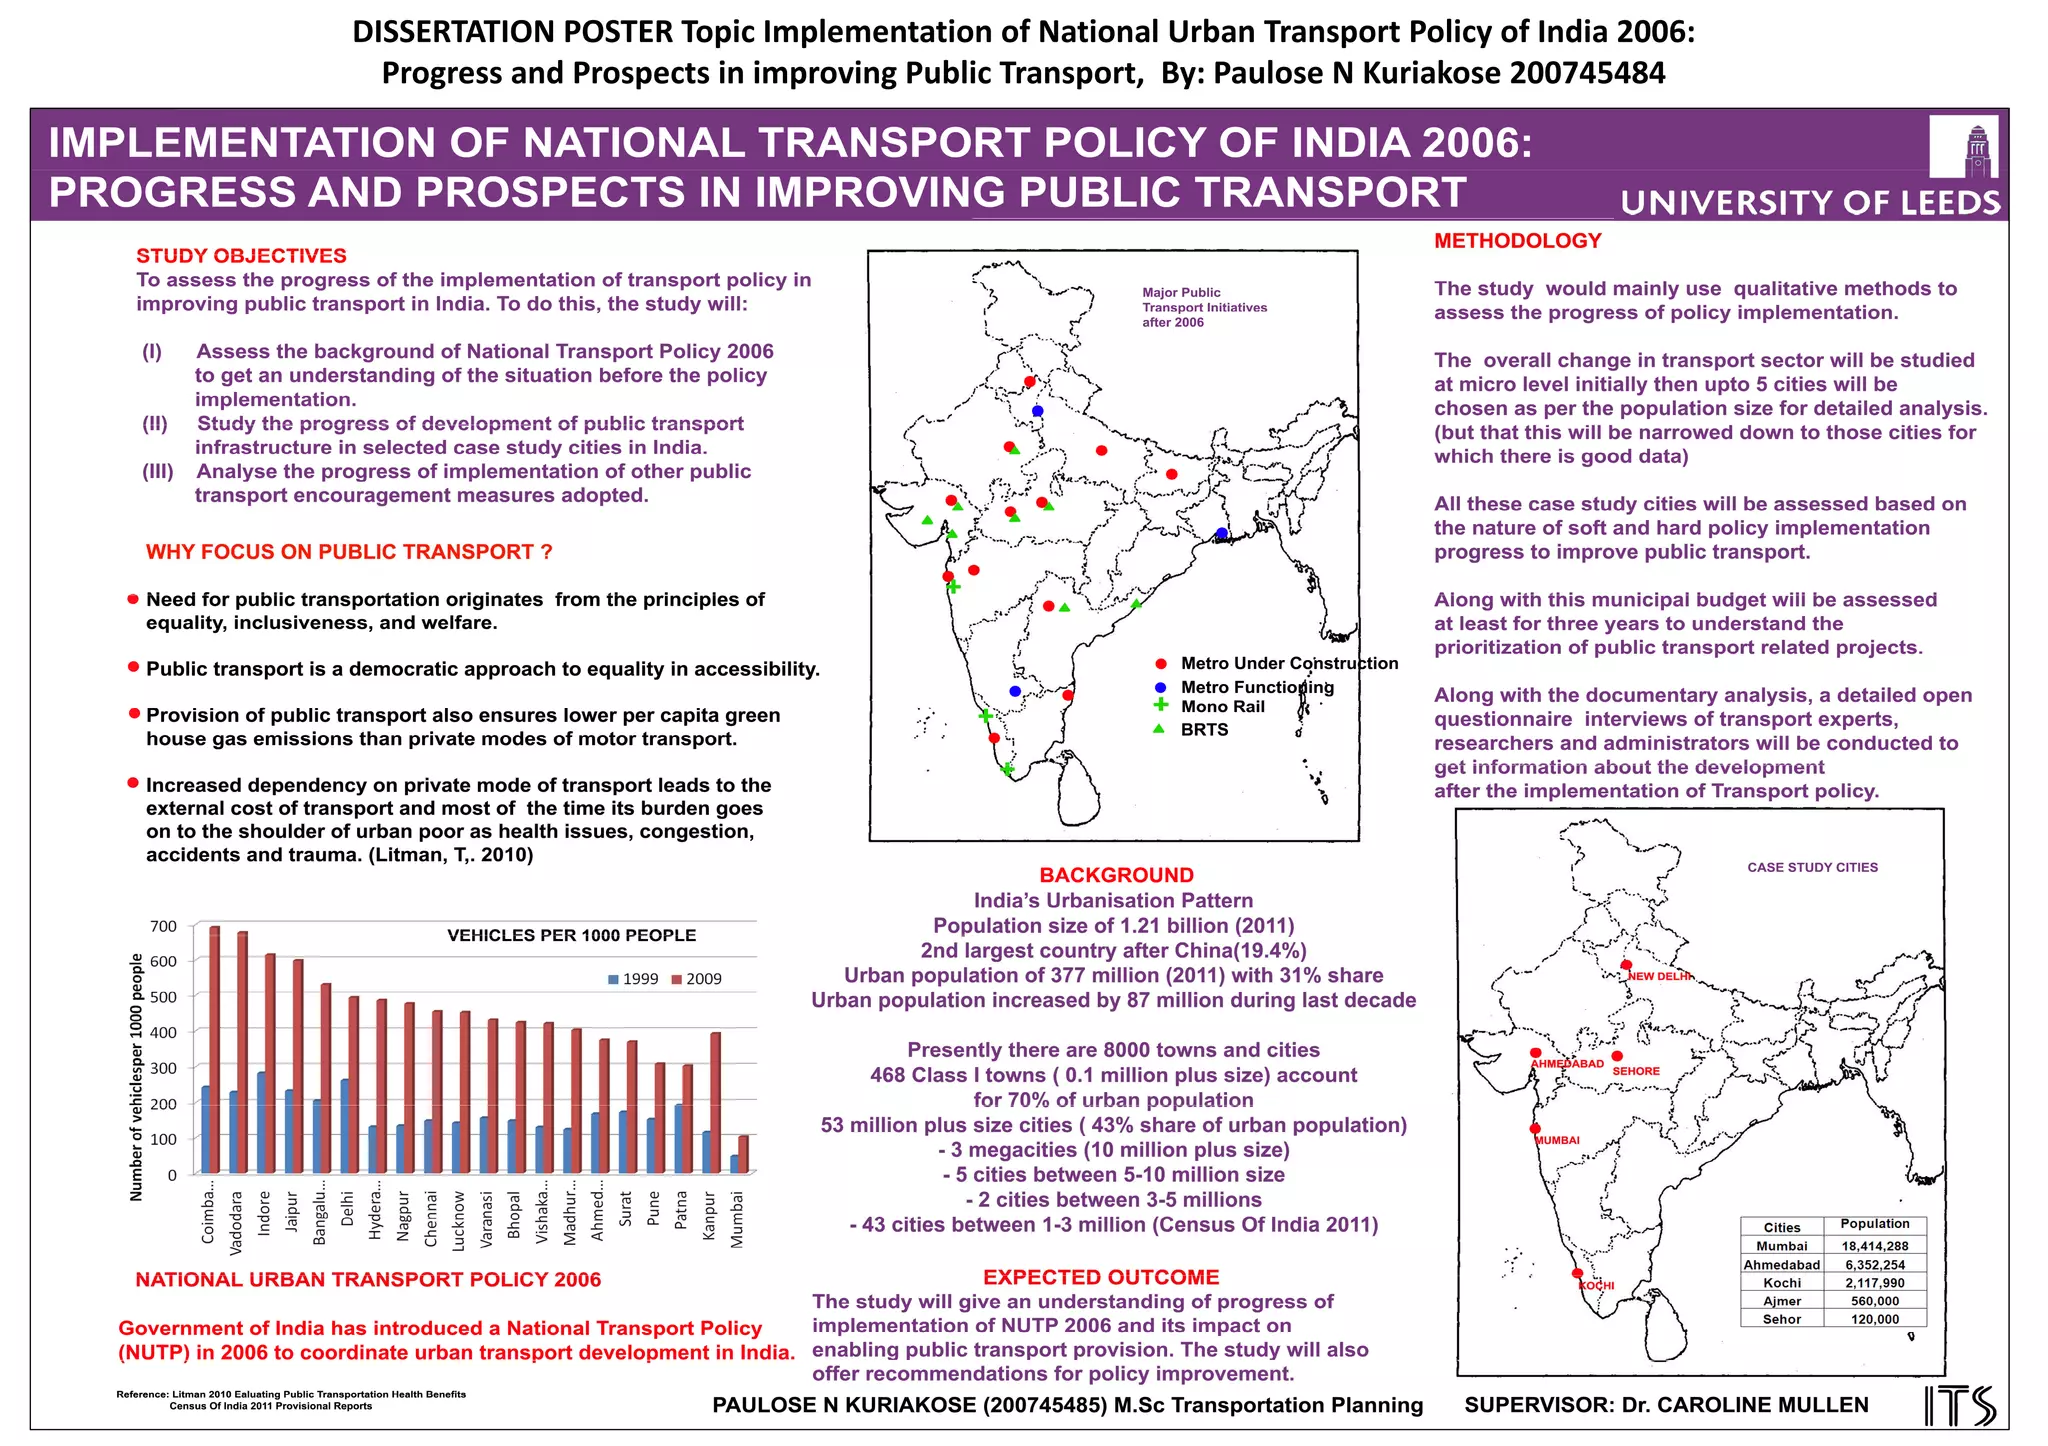
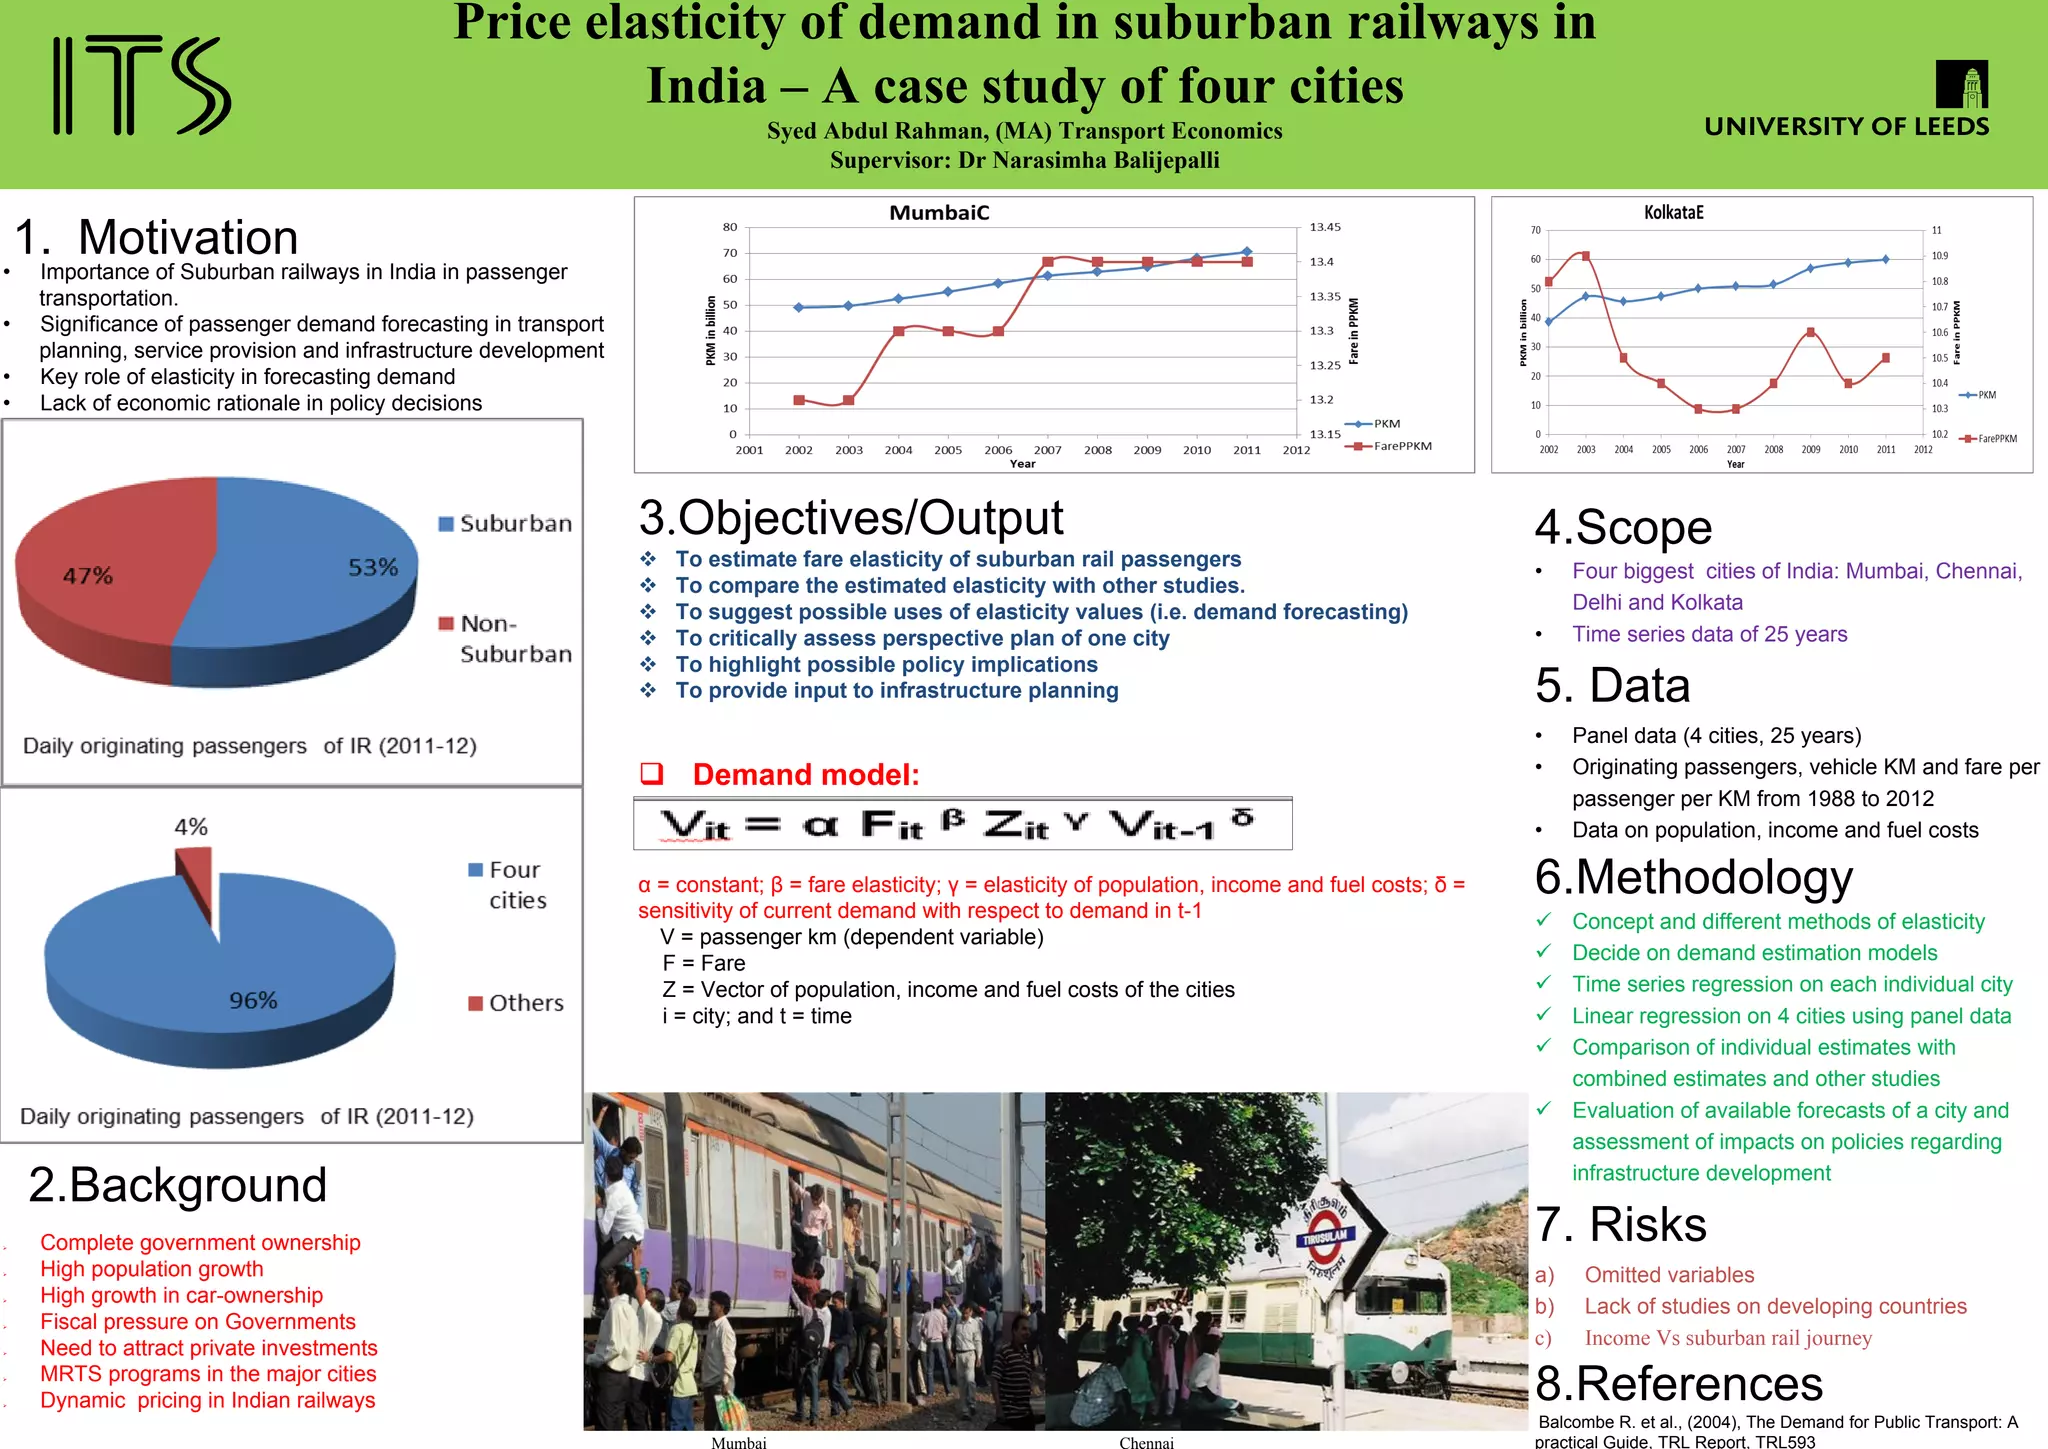
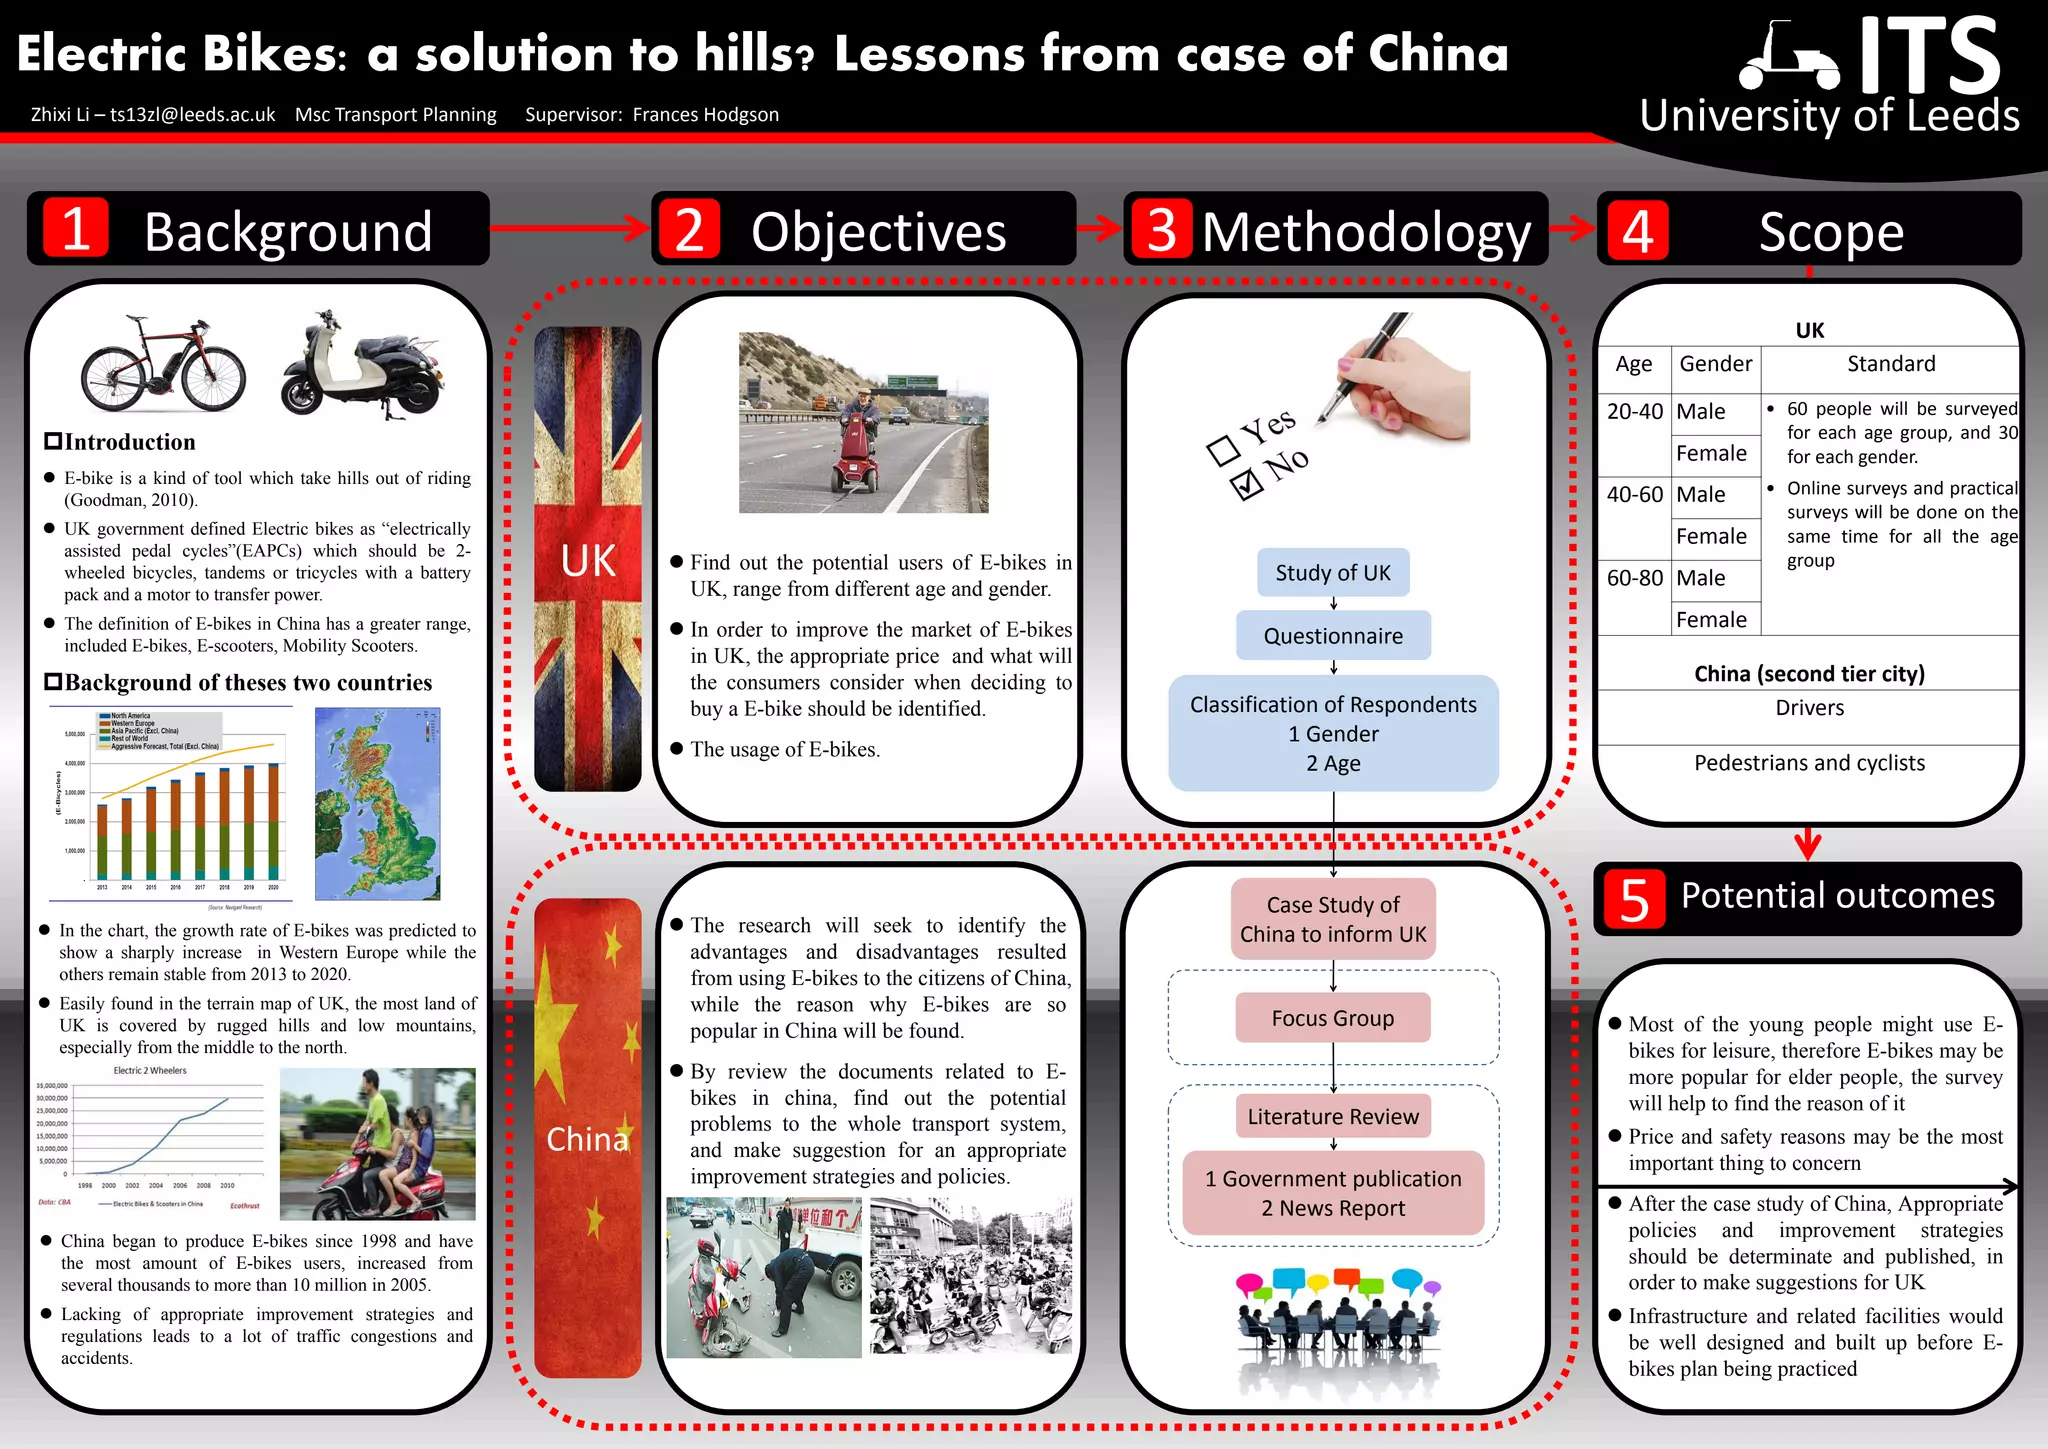
![Understanding travel behaviour to stadium and arena events :
A Cardiff case studyLaura Crank, MSc Transport Planning (FT)
Supervisor: Bryan Matthews
The importance of travelling to
events
The car is the most popular mode of transport to
stadium and arena events, and as the attendance of
such events increases, it is noted, “…the demand for
travel is heavily constrained both in time and space”
(Robbins et al. 2007:303). High demand in a short space
of time leads to congestion on the roads and
overcrowding on public transport.
Providing for such temporary ‘peak’ crowds would leave
the additional infrastructure and services underused for
the most part, which is economically unviable
(ibid:304).
The story so far…
Obtained at least 150 responses between face-to-face
and online surveys
Met with Cardiff Council’s Operations Manger of Major
Projects (Infrastructure) at one of the venues during
an event. Managed to discuss issues at hand and how
the council managed the city during large events
Methodology
Design survey taking into account aims and
objectives. Test survey to ensure it is
understandable and quick to complete
Sample a range of events to capture different socio-
economic groups
Conduct face-to-face surveys at both Millennium
Stadium and Motorpoint Arena, and promote online
survey to gain 200+ responses
Differentiate between results for each event,
establish differences in audiences, distances
travelled, travel habits
Conclude what would need to be done to encourage
modal shift to public transport
Aims and Objectives
To understand travel behaviour to events, developing on
previous research at other stadiums and arenas
It is becoming a
growing interest to
understand the
behaviour of
spectators and to
determine what
changes would have
to occur to the
public transport
system to increase
attractiveness and
modal share of
public transport to
events.
Research Questions
What is the percentage of different modes of transport
used to access events in Cardiff?
What factors influence mode choice to events in Cardiff?
Are there differences between mode choices to the two
venues?
Are different event audiences more “sustainable” in
their travel choices, or willing to change their event
travel habits?
What changes would have to be made to public transport
to increase its usage during events in Cardiff?
References
Robbins, D. et al. 2007. Planning Transport with Special Events: A Conceptual
Framework and Future Agenda for Research. International Journal of Tourism
Research. 9. Pp. 303-314.
Yeates, J. et al. 2009. Changing Travel Patterns of Arena Visitors:
Transportation Demand Management for Urban Arenas and Stadia. [Online]
Available at:
http://www.ite.org/Membersonly/techconference/2009/CB09C3001.pdf
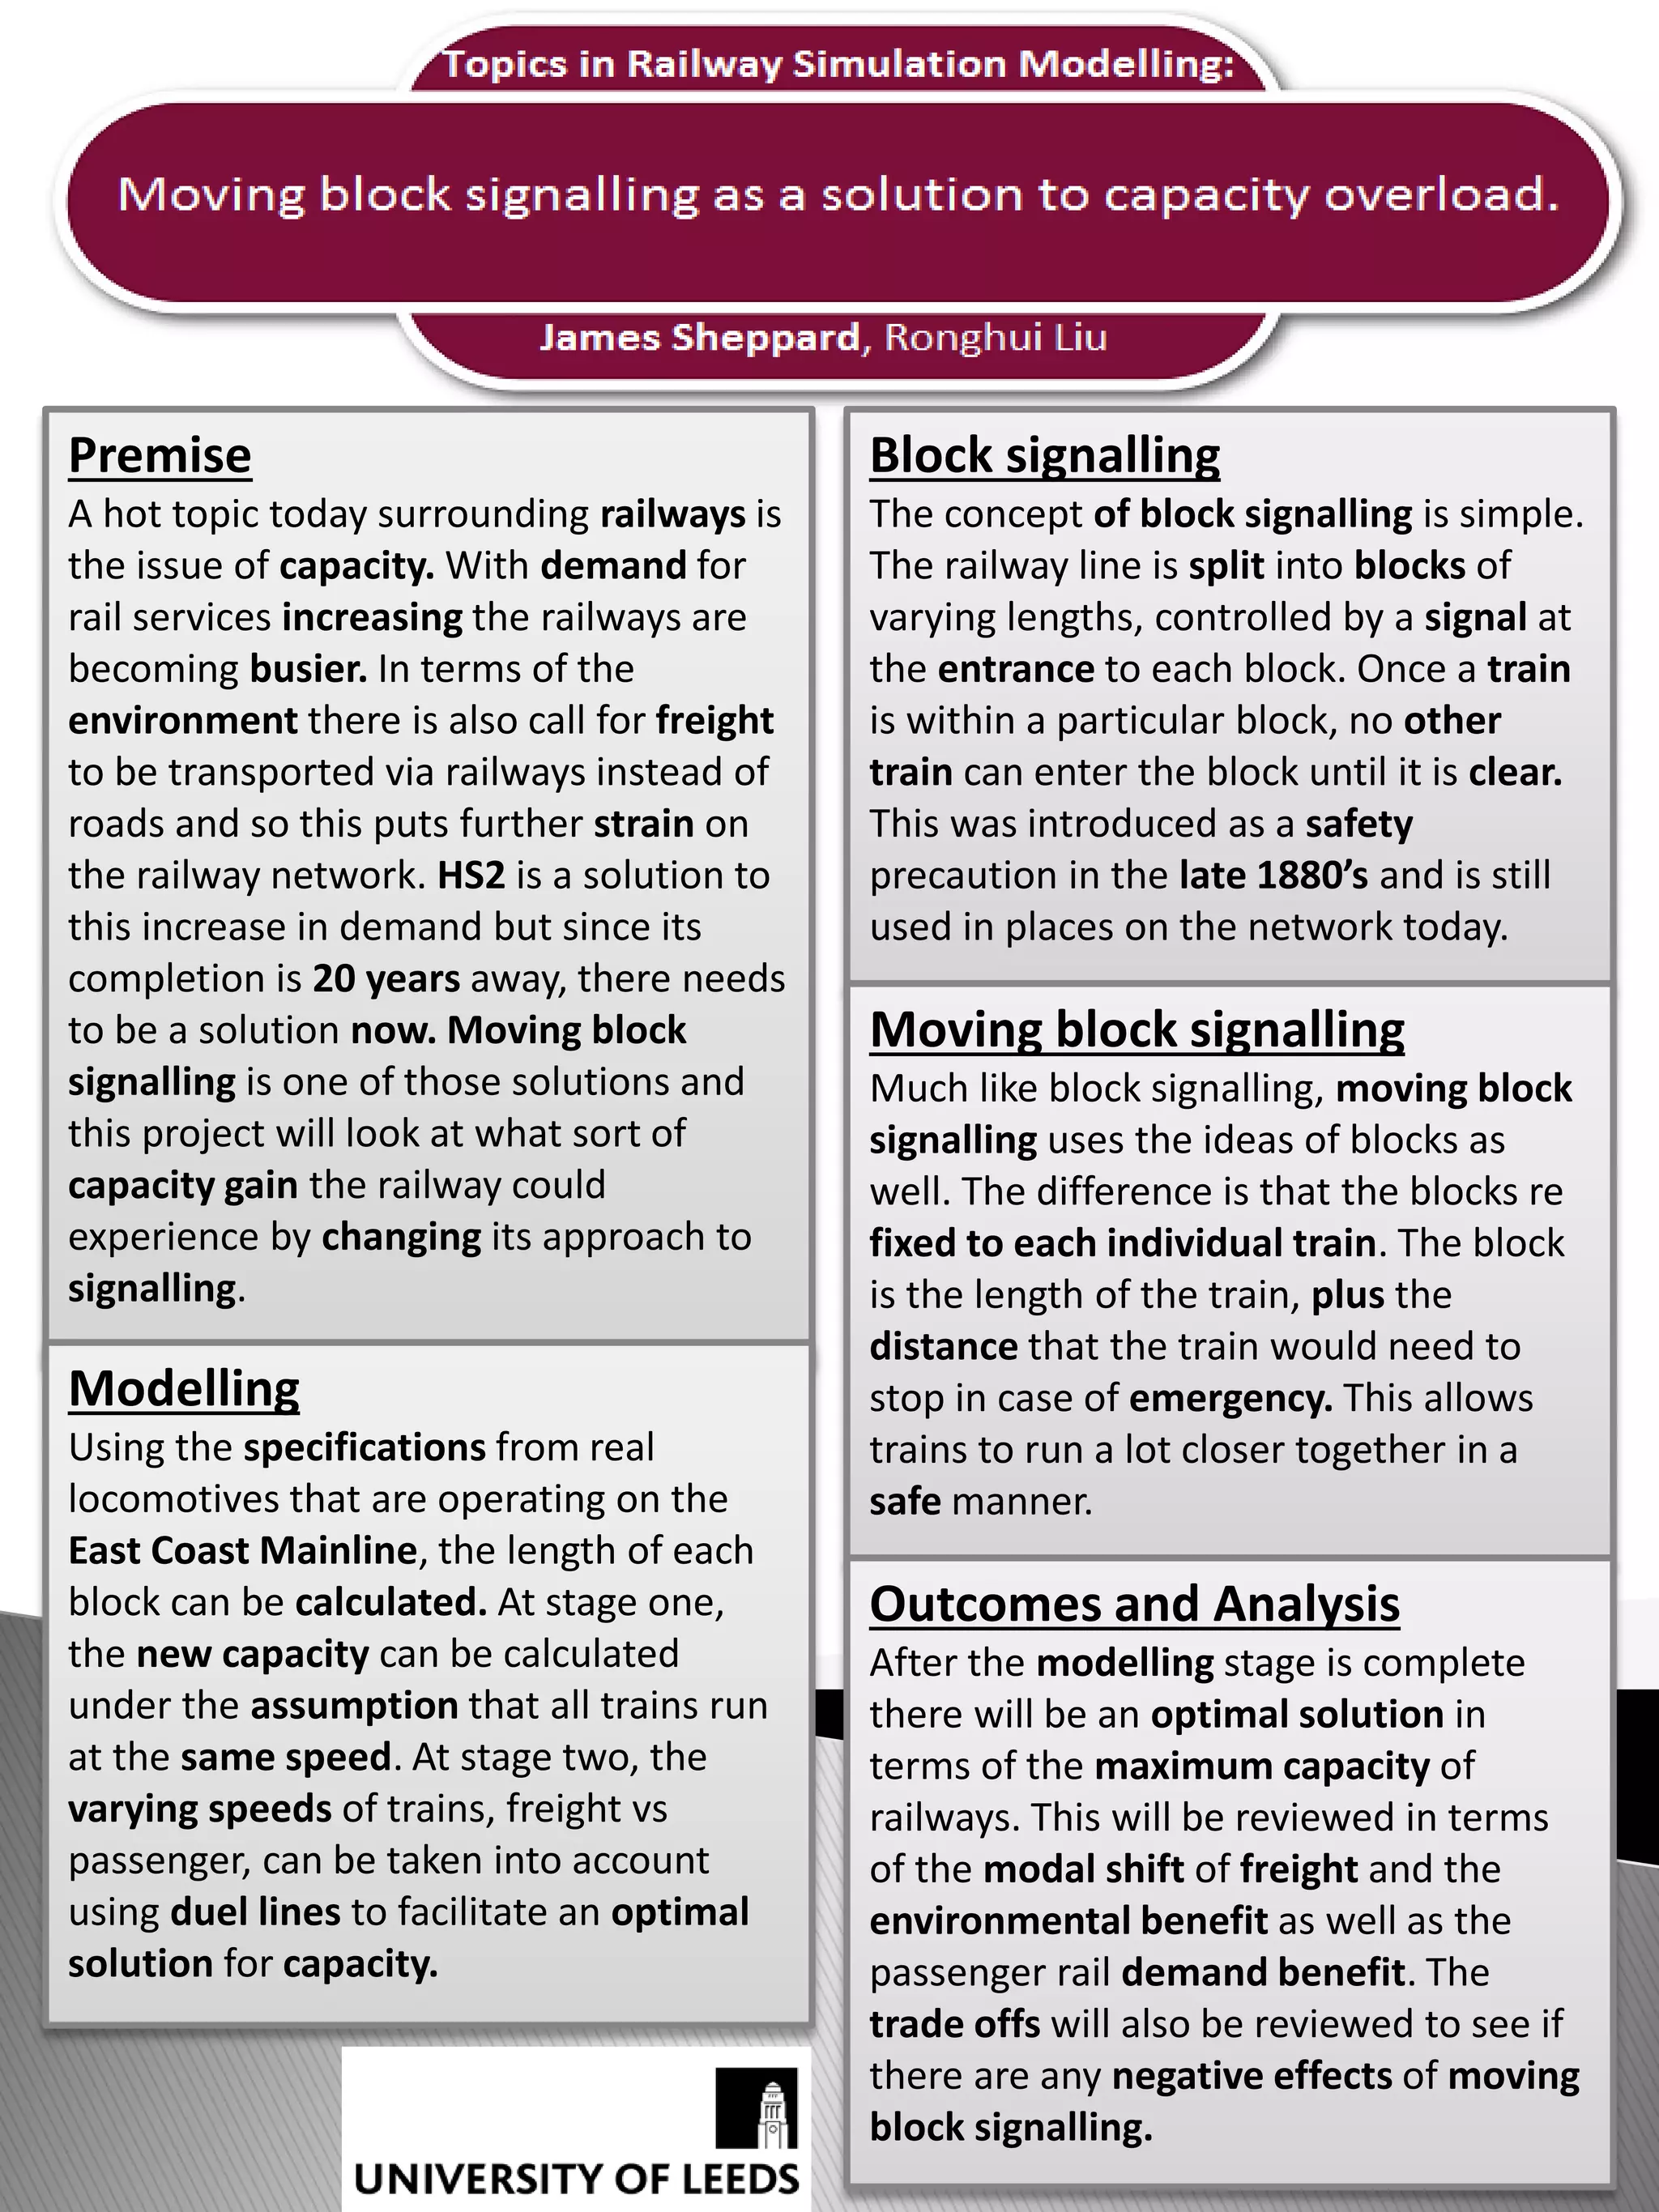
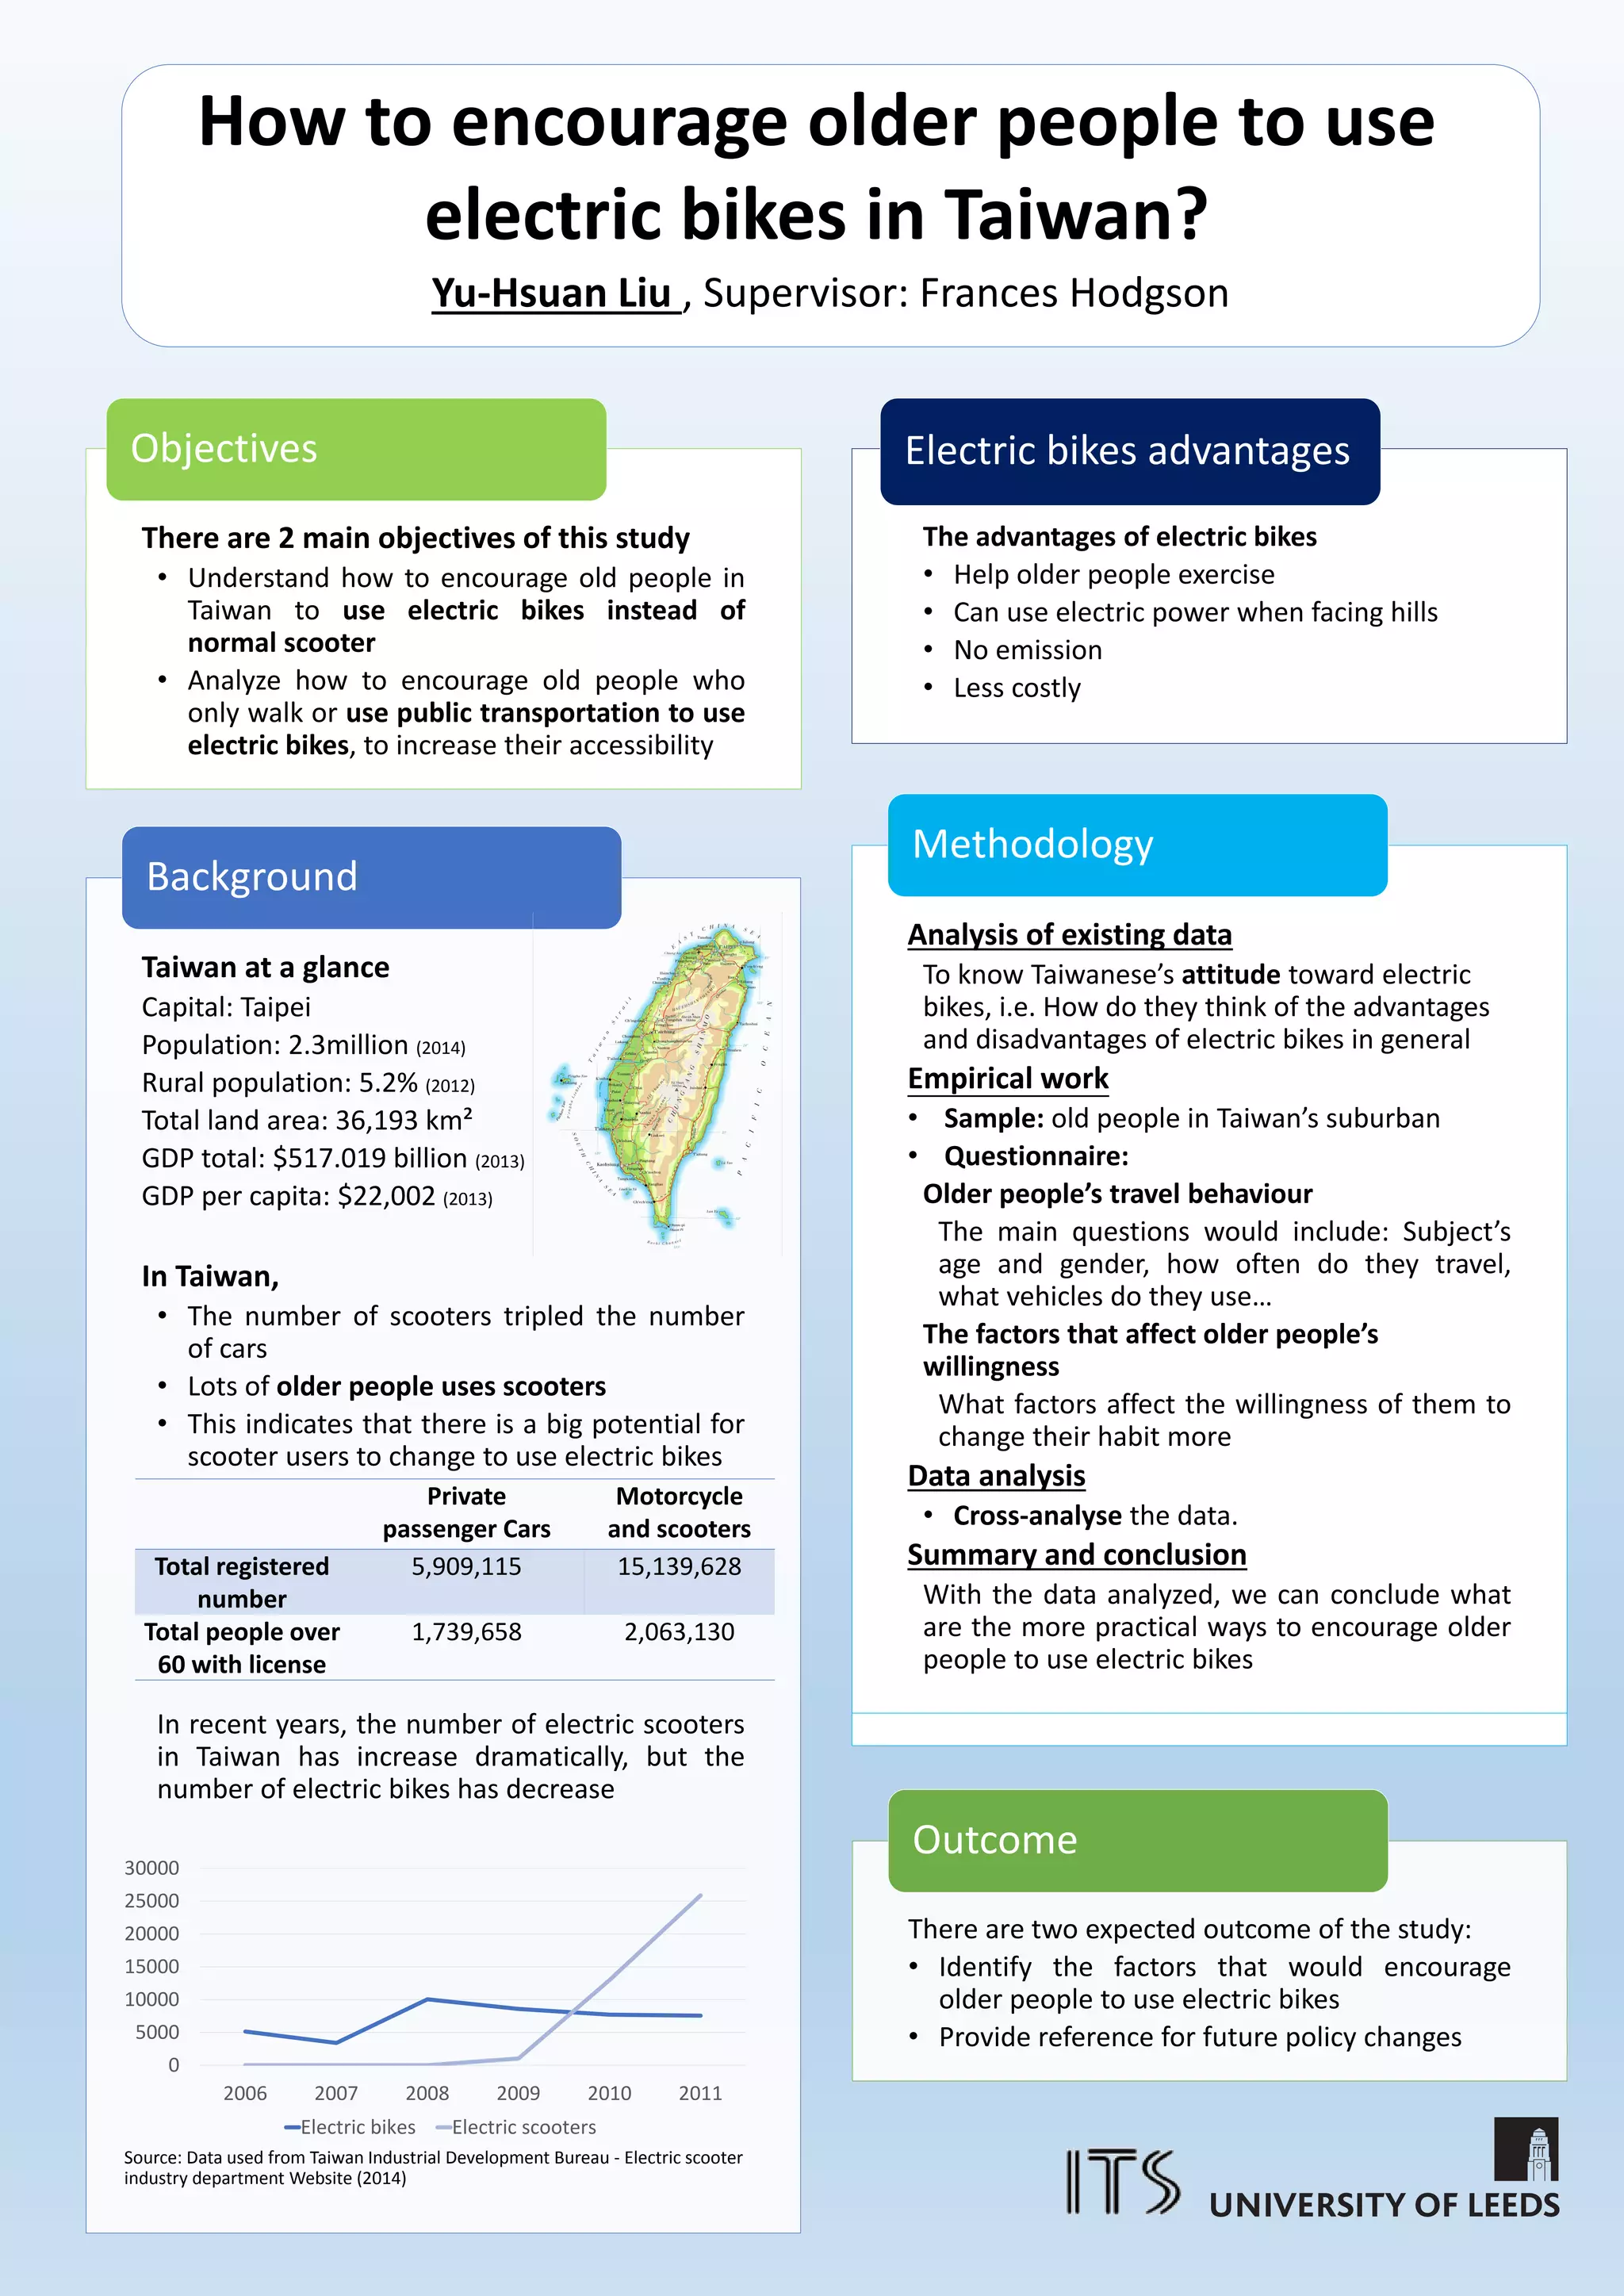
[Accessed April 2014] Washington: Institute of Transport Engineers. Modal split before and after TDM measures
Location of venues and public
transport stations in the vicinity of
the Cardiff region
A survey of stadium travel in
New York found that after
transport demand measures
(TDM) were implemented,
there was a decrease in car
travel to events, whilst
public transport use
increased.](https://image.slidesharecdn.com/allall-140515044924-phpapp01/75/Masters-Dissertation-Posters-2014-31-2048.jpg)
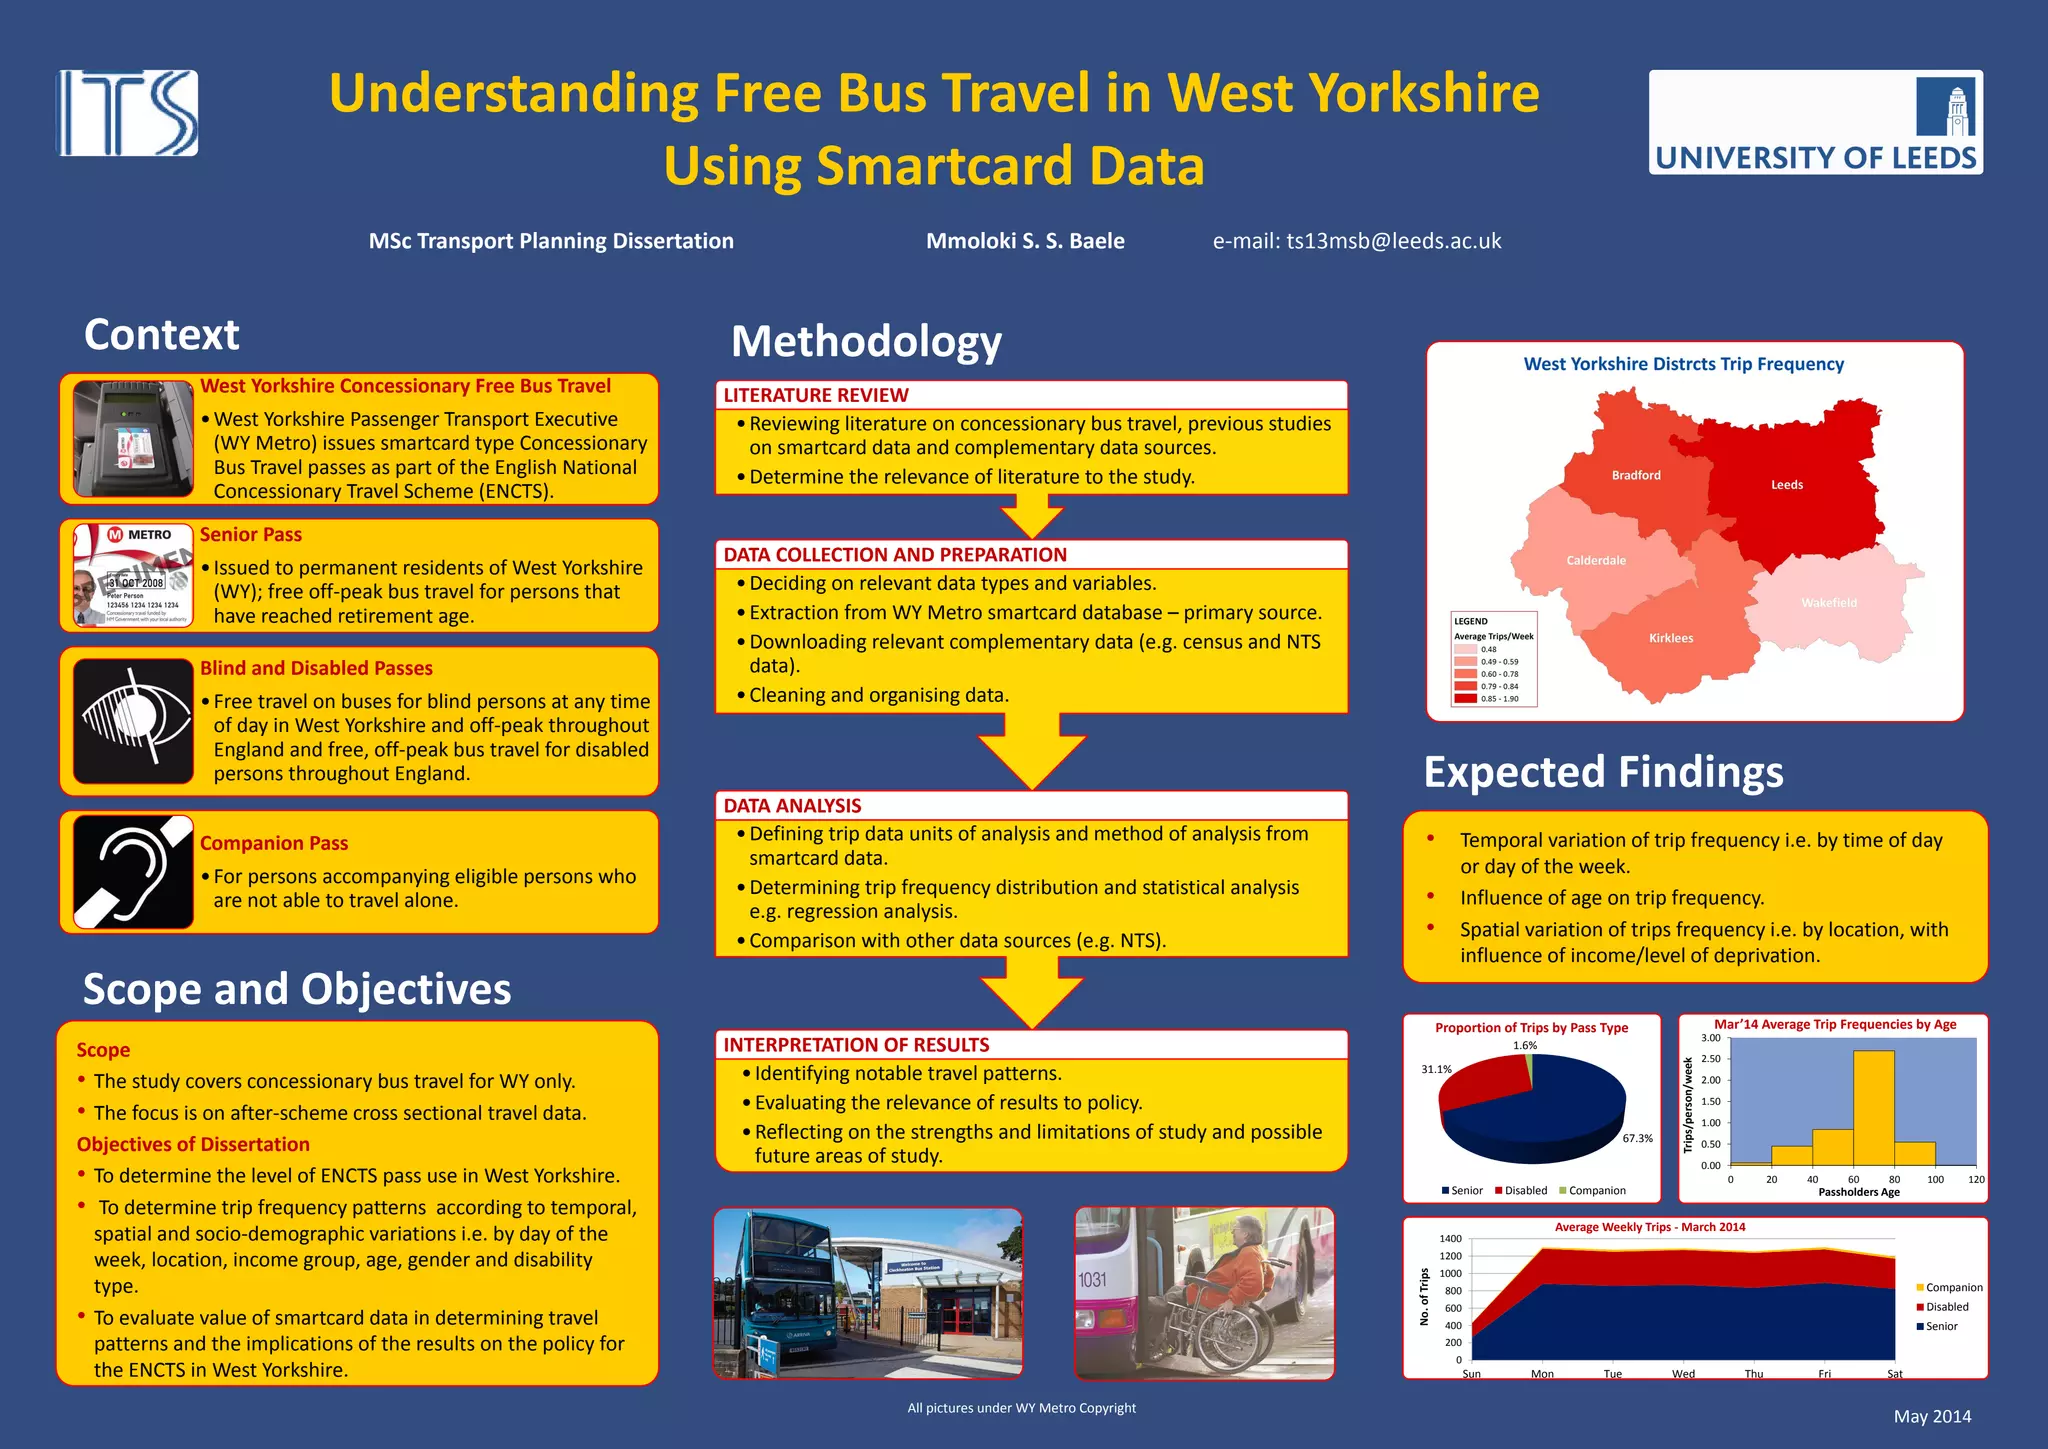

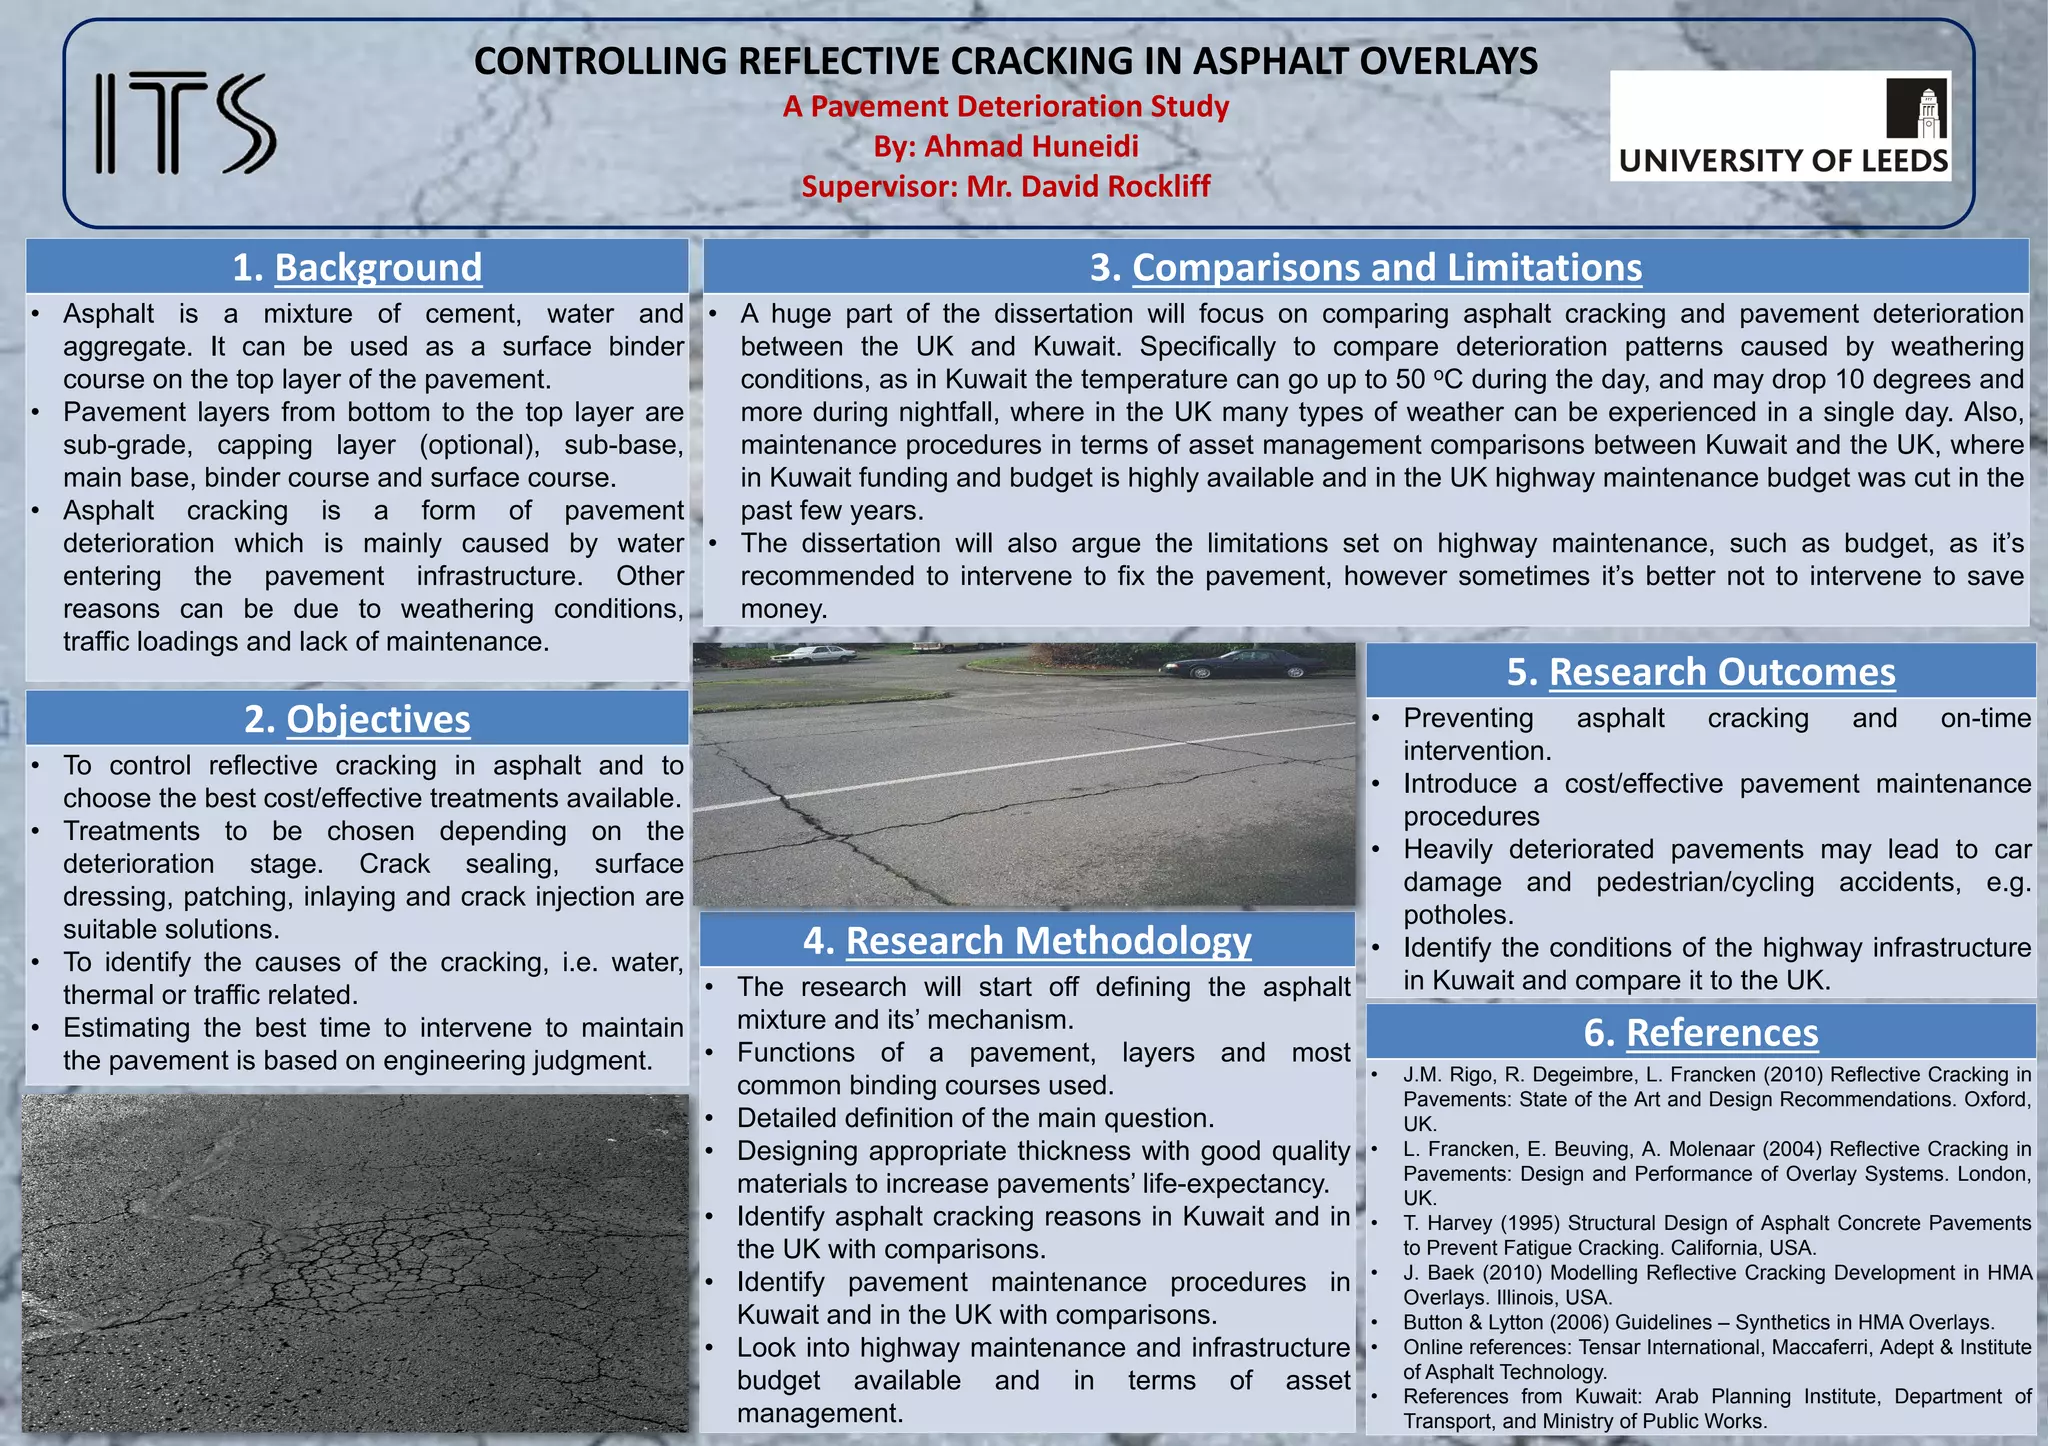
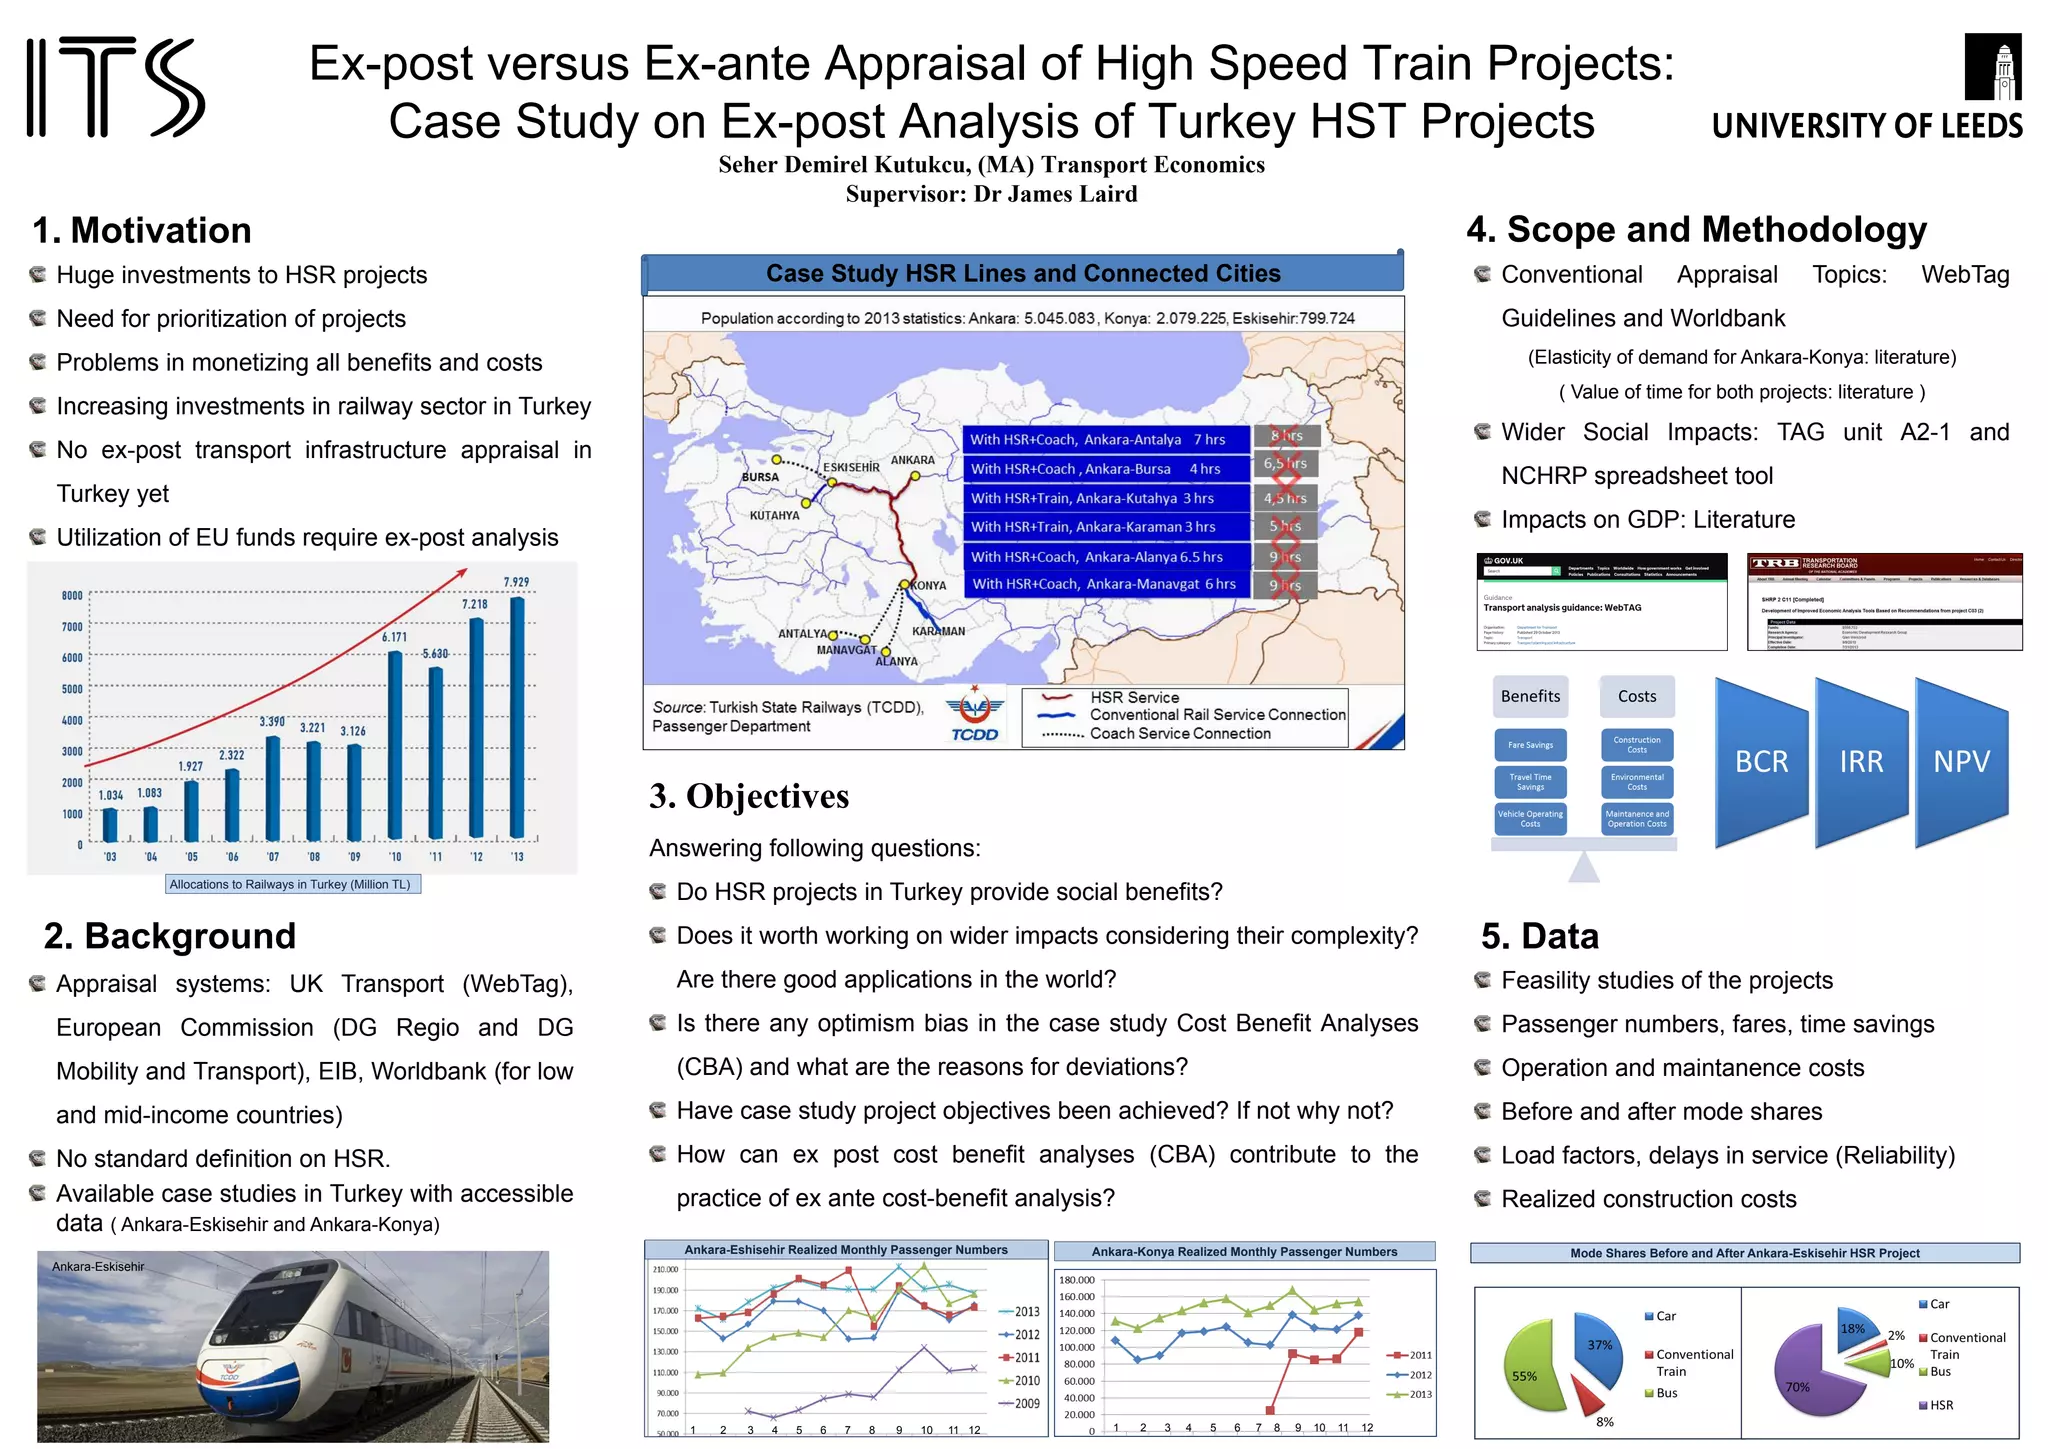
![www.kliaekspres.com www.ktmkomuter.com.my www.ktmb.com.my www.prasarana.com.my www.spad.gov.my
• Population ~29m
• Capital: Kuala Lumpur
• GDP per capita: ~10k USD
• Age group [16-64]
expandingKuala Lumpur Metropolitan Area (KLMA)
www.wikimedia.com
• Rapid motorization rate – Car Ownership at ~320 cars / 1000 per.
• Fuel subsidized – Oil producing country
- Approved Price / Floating Price Mechanism : Pump price
lower/equal than actual market value.
• Train Services: Intercity and Urban (KLMA) available
Components Description
Key Question
Deduction of constant elasticity
Method:
Urban: Trips Made
Intercity: Kilometer-Passenger
Urban: Trips Made
Intercity: Kilometer-Passenger
Online Survey - Considering type of trip, gender, income, location.
Dispersion question:
Given a situation is that the fuel price has gone very high and is no
longer affordable. If you had to make a leisure trip (visiting
family/friends, holiday etc) . If petrol prices are too high, how do
you travel?
A) Train B)Bus
Key Question:
Deduction of the cross elasticity of rail demand with respect of
pump car-fuel price.
Area and Mode
Area of study will be in Malaysia (East and West). Related modes:
Train and Cars.
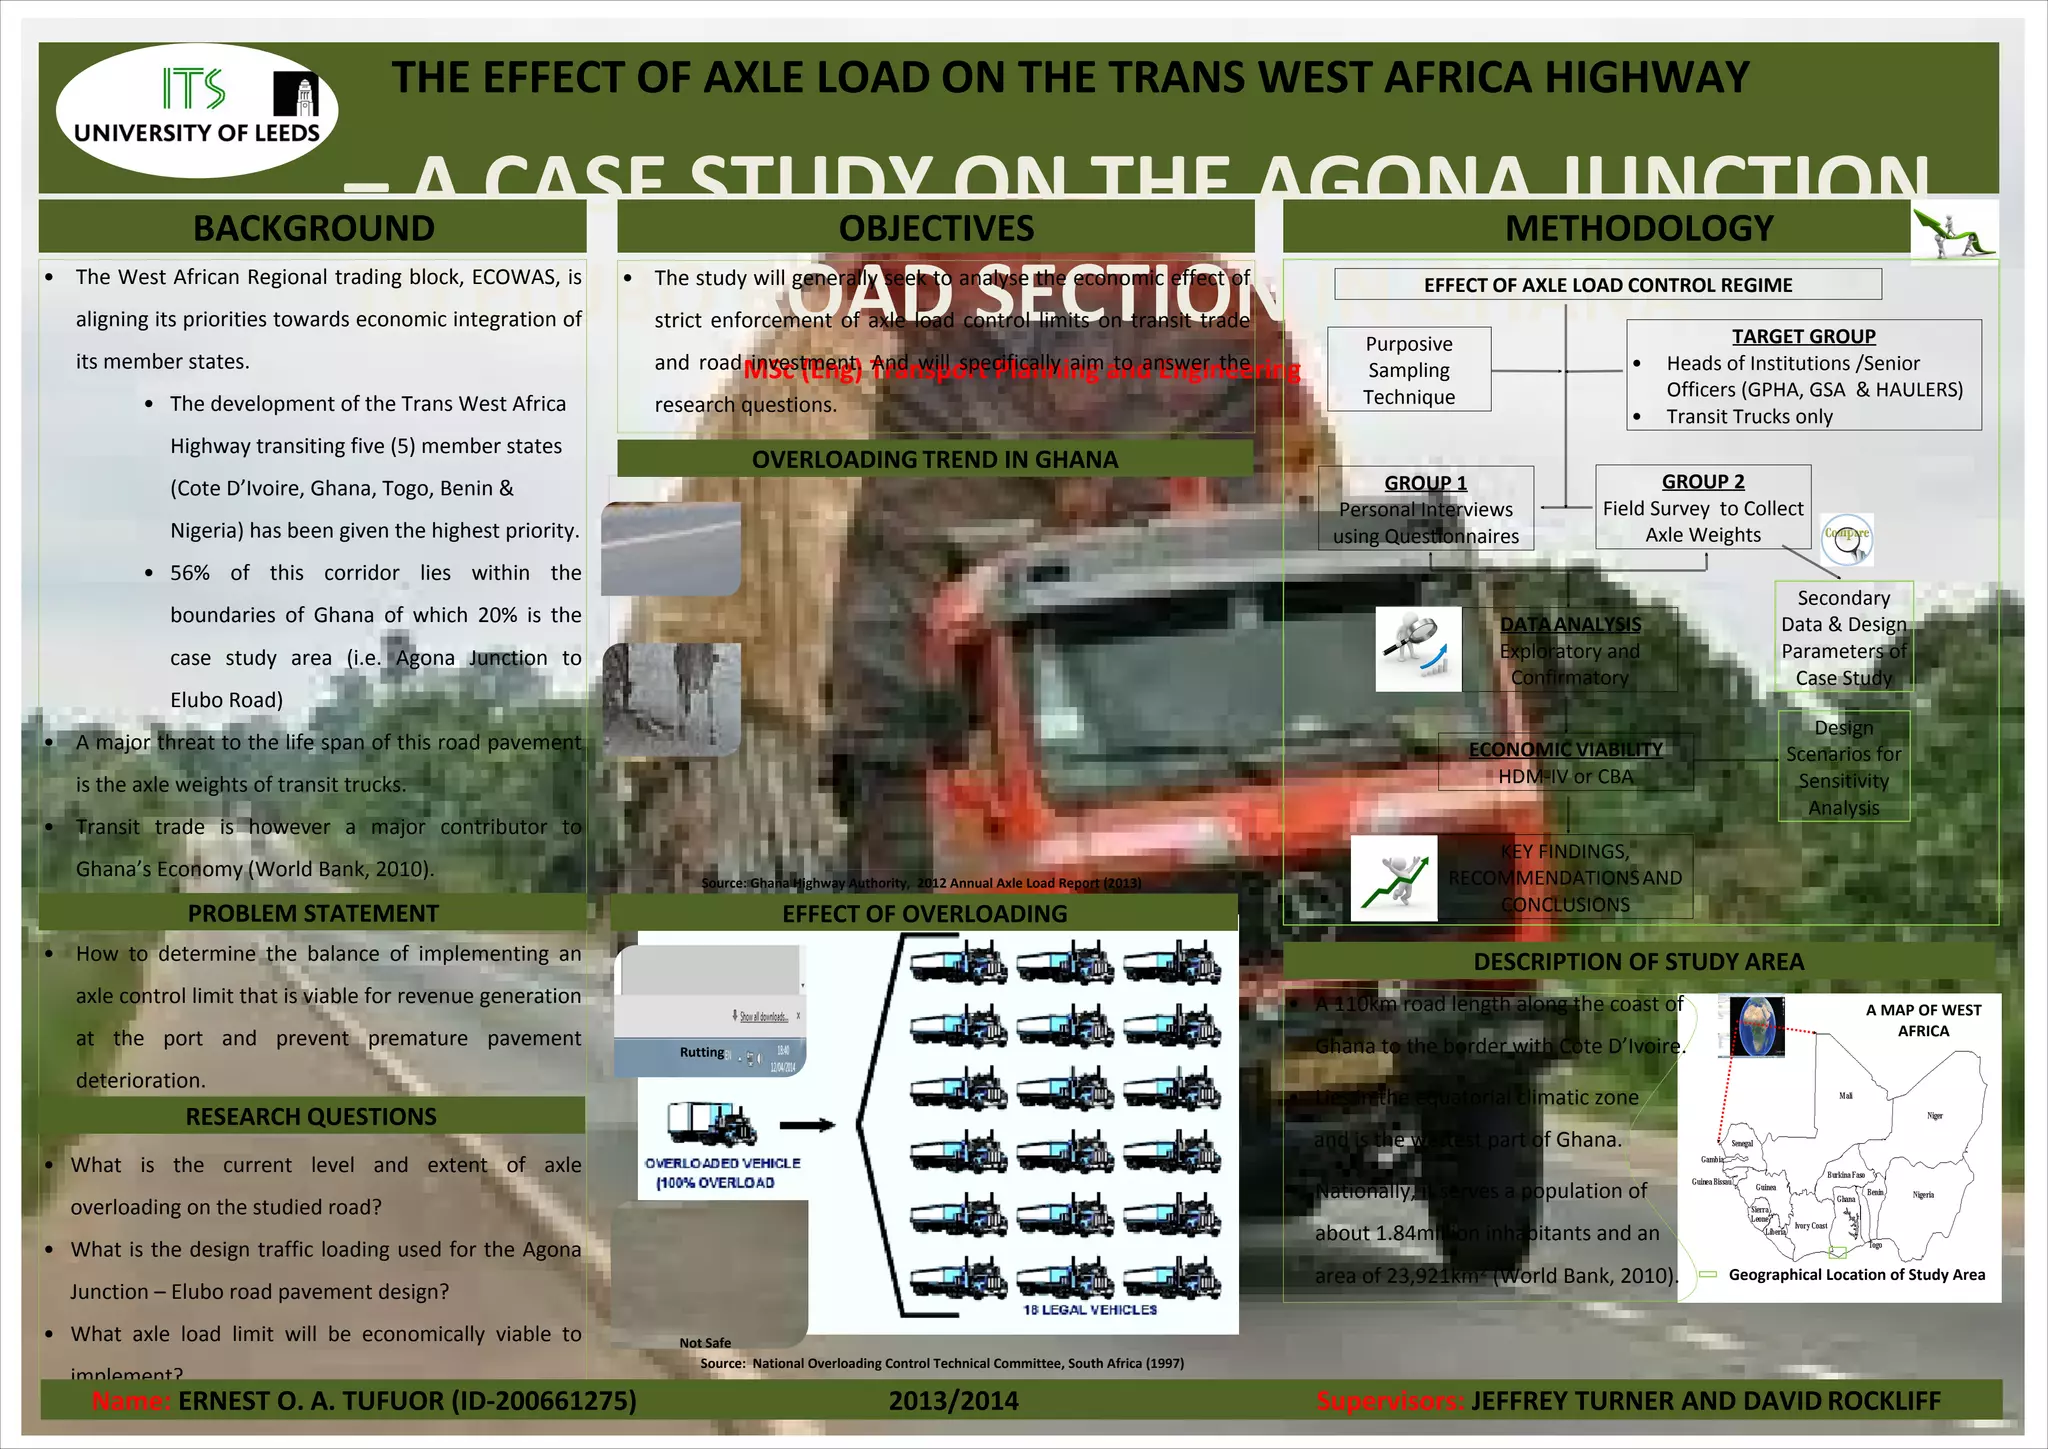
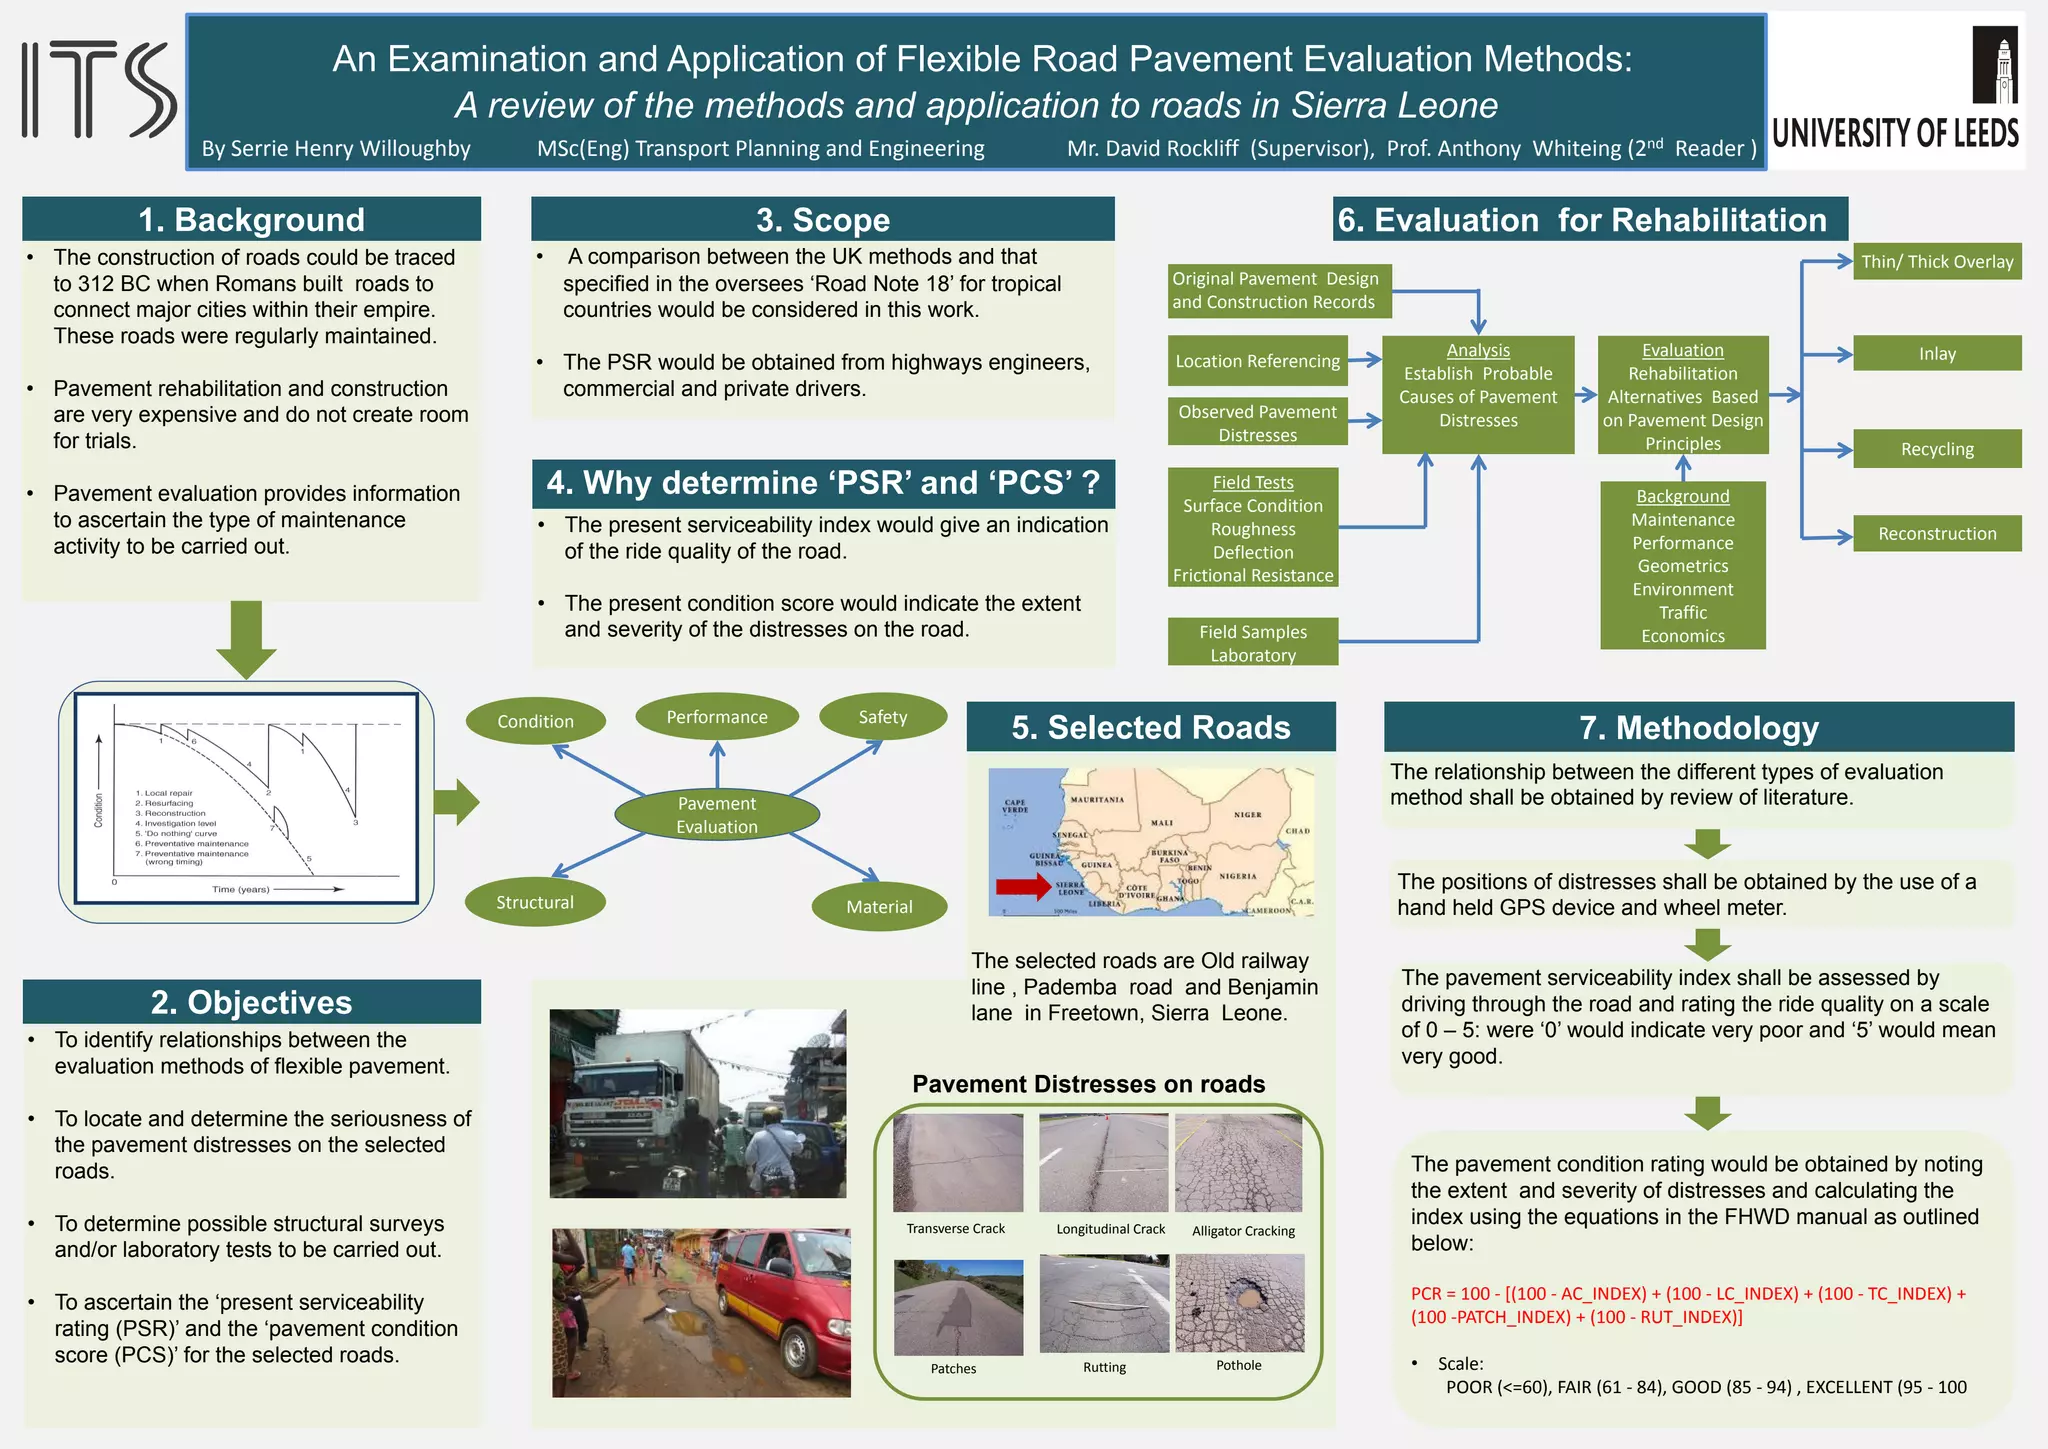
Impact of Car Petrol Prices on Rail Demand: The Case of Malaysia
Nik Mohd Rafiq Bin Wan Ibrahim
MSc. (Eng.) Transport Planning and Engineering
ts13nmrb@leeds.ac.uk
Supervisor:
Prof. Mark Wardman
Institute for Transport, University of Leeds
Quick Overview:
Deduction of the cross-elasticity of rail passenger
demand in Malaysia with respects to car petrol prices.
TrainCar
rainRidershipT
arRidershipC
iceCarFuelCariceCarFuelRail
V
V
,Pr,Pr, ||
1. Situation Appraisal 3. Scope 5. Methodology / Data Collection
4. Literature2. Motivation
iceCarFuelRail Pr,
iceCarFuelCar Pr,
rainRidershipTV
arRidershipCV
TrainCar,
Urban Rail
(Kuala Lumpur
Metropolitan Area)
Nationwide
Intercity Rail (Nationwide)
• Interesting to see in a fuel-subsidized country, where the
actual transport fuel cost is not paid by the user, would
there be any significant mode shift.
• As oppose to EU or UK, whereby taxation of fuel is a
national income stream, the effects of increase modal-
shift to trains (public transport in general) in countries
where fuel are “costly” to the nation, would be a point of
interest.
• Trending projects to improve in urban rail especially in
KLMA and intercity rail services (Double Track, HSR)
• Subsidy will be removed?
Acutt and Dodgson 1996, Cross elasticities of demand for
travel, Transport Policy Vol 2, pp. 271-277
Train Type Year Cross Elasticity w.r.t car-fuel
price
InterCity, NSE,
Regional
1992/93 0.041 – 0.094
Underground 1992/93 0.017
Train Type Year Cross Elasticity w.r.t car-cost
Inter Urban - 0.59
Urban - 0.25
Paullney et al 2006, The demand for public transport: The
effects of fares. Quality service and car ownership,
Transport Policy, 13(4), pp. 295-306
40.0
50.0
60.0
70.0
80.0
90.0
100.0
110.0
120.0
130.0
1980
1982
1984
1986
1988
1990
1992
1994
1996
1998
2000
2002
2004
2006
2008
2010
2012
Consumer Price Index
(2000 = 100) (Source
DOSM)
0
2000
4000
6000
8000
10000
12000
14000
1980
1982
1984
1986
1988
1990
1992
1994
1996
1998
2000
2002
2004
2006
2008
2010
2012
Retail Fuel Sold [million
liters] (RON97 + RON95)
(Source KPDNKK)
0
20000000
40000000
60000000
80000000
100000000
120000000
140000000
160000000
180000000
200000000
1980
1982
1984
1986
1988
1990
1992
1994
1996
1998
2000
2001
2003
2005
2007
2009
2011
Passenger Ridership Urban
Rail (Source: EPU)
0
200000000
400000000
600000000
800000000
1E+09
1.2E+09
1.4E+09
1.6E+09
1.8E+09
1980
1982
1984
1986
1988
1990
1992
1994
1996
1998
2000
2002
2004
2006
2008
2010
2012
Railways, passengers
carried (passenger-km)
[Source: DOSM]
MALAYSIA
Objective:
To investigate the relationship of car fuel price to rail demand.
Increasing of car fuel price (either due to global market or
government’s removal of the subsidy) should hypothetically
increase train patronage.
1. Literature Review on global PED
2. On-line Survey: Stated Preference
3. Regression from existing data:
Cross elasticity is calculated using an equation that consists of several components.
These components are partly review from literature to compare other
international values followed by a re-calculation using method described below. A
crucial part of this study is an online survey to deduce the diversion factor; non-
payable option of cost car-fuel is hypothesized.
(Source: DOSM)
0
0.1
0.2
0.3
0.4
0.5
0.6
0.7
1980
1984
1988
1992
1996
2000
2004
2008
2012
Pump
price for
gasoline
(US$ per
liter)
(Source:
World
Bank)
0
20000
40000
60000
80000
100000
120000
140000
160000
180000
0
500
1000
1500
2000
2500
1980
1982
1984
1986
1988
1990
1992
1994
1996
1998
2000
2002
2004
2006
2008
2010
2012
Length of railway track (km)
(Source: DOSM)
Roads, total network (km)
(Source: World Bank)
Track(km)
RoadNetwork(km)
-
5,000,000
10,000,000
15,000,000
20,000,000
25,000,000
1980
1986
1992
1998
2004
2010
Cars
Motorcycle
Other Vehicles
Goods Vehicle
Bus
Taxi and Private
Hire
Mileage travelled
Deduction from Retails Fuel Sold –
considering fractioning to cars and yearly
fuel consumption, calibrated with
VehicleKilometerTravelled (recent Survey)
Pump Fuel Price
Considering
Consumer Price
Index
Registered Vehicles over time](https://image.slidesharecdn.com/allall-140515044924-phpapp01/75/Masters-Dissertation-Posters-2014-36-2048.jpg)
![• The construction of roads could be traced
to 312 BC when Romans built roads to
connect major cities within their empire.
These roads were regularly maintained.
• Pavement rehabilitation and construction
are very expensive and do not create room
for trials.
• Pavement evaluation provides information
to ascertain the type of maintenance
activity to be carried out.
An Examination and Application of Flexible Road Pavement Evaluation Methods:
A review of the methods and application to roads in Sierra Leone
1. Background
2. Objectives
• To identify relationships between the
evaluation methods of flexible pavement.
• To locate and determine the seriousness of
the pavement distresses on the selected
roads.
• To determine possible structural surveys
and/or laboratory tests to be carried out.
• To ascertain the ‘present serviceability
rating (PSR)’ and the ‘pavement condition
score (PCS)’ for the selected roads.
Transverse Crack Longitudinal Crack
RuttingPatches
Alligator Cracking
Pothole
7. Methodology
Pavement Distresses on roads
• The present serviceability index would give an indication
of the ride quality of the road.
• The present condition score would indicate the extent
and severity of the distresses on the road.
4. Why determine ‘PSR’ and ‘PCS’ ?
5. Selected Roads
By Serrie Henry Willoughby MSc(Eng) Transport Planning and Engineering Mr. David Rockliff (Supervisor), Prof. Anthony Whiteing (2nd Reader )
• A comparison between the UK methods and that
specified in the oversees ‘Road Note 18’ for tropical
countries would be considered in this work.
• The PSR would be obtained from highways engineers,
commercial and private drivers.
3. Scope
The relationship between the different types of evaluation
method shall be obtained by review of literature.
The positions of distresses shall be obtained by the use of a
hand held GPS device and wheel meter.
The pavement serviceability index shall be assessed by
driving through the road and rating the ride quality on a scale
of 0 – 5: were ‘0’ would indicate very poor and ‘5’ would mean
very good.
The pavement condition rating would be obtained by noting
the extent and severity of distresses and calculating the
index using the equations in the FHWD manual as outlined
below:
PCR = 100 - [(100 - AC_INDEX) + (100 - LC_INDEX) + (100 - TC_INDEX) +
(100 -PATCH_INDEX) + (100 - RUT_INDEX)]
• Scale:
POOR (<=60), FAIR (61 - 84), GOOD (85 - 94) , EXCELLENT (95 - 100
The selected roads are Old railway
line , Pademba road and Benjamin
lane in Freetown, Sierra Leone.
Original Pavement Design
and Construction Records
Analysis
Establish Probable
Causes of Pavement
DistressesObserved Pavement
Distresses
Field Tests
Surface Condition
Roughness
Deflection
Frictional Resistance
Field Samples
Laboratory
Evaluation
Rehabilitation
Alternatives Based
on Pavement Design
Principles
Background
Maintenance
Performance
Geometrics
Environment
Traffic
Economics
Thin/ Thick Overlay
Inlay
Recycling
Reconstruction
Pavement
Evaluation
PerformanceCondition Safety
Structural Material
6. Evaluation for Rehabilitation
Location Referencing](https://image.slidesharecdn.com/allall-140515044924-phpapp01/75/Masters-Dissertation-Posters-2014-43-2048.jpg)

![ECONOMY ENVIRONMENT
+ Reducing the cost of import fossil fuels
+ Gaining profit by export biofuels
+ Reuse abandoned agricultural land
− Low energy density of biofuels, lead to more
distances, travel times and labour costs.
− Feedstock processing costs
+ Less GHG emission
+ Carbon negative renewable energy
− Extra trips/distances are needed for collecting
feedstock cause greater air pollution
− The changes of Land use cause emissions
− Decrease biodiversity
− Decrease soil, water quality
SOCIETY ENERGY SECURITY
+ Increase employments
+ The fuel prices become more reasonable
− Food security concerns
− Poor quality of biofuels decrease the vehicles
performances
− The hi-tech vehicles are not affordable for the
whole public, increase the inequality.
+ As an alternative energy source to enhance
energy security
− The failure of implement biofuels can weaken
energy security
− Hard to forecast if biofuels face the same
situation like oil crisis in the future
“4ASPECTS”OFIMPACTSAIMS&OBJECTIVESMETHODOLOGY
Rose I-Hsuan Lien (ts13ihl@leeds.ac.uk), Supervised by Dr Anthony Whiteing
iofuel’s issue used to focus on its energy efficiency and the food crisis it
might cause. However, how to optimise the supply chain still lack of
discussion at present. To illustrate, negative impacts of biofuel supply
chain not only need to be recognised but be solved through sustainable
ways. The main missions of this supply chain management are to
ensure the costs are competitive and the supplies are continuous (Gold
and Seuring, 2011; Hess et al., 2007; Sims and Venturi, 2004). The
demands of biofuel in Taiwan are increasing. Since the usages of
biofuels in Taiwan are still developing, it is an advantage for Taiwan to
implement the sustainable strategies into the supply chain.
Harvest & collect
·Feedstock type
·Harvest frequency
·Topography
·Post-harvest process
place (bail and chip)
Storage
·Demands & supplies
·Storage facilities
·At farm or storage
terminal
·Degradation & dry
matter loss
Pre-treatment
· Pre-treatment with
storage
· Mode: drying,
pelletisation
Energy conversion
· Place for refine and
blend
Gas station
· The facilities to
store biofuels
Consumer
· Vehicle
performance
· Vehicle choices
Transport:Modechoice,law&infrastructure,vehiclescapacity
Reference: ①Green Energy Industry Information Net, (2014). Introduction of biofuels Industry. Taiwangreenenergy.org.tw. Available at: http://www.taiwangreenenergy.org.tw/Domain/domain-4.aspx
②Hess, J.R., Wright, C.T., Kenney, K.L., 2007. Cellulosic biomass feedstocks and logistics for ethanol production. Biofuels, Bioproducts and Biorefining 1 (3), 181e190. ③Gold, S. and Seuring, S. 2011.
Supply chain and logistics issues of bio-energy production. Journal of Cleaner Production, 19 (1), pp. 32--42. ④IEA. 2013. Tracking Clean Energy Progress 2013. [e-book] Paris: Internation Energy
Agency. Available through: Internation Energy Agency http://www.iea.org/publications/TCEP_web.pdf. ⑤Sims, R.E.H., Venturi, P., 2004. All-year-round harvesting of short rotation coppice eucalyptus
compared with the delivered costs of biomass from more conven- tional short season, harvesting systems. Biomass and Bioenergy 26 (1), 27e37.
B
1. Case studies:
Studying biofuel promoting schemes in developed/emerging/developing countries to compare and
organise the implementations under different circumstances.
2. Interviews:
To apply potential options to Taiwan, the locals’ opinions and experiences are important. Thus the options
will be provided to experts in different areas - academic, planner, government, sustainable workers in
Taiwan, and interview them to know the attitudes and possibilities to implement these options.
PROBLEM → APPROACH → SOLUTION → ADAPTION → APPLICATION
Understand
biofuels
implementation
Understand
operation
processes
Develop sustainable
Instruments
Develop
options for
Taiwan
Summarise the feasibilities of
options
①Policies&
infrastructures
②Impacts in “4
aspects”
③Future goals &
trends
①”Who” drive
&“who” are
involved
② Operation
processes
③Differences
between
nations
①Instruments integration
②Factors of instrument
choices
③Underlying barriers and
conflicts
④Strengths &
weaknesses in “4
aspects”
①Develop
options
②Stakeholders’
viewpoints
①The most and the least
feasible options
②Influents of choices
③Conflicts of influents
between different
stakeholders
④Improve options:
negative↓, positive↑
(Gold and Seuring, 2011)
Case in Taiwan:
Bioethanol:
(Import only, no local factories (high investment risk))
•07/2009:Taipei&Kaohsiung Metro Area Ethanol
Promotion Project, total 14 gas stations supply E3.
•2012: 210 kilolitres used.
Biodiesel:
(Imported palm oils and local cooking waste oils)
4 stages implement plan:
1.11/2006-06/2008: Green Bus Project, encouraged
buses use B1-B5 biodiesel
2.07/2007-06/2008: Green County Project (B1), in two
counties, the oil companies in these areas were
chosen to blend biodiesels and to sell in the gas
station there. B100 biodiesel were refined by Taiwan
factories , also energy crops were allocated to plant in
fallow farmlands.
3.07/2008: Full implement B1
4.06/2010: Full implement B2
• 2012: 100,000 kilolitres used.
• 2014: Poor quality of biodiesels influenced vehicles
performance, government plan to pause B2 projects
in June.
• 2016: Full implement B5, estimated 250,000 kilolitres
biodiesel required.
(Green Energy Industry Information Net, 2014)
OPERATION ISSUES
Global biofuel productions projections and target.
(Source: IEA, 2013)](https://image.slidesharecdn.com/allall-140515044924-phpapp01/75/Masters-Dissertation-Posters-2014-50-2048.jpg)
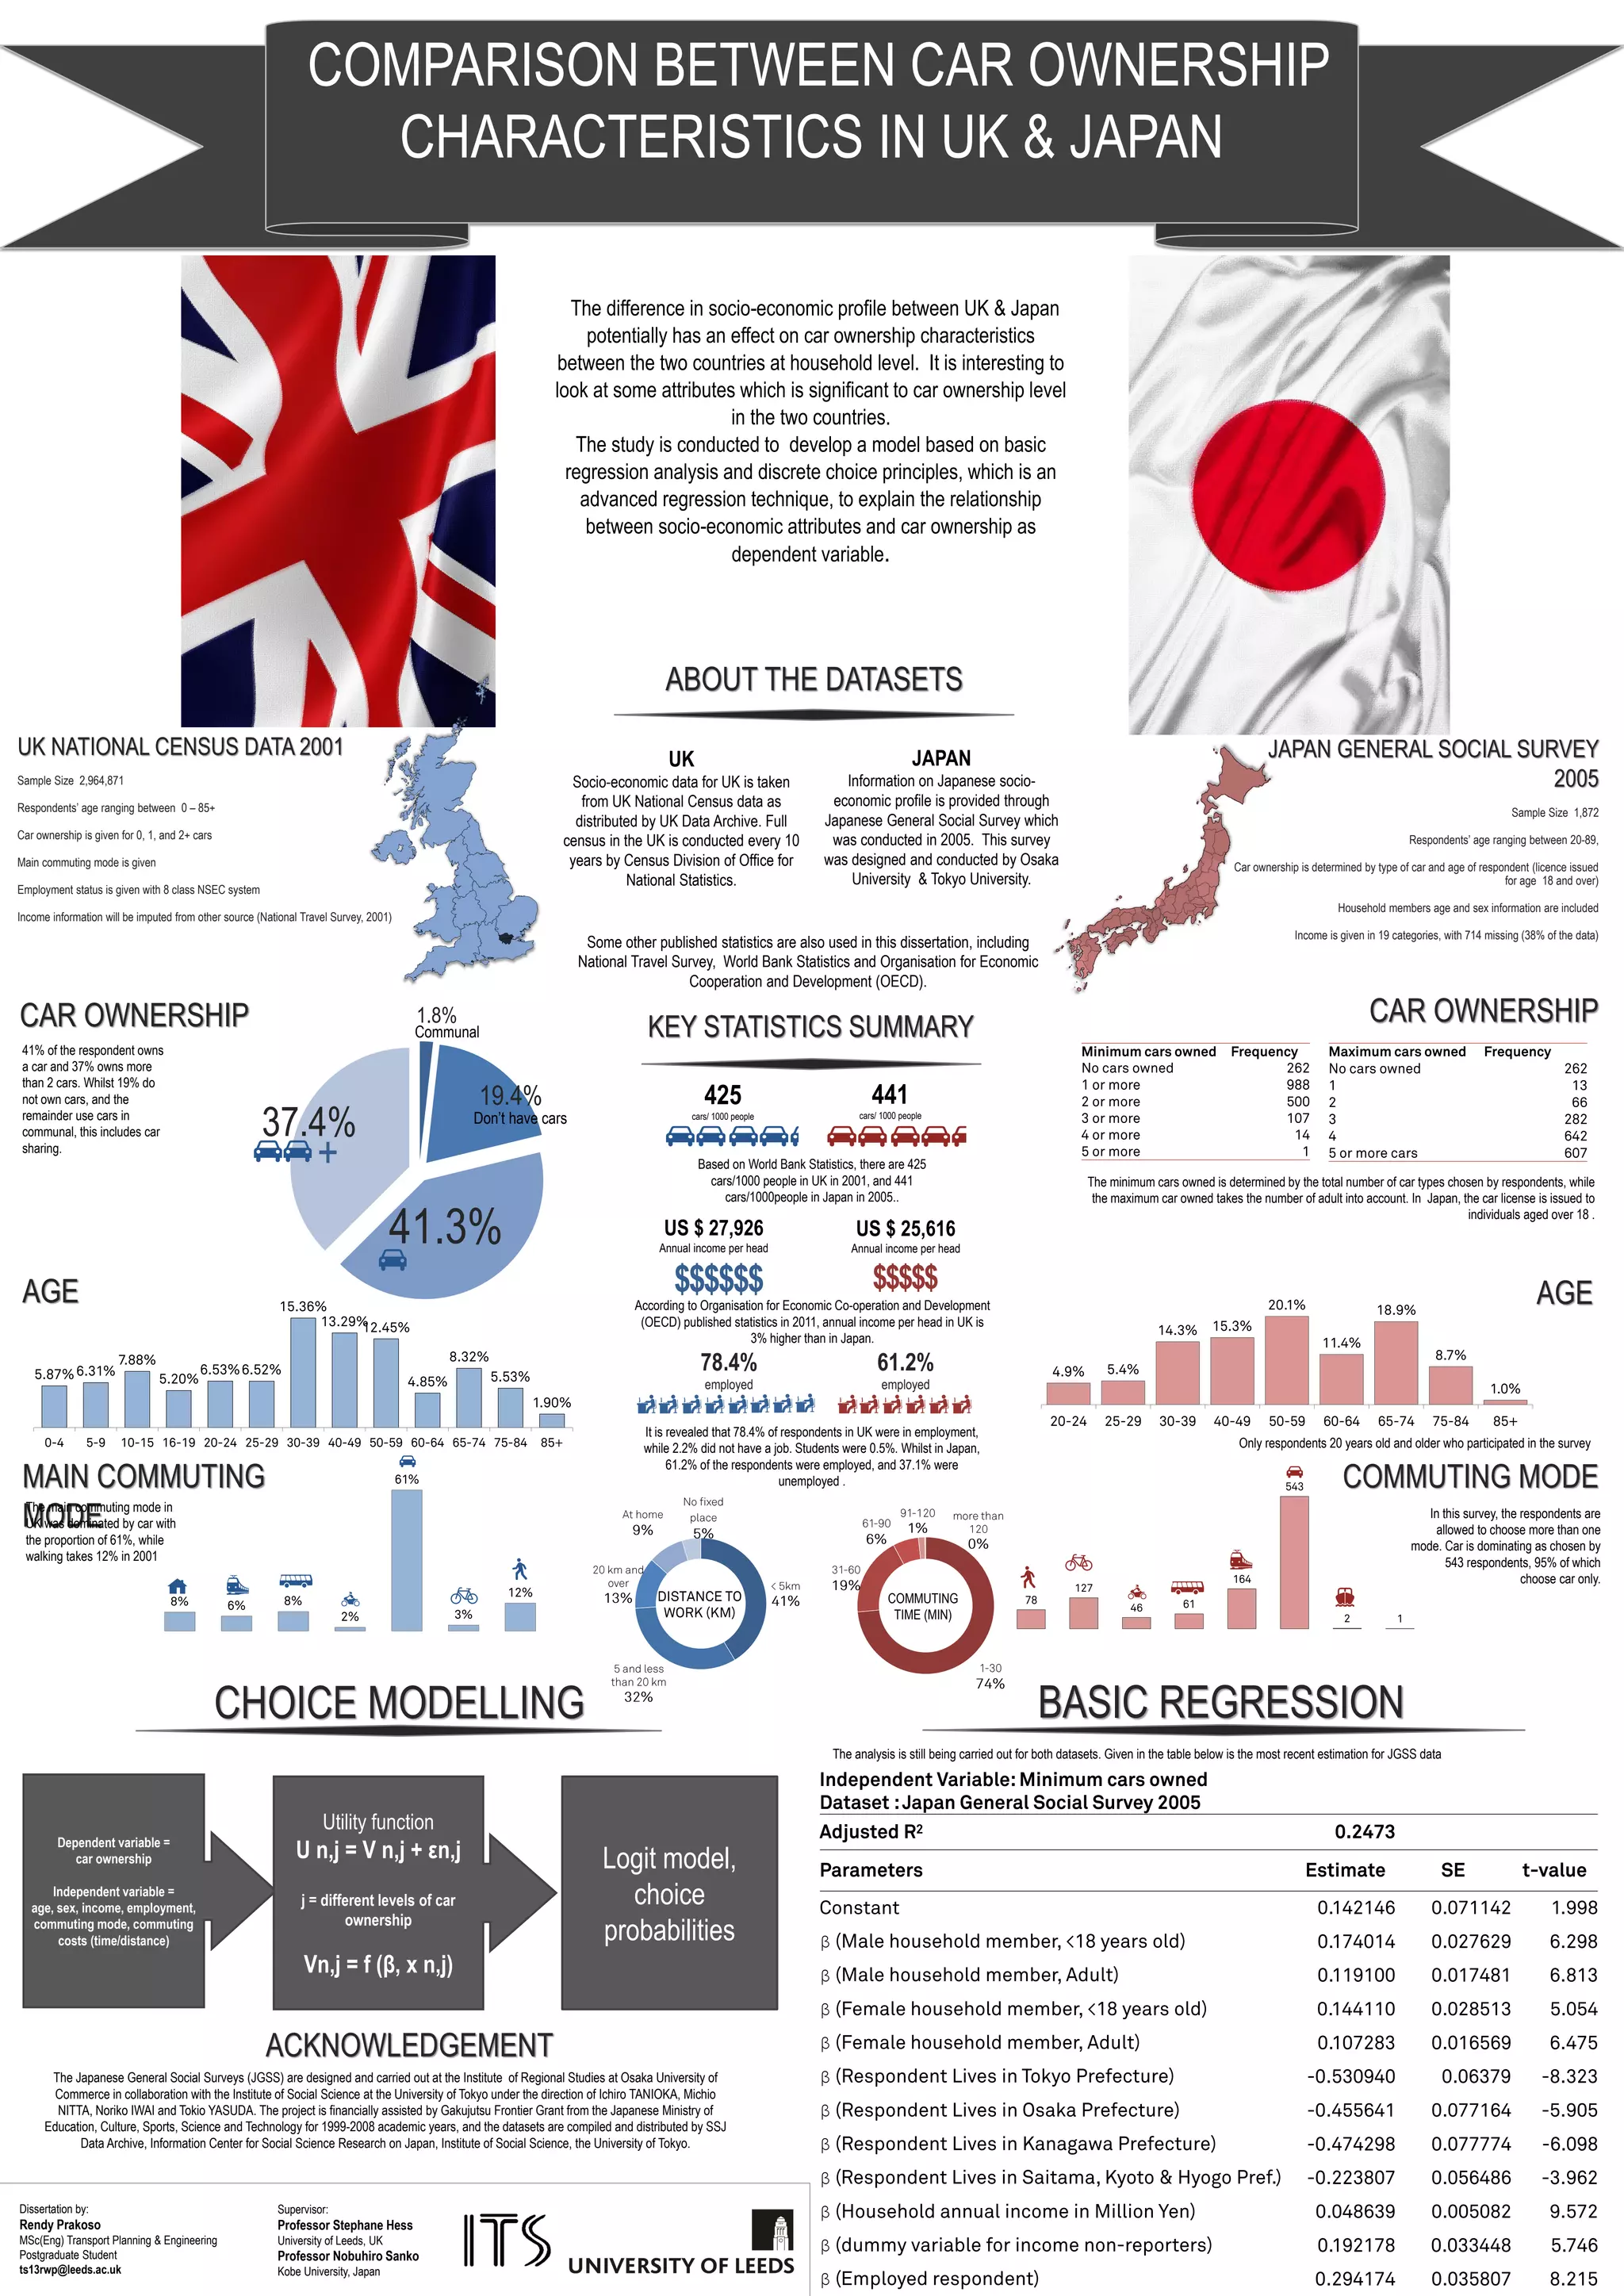
![The Importance of Eco-Driving
In the last decades, engine technology and vehicle performance has improved, while most
drivers have not adapted their driving style.1 Eco-driving represents a driving culture which
suits modern engines and makes best use of advanced vehicle technologies, such as
maintaining a steady speed at low rpm, shifting gear early and rolling in neutral. The benefits
of adopting such behaviour include;
Lower greenhouse gas emissions
It is widely accepted that greenhouse gas emissions contribute to climate change. Eco-driving
can be embraced as a simple and effective environmentally friendly initiative that can lower
vehicle emissions by 20g per kilometre.2
Save cost on fuel
By adopting eco-driving practices, fuel efficiency can be improved by 15% or more lowering
the demand for fuel.3
Source (Fiat, 2010, p. 25)
Eco-driving: who does it and why ?
Identifying the motivational factors
References
1 Eco Drive (2014). What is eco-driving. [Online]. [Accessed 7th April 2014]. Available at: http://www.ecodrive.org/en/what_is_ecodriving-/
2 Fiat. (2010). Eco-driving Uncovered. [Online]. Accessed 7th April 2014]. Available at:
http://www.fiat.co.uk/uploadedFiles/Fiatcouk/Stand_Alone_Sites/EcoDrive2010/ECO-DRIVING_UNCOVERED_full_report_2010_UK.pdf
3 Baltutis, J. (2010). Benefits of Eco-Driving. [Online]. (Accessed 7th April 2014]. Available at:
http://www.unep.org/transport/PDFs/Ecodriving/Ecodriving_pwpt.pdf
4 Mensing, F et al. (2014). Eco-driving: An economic or ecologic driving style? Transportation Research Part C, 38, 110 – 121.
5 Powell, D. (2008). Extreme Driver – with a difference. New Scientist. 200, pp. 42 -43
6 DfT. (2011). Eco-driving: Factors that determine post test take up. [Online]. [Accessed 7th April 2014]. Available at:
https://www.gov.uk/government/uploads/system/uploads/attachment_data/file/142536/Eco_safe_driving.pdf
7 Delhomme, P et al. (2013). Self-reported frequency and perceived difficulty of adopting eco-friendly driving behaviour according to gender, age
and environmental concern. Transportation Research Part D, 20. pp. 55 – 58.
Savings per
car life cycle
Fuel
Consumption
CO 2
Emissions
Savings
Average
Driver
-6% -1,088kg £480
Top 10% -16% -2,895kg £1,260
Literature Review
Motivational factors
- Economic 4
- Environmental concern 4
- Embracing the challenge 5
- Road safety 6
Barriers to adoption
- Perceived difficulty 7
- Lack of awareness 6
- Technological innovation is more interesting 2
- Lack of tuition in driving schools 6
Group most likely to eco-drive
- Middle aged females with a high environmental concern 7
Group least likely to eco-drive
- Young males and females 7
Michael Wilson
Supervisor: Dr Daryl Hibberd
Institute for
Transport Studies
Methodology
Step 1 – Develop an online scenario based questionnaire divided into 4 sections
Section 1 – Personal Characteristics:
Identify the key variables such as age, gender,
income and environmental concern.
Section 2 – Strategic Decision Scenarios
Examine the motivation for the selection of vehicle type,
checking tyre pressure and fuel choice.
Section 3 – Tactical Decision Scenarios
Examine the motivation for route choice
regarding congestion , road terrain and whether
individuals consider removing excess vehicle weight.
Section 4 – Operational Decision Scenarios
Examine the motivation for driver speed, driving
style, air conditioning use and idling.
Example Question
You are given the choice of two routes to the same
destination. Route 1 will take 1 hour and emit 5% more CO2.
Route 2 will take 10 minutes longer, emitting 5% less CO2.
Which do you choose?
Step 2 – Obtain 100+ respondents to achieve a representative sample of the
population. Respondents will be private vehicle users with a valid
driving license.
Step 3 – Analyse results by performing a regression analysis between variables in SPSS to
answer research questions.
Possible Further Research
Examine how eco-driving campaigns can target driver groups through motivational
factors and removal of barriers
Attempt to quantify the environmental impact if eco-driving was implemented as a soft
policy measurement
Undertake a cost-benefit analysis to calculate the NPV to the driver of eco-driving
Aims and Objectives
The aim of this project is to explore the relationship between individual characteristics, eco-
driving behaviours and motivational factors. The following objectives have been set to
answer the overarching question of who eco-drives and why?
Identify motivations behind eco-driving
Identify which drivers are most likely to undertake eco-driving behaviour
Identify whether individuals are conscious of eco-driving
Identify the potential barriers to eco-driving
Hypotheses
The following hypotheses will be tested in order to provide a structure and focus to answer
the project objectives.
The strongest motivation to eco-drive is fuel conservation
Lower income groups are more likely to eco-drive because of economic influence
Individuals who travel a greater distance are more likely to eco-drive because of the
experience they have gained
The greatest barrier is awareness of eco-driving practices](https://image.slidesharecdn.com/allall-140515044924-phpapp01/75/Masters-Dissertation-Posters-2014-57-2048.jpg)


This document presents various studies focused on transport demand and vulnerability, including the development of a transferable car travel demand model using data from Nairobi and Dar-es-Salaam, methodologies for improving flood-risk transport networks in the UK, and an analysis of passengers' willingness to access regional airports. Each study aims to enhance understanding of transport behaviors, model transferability, and emergency planning in the face of pressing environmental and infrastructural challenges. The findings emphasize the importance of adaptable models and strategic cooperation among transport facilities to improve accessibility and emergency response.
Examines the development of a car travel demand model in Nairobi and Dar-es-Salaam, focusing on household car ownership, trip generation, and modeling performance.
Evaluates transport network flood-risk vulnerability; aims to identify weaknesses in flood-prone areas and improve emergency strategies.
Investigates factors influencing departure airport choice related to surface transport access for passengers traveling between Manchester and Leeds.
Analyzes reflective cracking in asphalt pavements, exploring causes and solutions to improve durability and maintenance strategies.
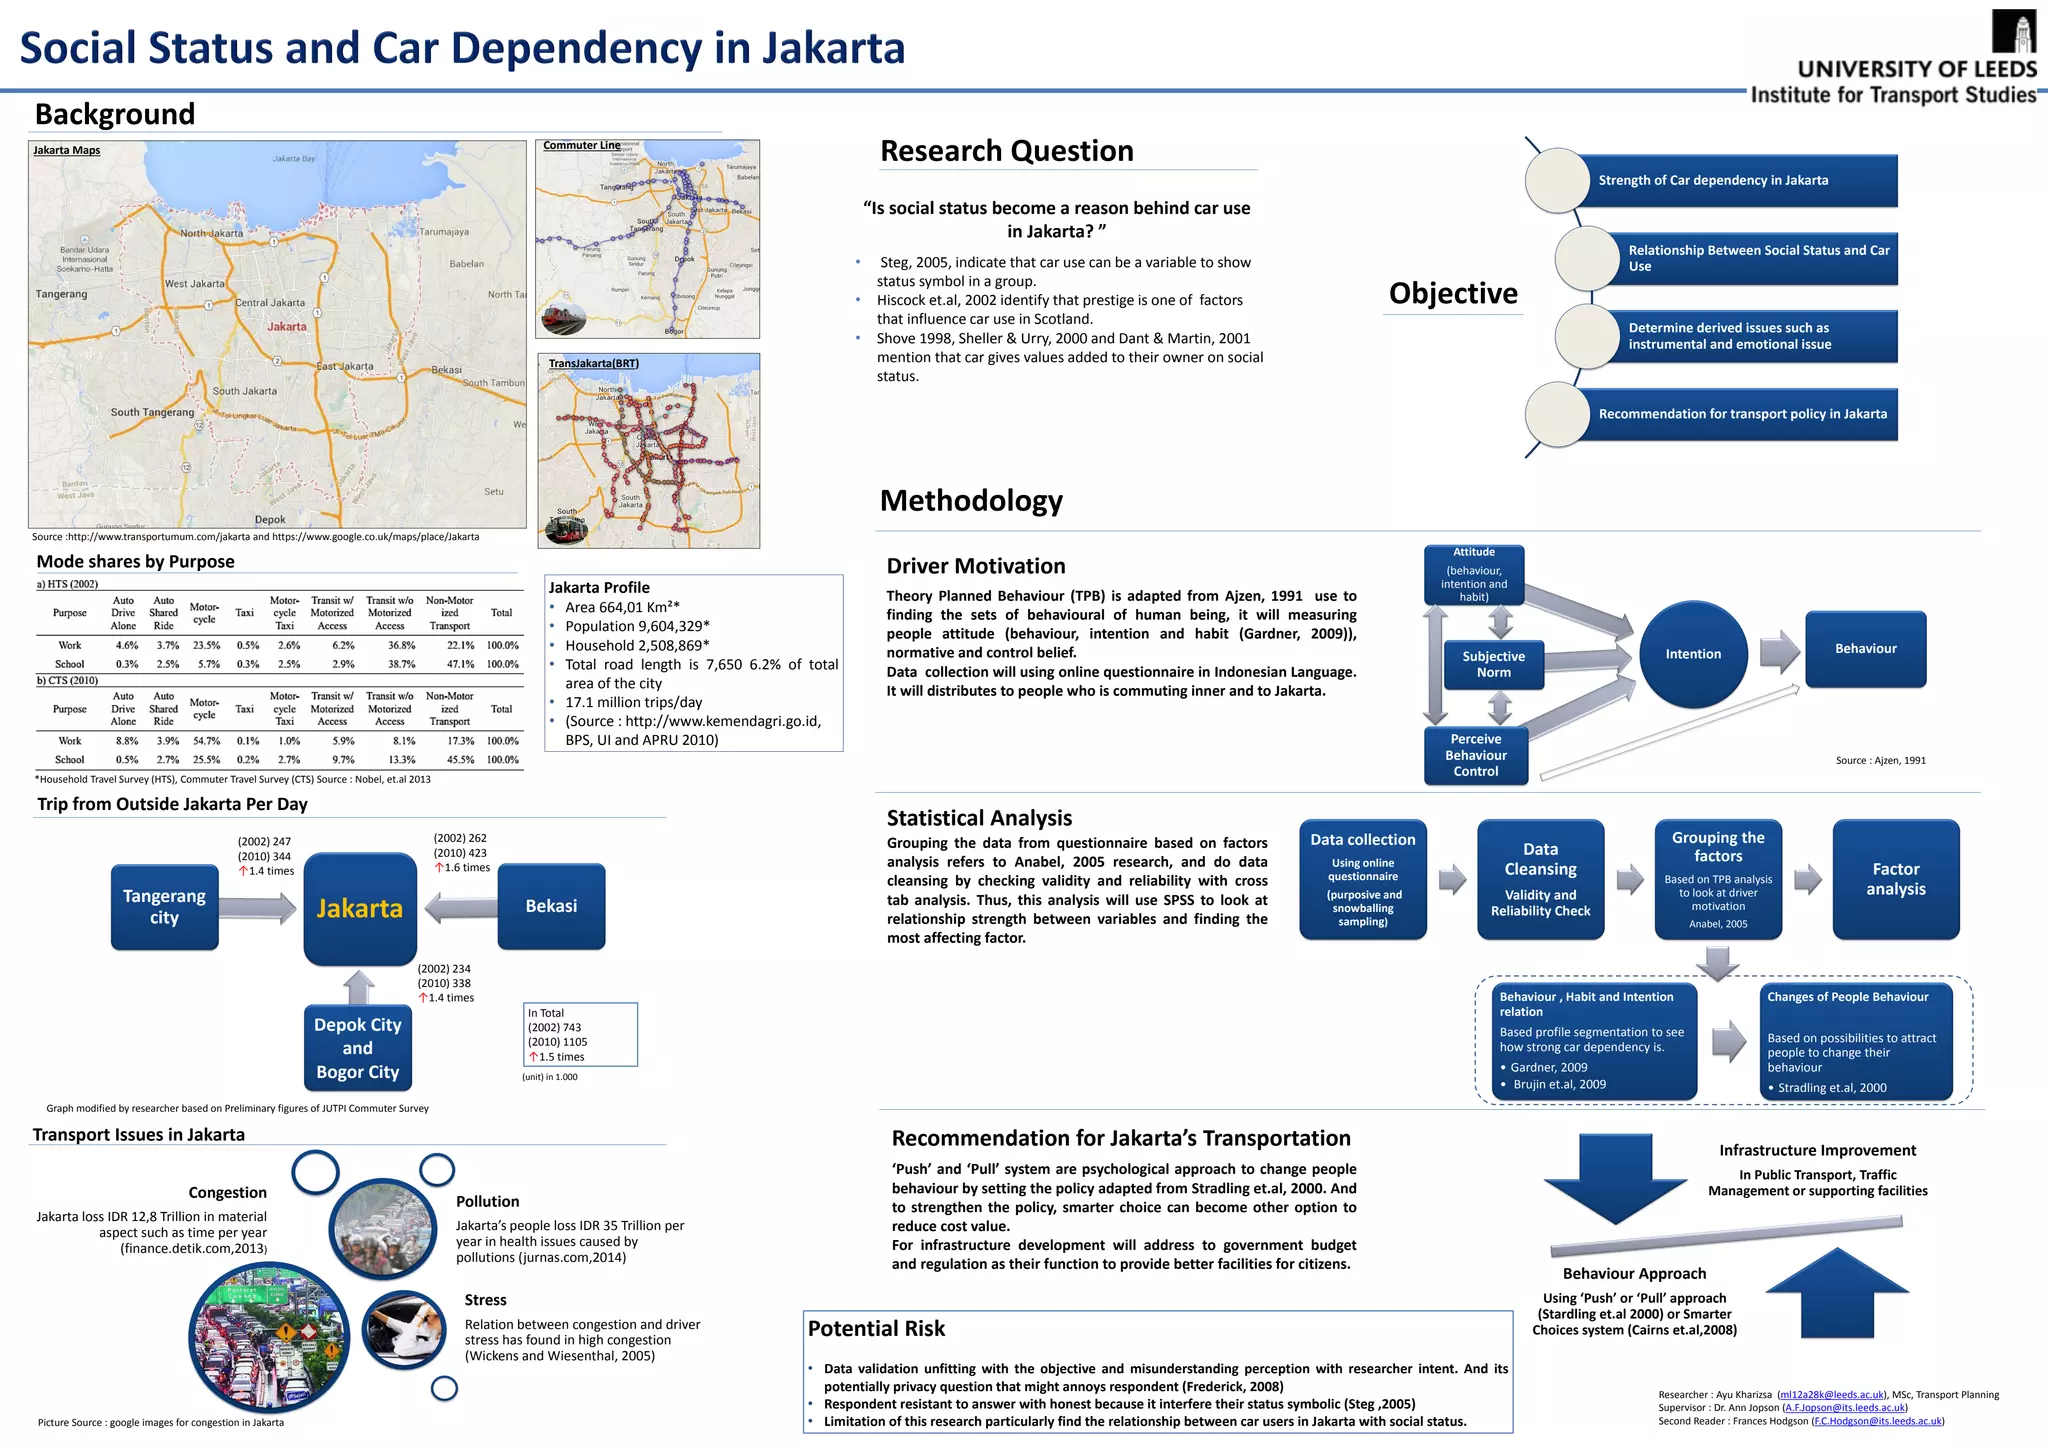
Examines transport challenges in Jakarta, including congestion impacts, socio-economic factors, and recommendations for transport policy improvements.
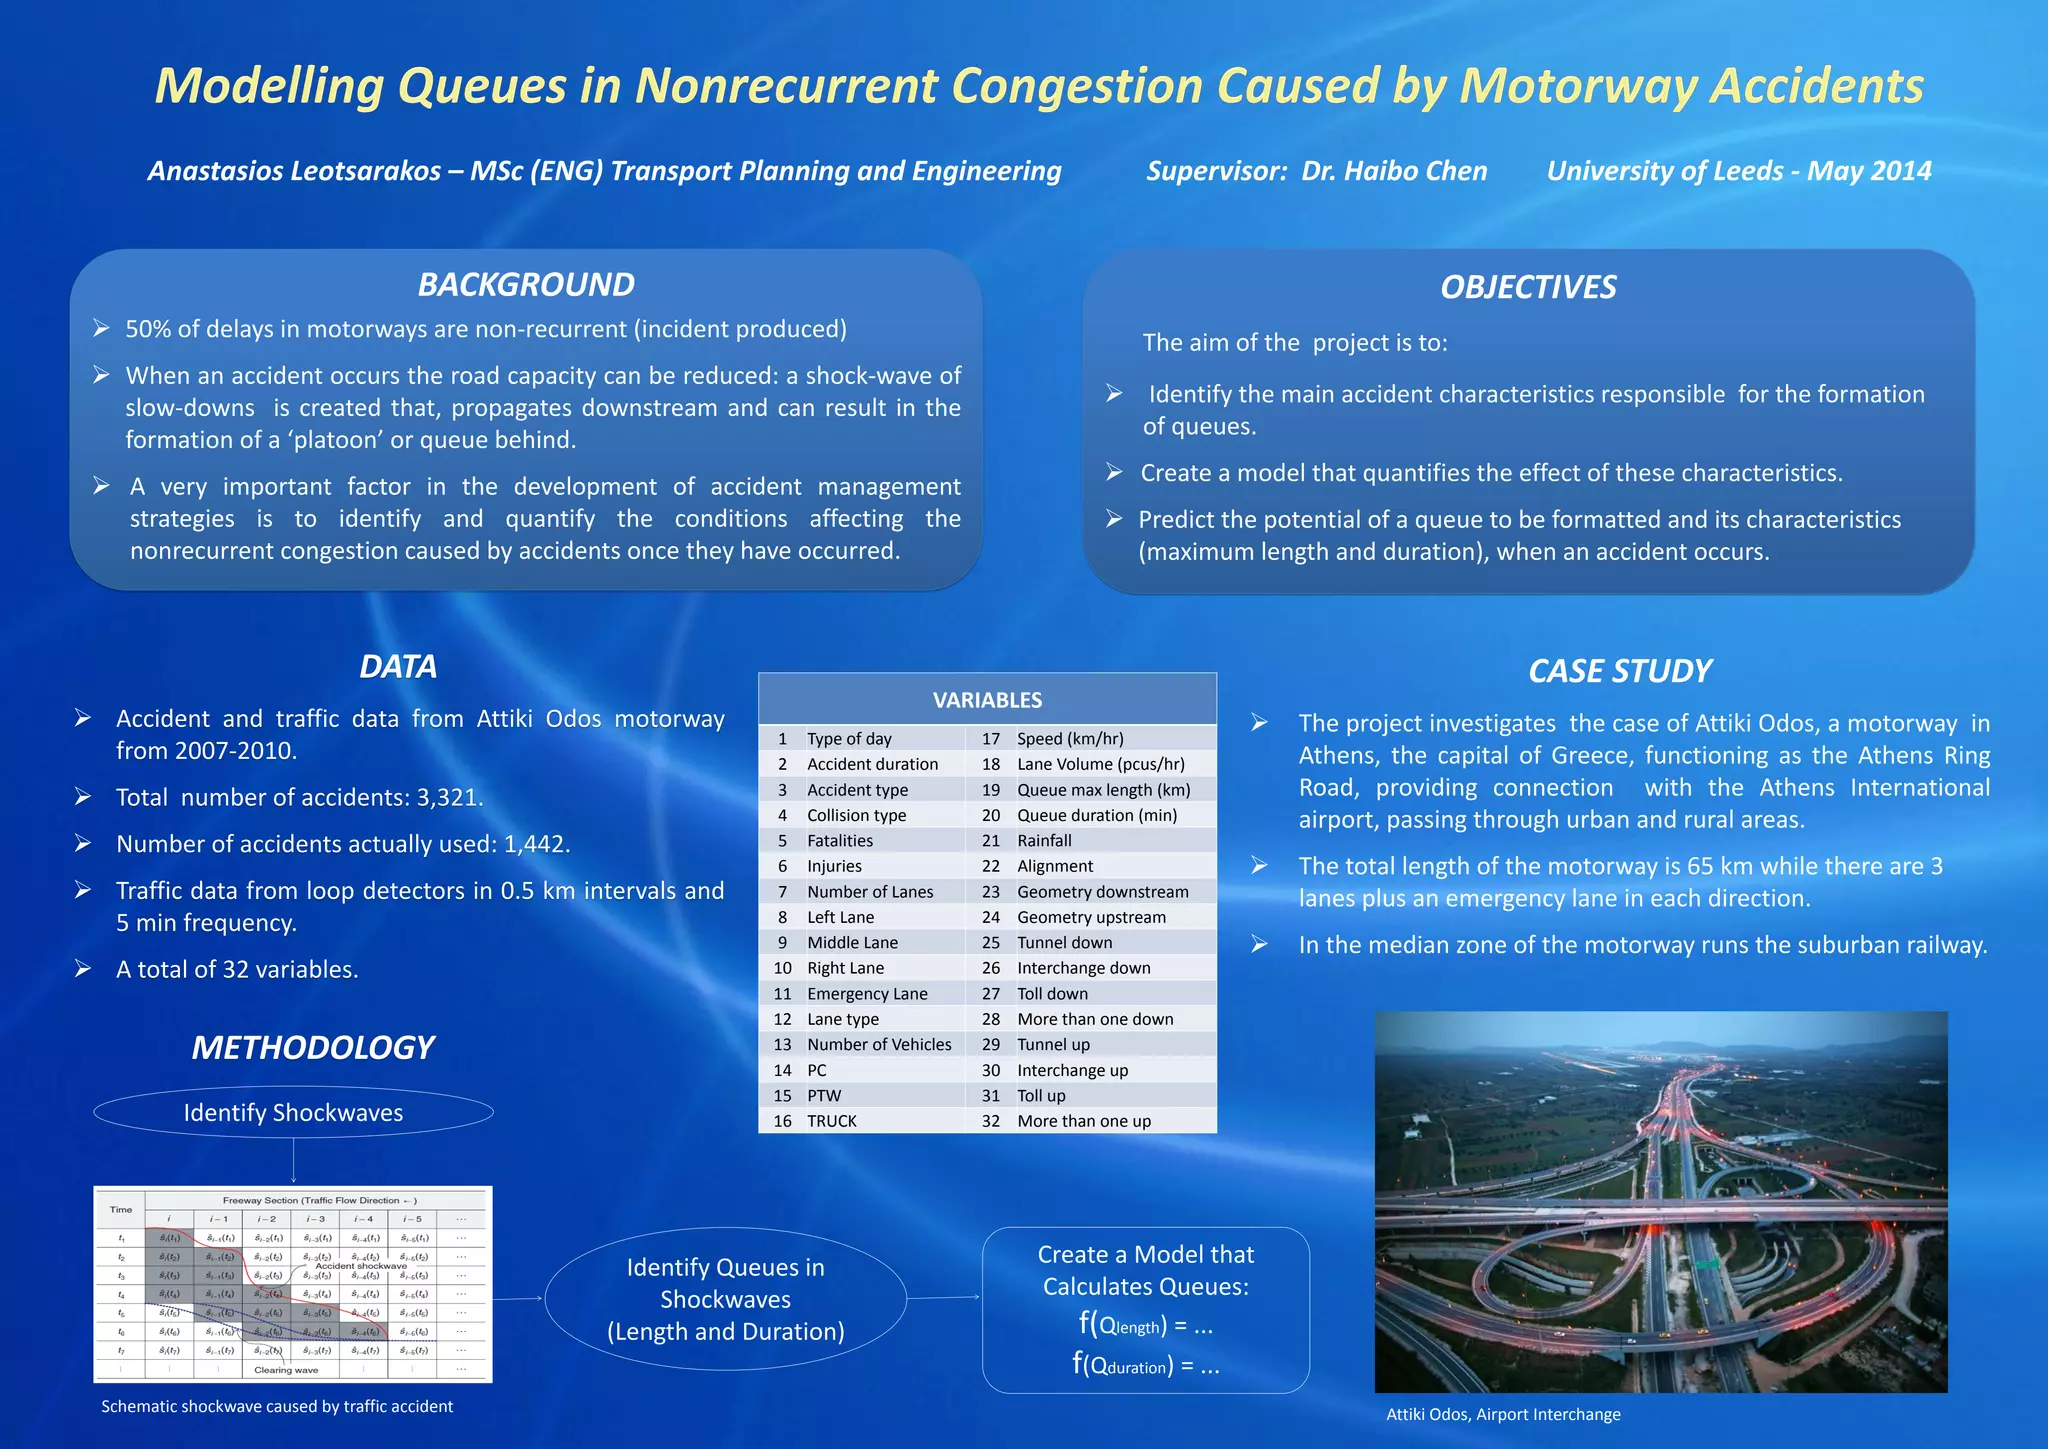
Describes accident characteristics on the Attiki Odos motorway in Greece and aims to model queue dynamics and predict congestion.
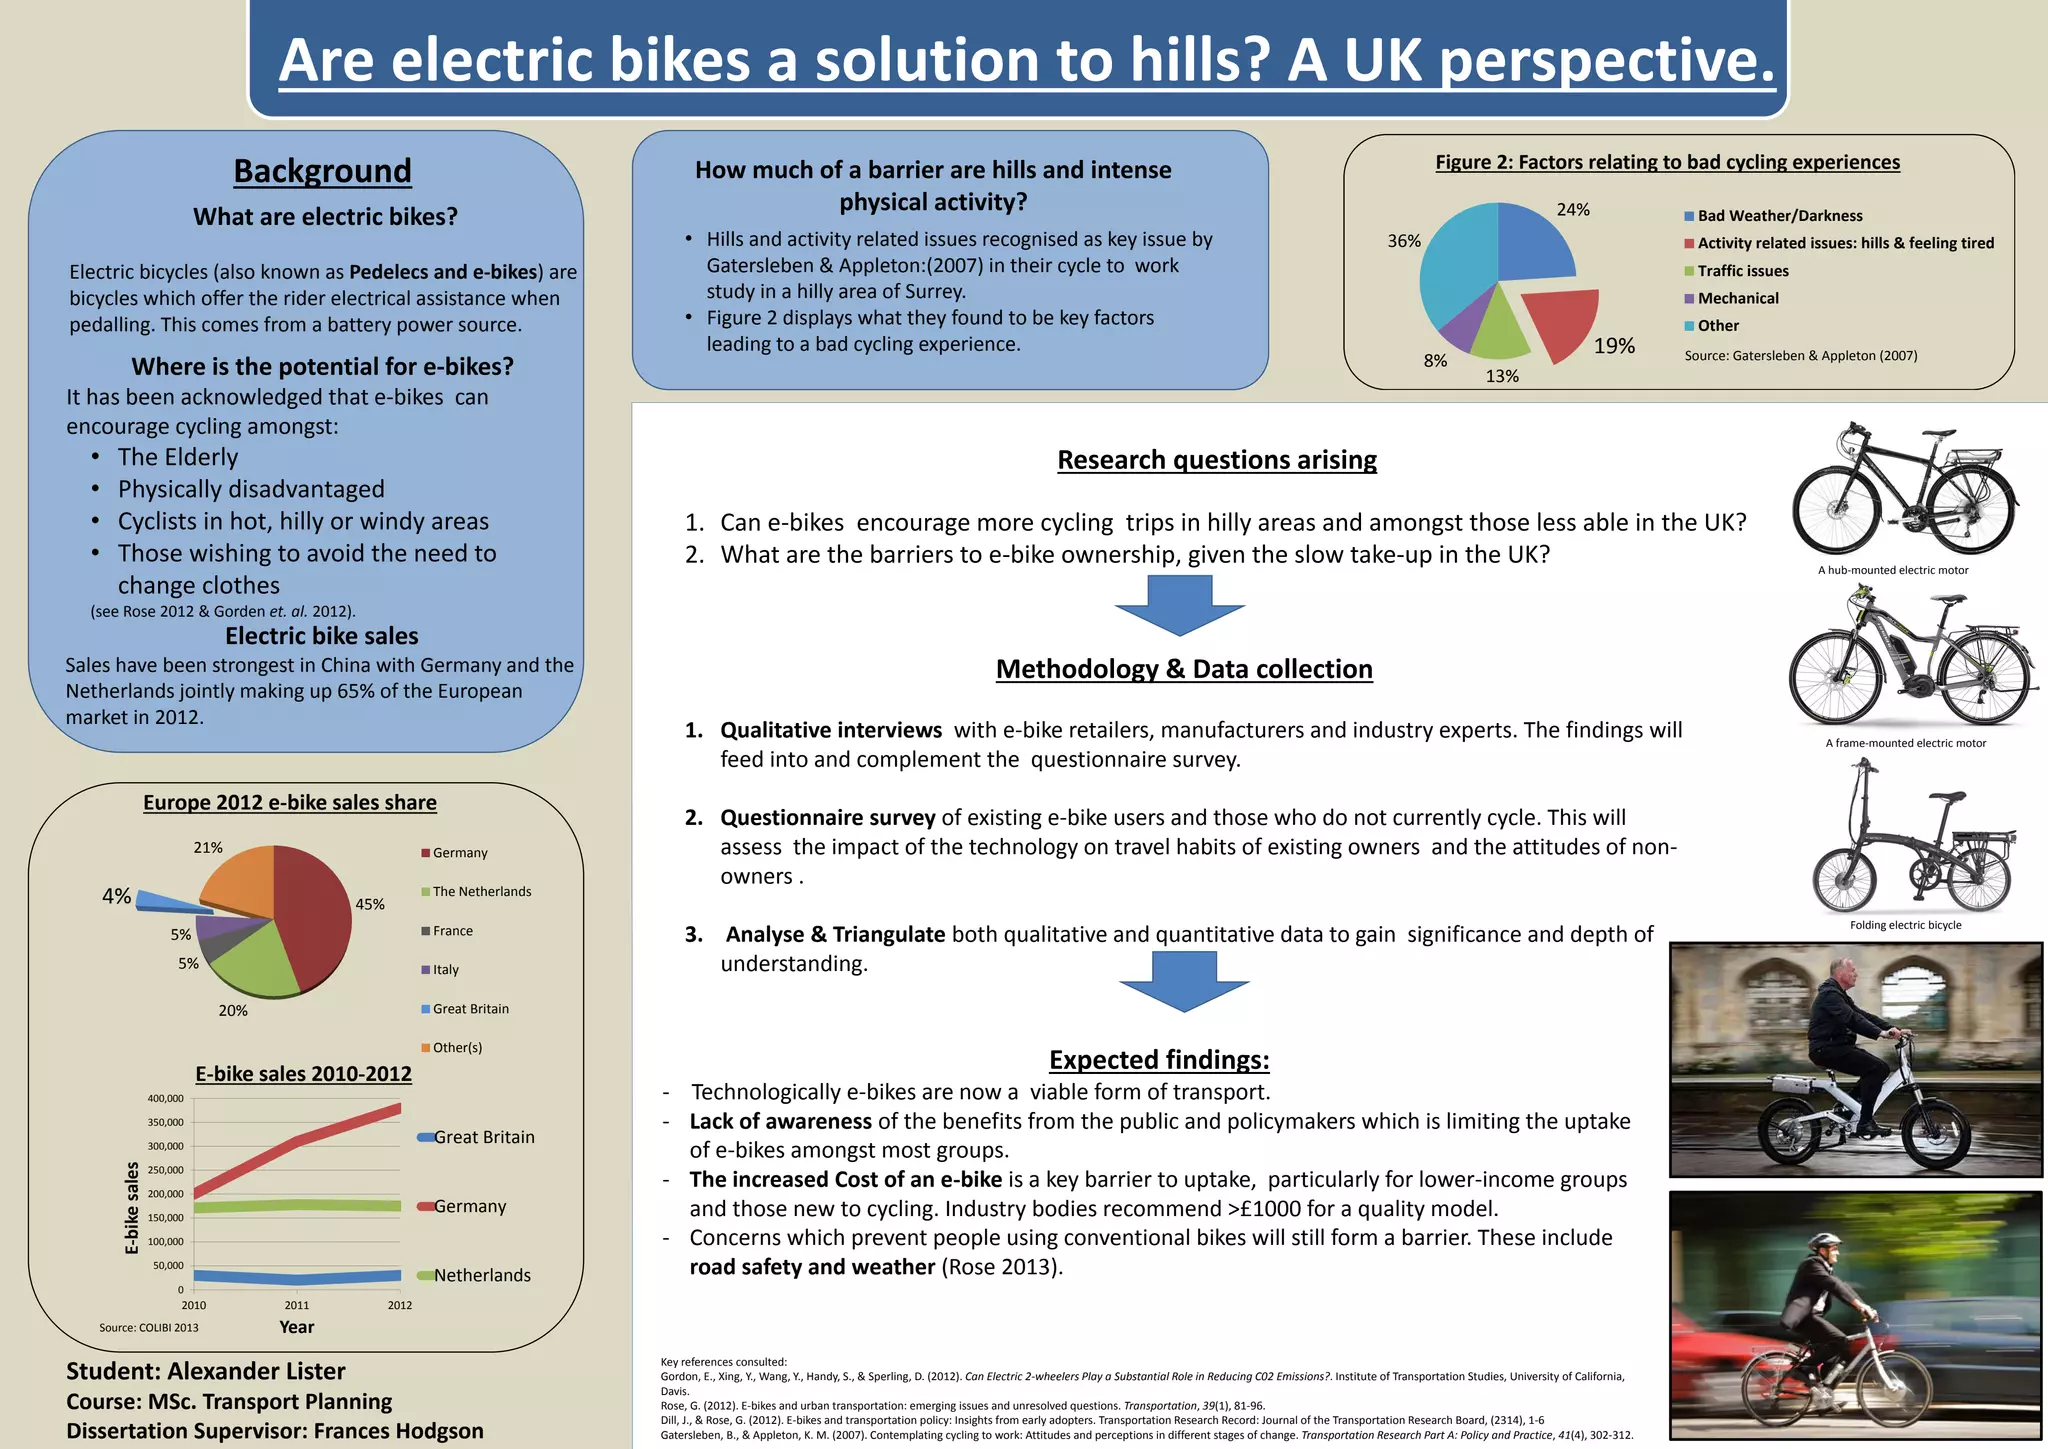
Explores barriers to e-bike adoption among cyclists, emphasizing the need for awareness and policy support to boost cycling uptake.
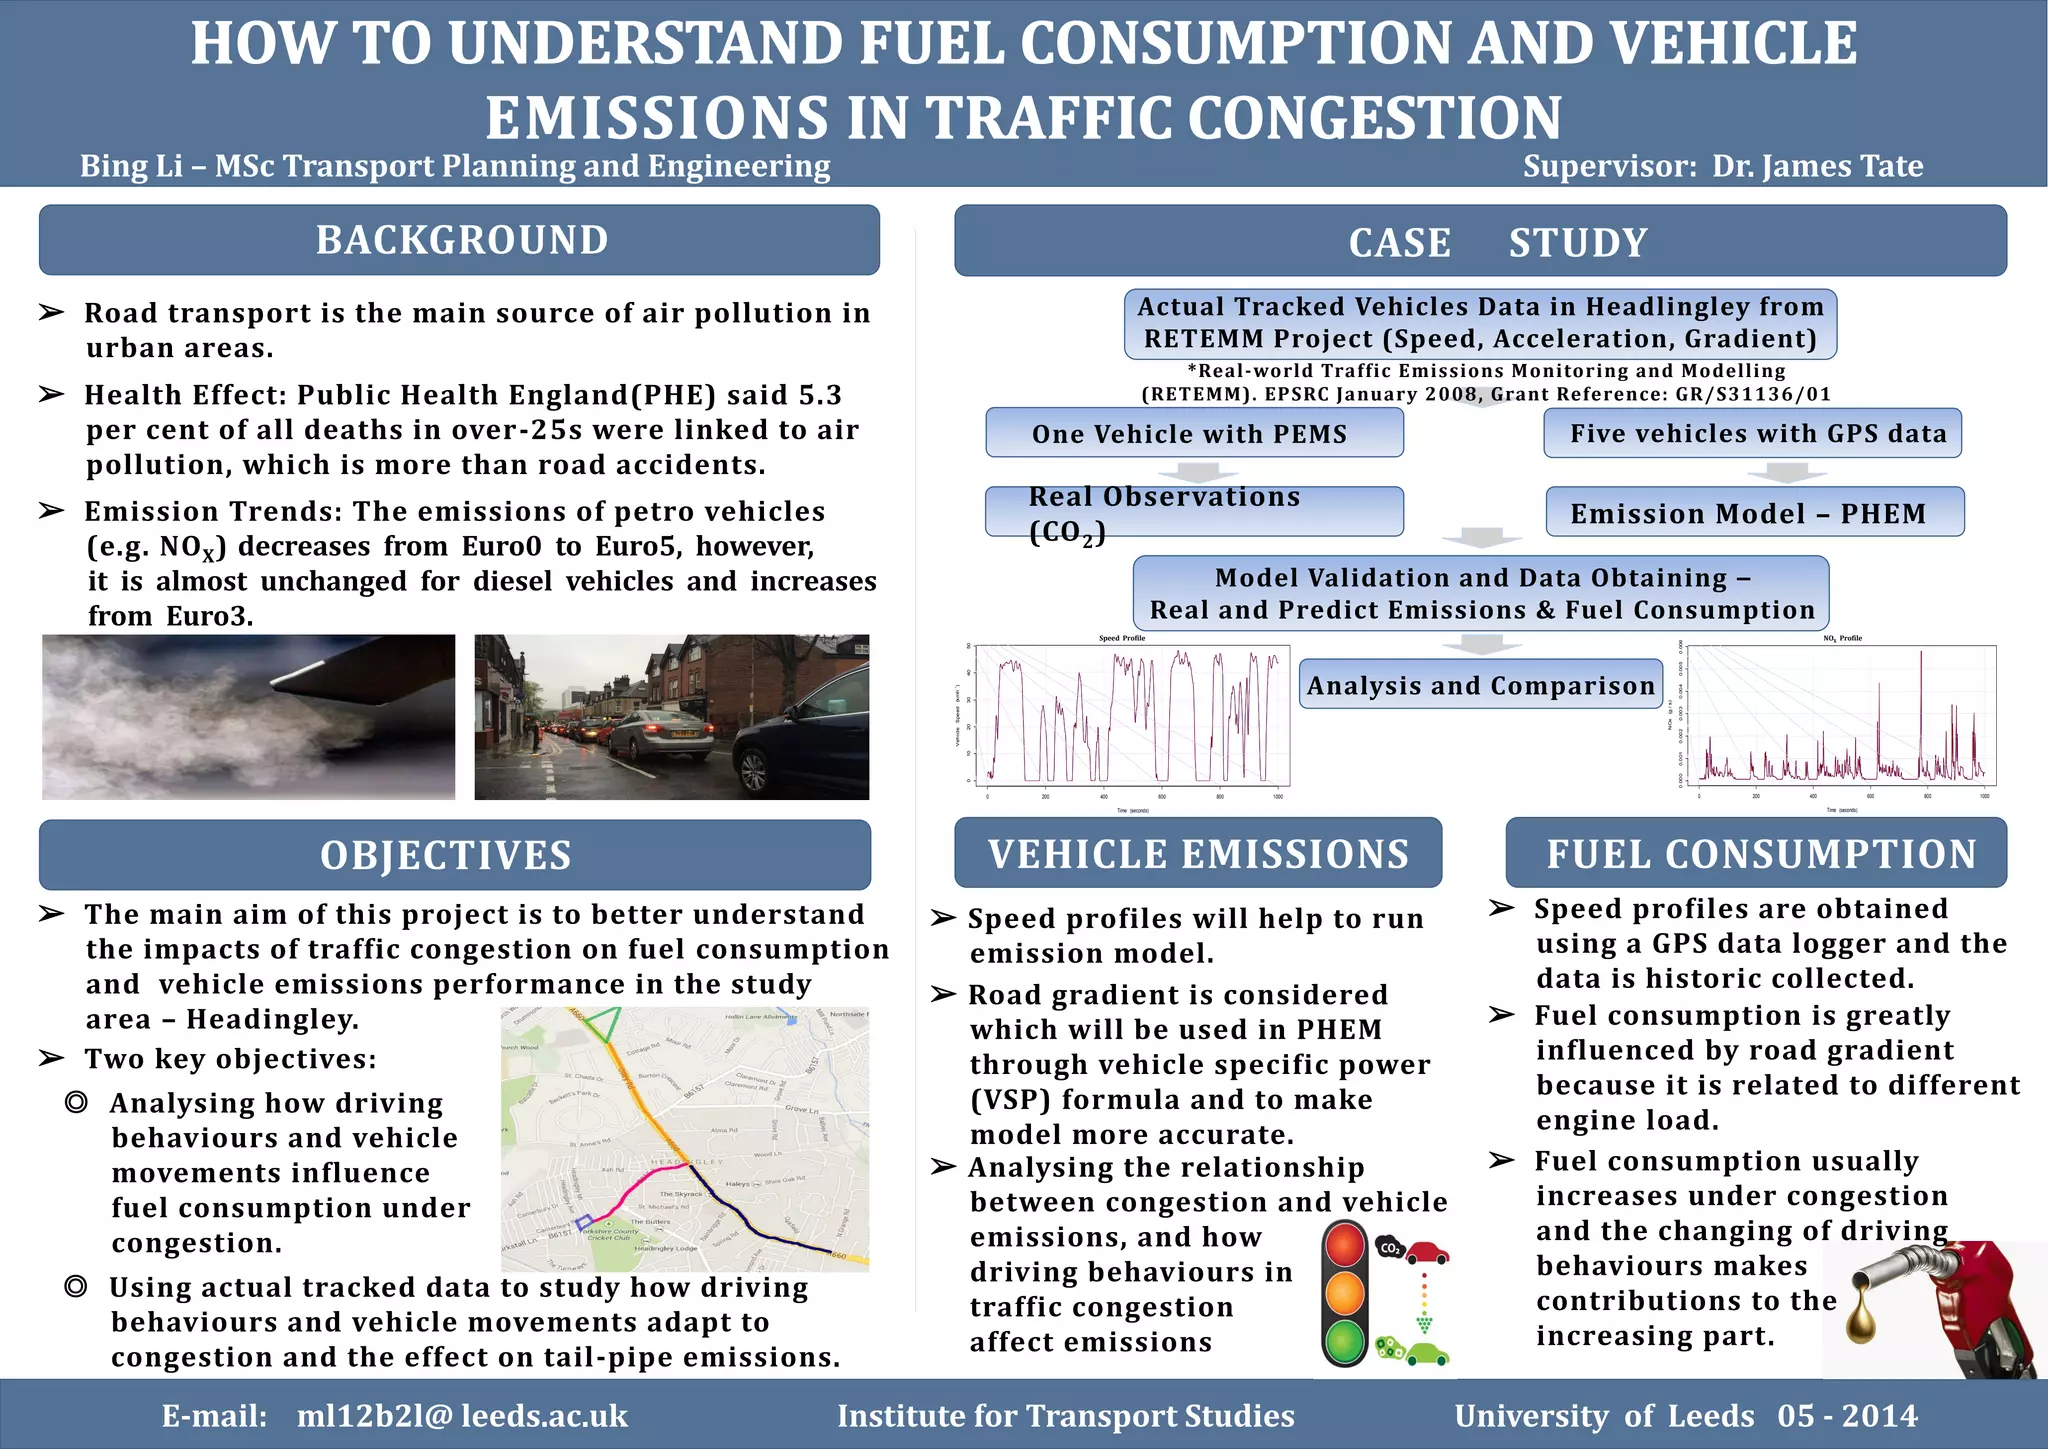
Investigates traffic congestion's impact on fuel consumption and emissions in Headingley, focusing on real-world vehicle data analysis.
Analyzes factors influencing the UK’s CO2 reduction focus in transport, assessing implications for policy and climate change.
Explores the integration of mobile phone and demographic data to improve trip generation model reliability in transport planning.
Investigates the implications of concessionary travel scheme in the UK, assessing changes in bus service dynamics and user impacts.
Analyzes transportation challenges in Landlocked Developing Countries, focusing on freight transport efficiency in Uganda.
Examines factors contributing to car dependency in Leeds, discussing infrastructure, cultural attitudes, and potential policy changes.
Discusses the state of road maintenance in Britain, highlighting investment needs and public satisfaction metrics for funding decisions.
Evaluates the impact of active and public transport facilities on commuter behavior concerning car use, focusing on workplace design.
Investigates emissions from road transport in Ghana, assessing air quality and health implications for communities near busy routes.
Explores how improvements along Leeds' canal towpath can encourage cycling, assessing safety perceptions and user behavior.
Analyzes the role and risks of private financing in airport expansions, with a case study on Manchester Airport’s growth plans.
Examines how social media influences organization of protests affecting transport networks, exploring implications for urban mobility.
Discusses NMT Master Plan benefits within Ghana, focusing on infrastructure, congestion, and challenges in Accra and Tema.
Analyzes economic impacts of enforcing axle load control on transit trade and road investments along West Africa Highway.
Examines determinants of transport mode choice for shopping trips in Great Britain, looking into accessibility and policy implications.
Investigates elasticity variations in passenger rail demand in the UK, focusing on fare price sensitivity and demand drivers.
Explores income's impact on welfare measures in transport investment appraisal using discrete choice models.
Assesses accessibility levels and their influence on customer satisfaction for transport plans in Merseyside.
Investigates the impact of eco-driving behaviors on emissions and fuel savings, assessing motivations and barriers.
Examines how stated preference survey designs impact valuation of soft factors in transport demand modeling.
Compares car ownership characteristics between UK and Japan, focusing on socio-economic influences on household decisions.
Analyzes the relationship between transport infrastructure investment and its effects on economic growth and employment.
Assesses the impact of ghost island provisions on capacity and safety at priority T-junctions in local road networks.
Analyzes factors influencing changes in bus occupancy rates in Greater Manchester post deregulation and policy impacts.
Studies factors promoting electric bike use among older adults in Taiwan, evaluating attitudes and potential barriers.
Investigates how the design of ghost islands at T-junctions affects road safety and capacity, using predictive modeling.
Explores the elasticities of travel time in transportation demand forecasts within the UK and Denmark.
Develops calibration processes for traffic micro-simulation models to ensure realistic vehicle dynamics and emission estimates.
Assesses the impact of eco-driving on emissions reduction, exploring motivational factors for drivers.
Examines influence of stated preference design on valuation of soft transport factors across different passenger demographics.
Analyzes characteristics affecting car ownership in the UK and Japan, exploring socio-economic differences.
Investigates bidirectional relationships between transport investment, economic growth, and productivity implications.
Evaluates potential capacity increases from implementing moving block signalling in railways amid rising demand.
Compares travel time value across different choice models and their implications for transport policy and investment.
Studies vehicle dynamics in transport micro-simulations to optimize traffic behavior and environmental impact forecasting.
Explores the eco-driving phenomenon, focusing on its economic and environmental benefits, and barriers to adoption.
Analyzes how advanced ticket purchase impacts yield management and revenue maximization in the rail market.
Investigates the potential implications of increasing speed limits on UK motorways, addressing safety and efficiency.
Explores the benefits and challenges of electric bike use in hilly terrains, comparing UK and China experiences.
Investigates the effects of painted cycle lanes on usage and safety, assessing road user behavior in Leeds.
Examines the environmental, social, and economic implications of biofuels supply chains in Taiwan.
Evaluates the correlation between accessibility and customer satisfaction for transport plans in West Yorkshire.
Analyzes the impact of gamification on encouraging greener transport choices among commuters.
Develops a stochastic optimization method for traffic signal networks, improving performance under variable conditions.
Investigates capacity gains from moving block signalling in rail systems under increasing traffic demands.
Analyzes the variability of travel time values across different choice models for transport demand.
Focuses on calibrating microsimulation vehicle dynamics to align simulation outputs with real-world data.
Explores challenges to adopting electric bikes among seniors, aiming to enhance mobility and accessibility.
Examines how parking management policies influence travel behaviors and modal choice dynamics.
Investigates transport infrastructure investments in Uganda and their economic impacts on growth and employment.
Evaluates the efficacy of ghost islands at junctions in local road networks for improving vehicle flow and safety.


