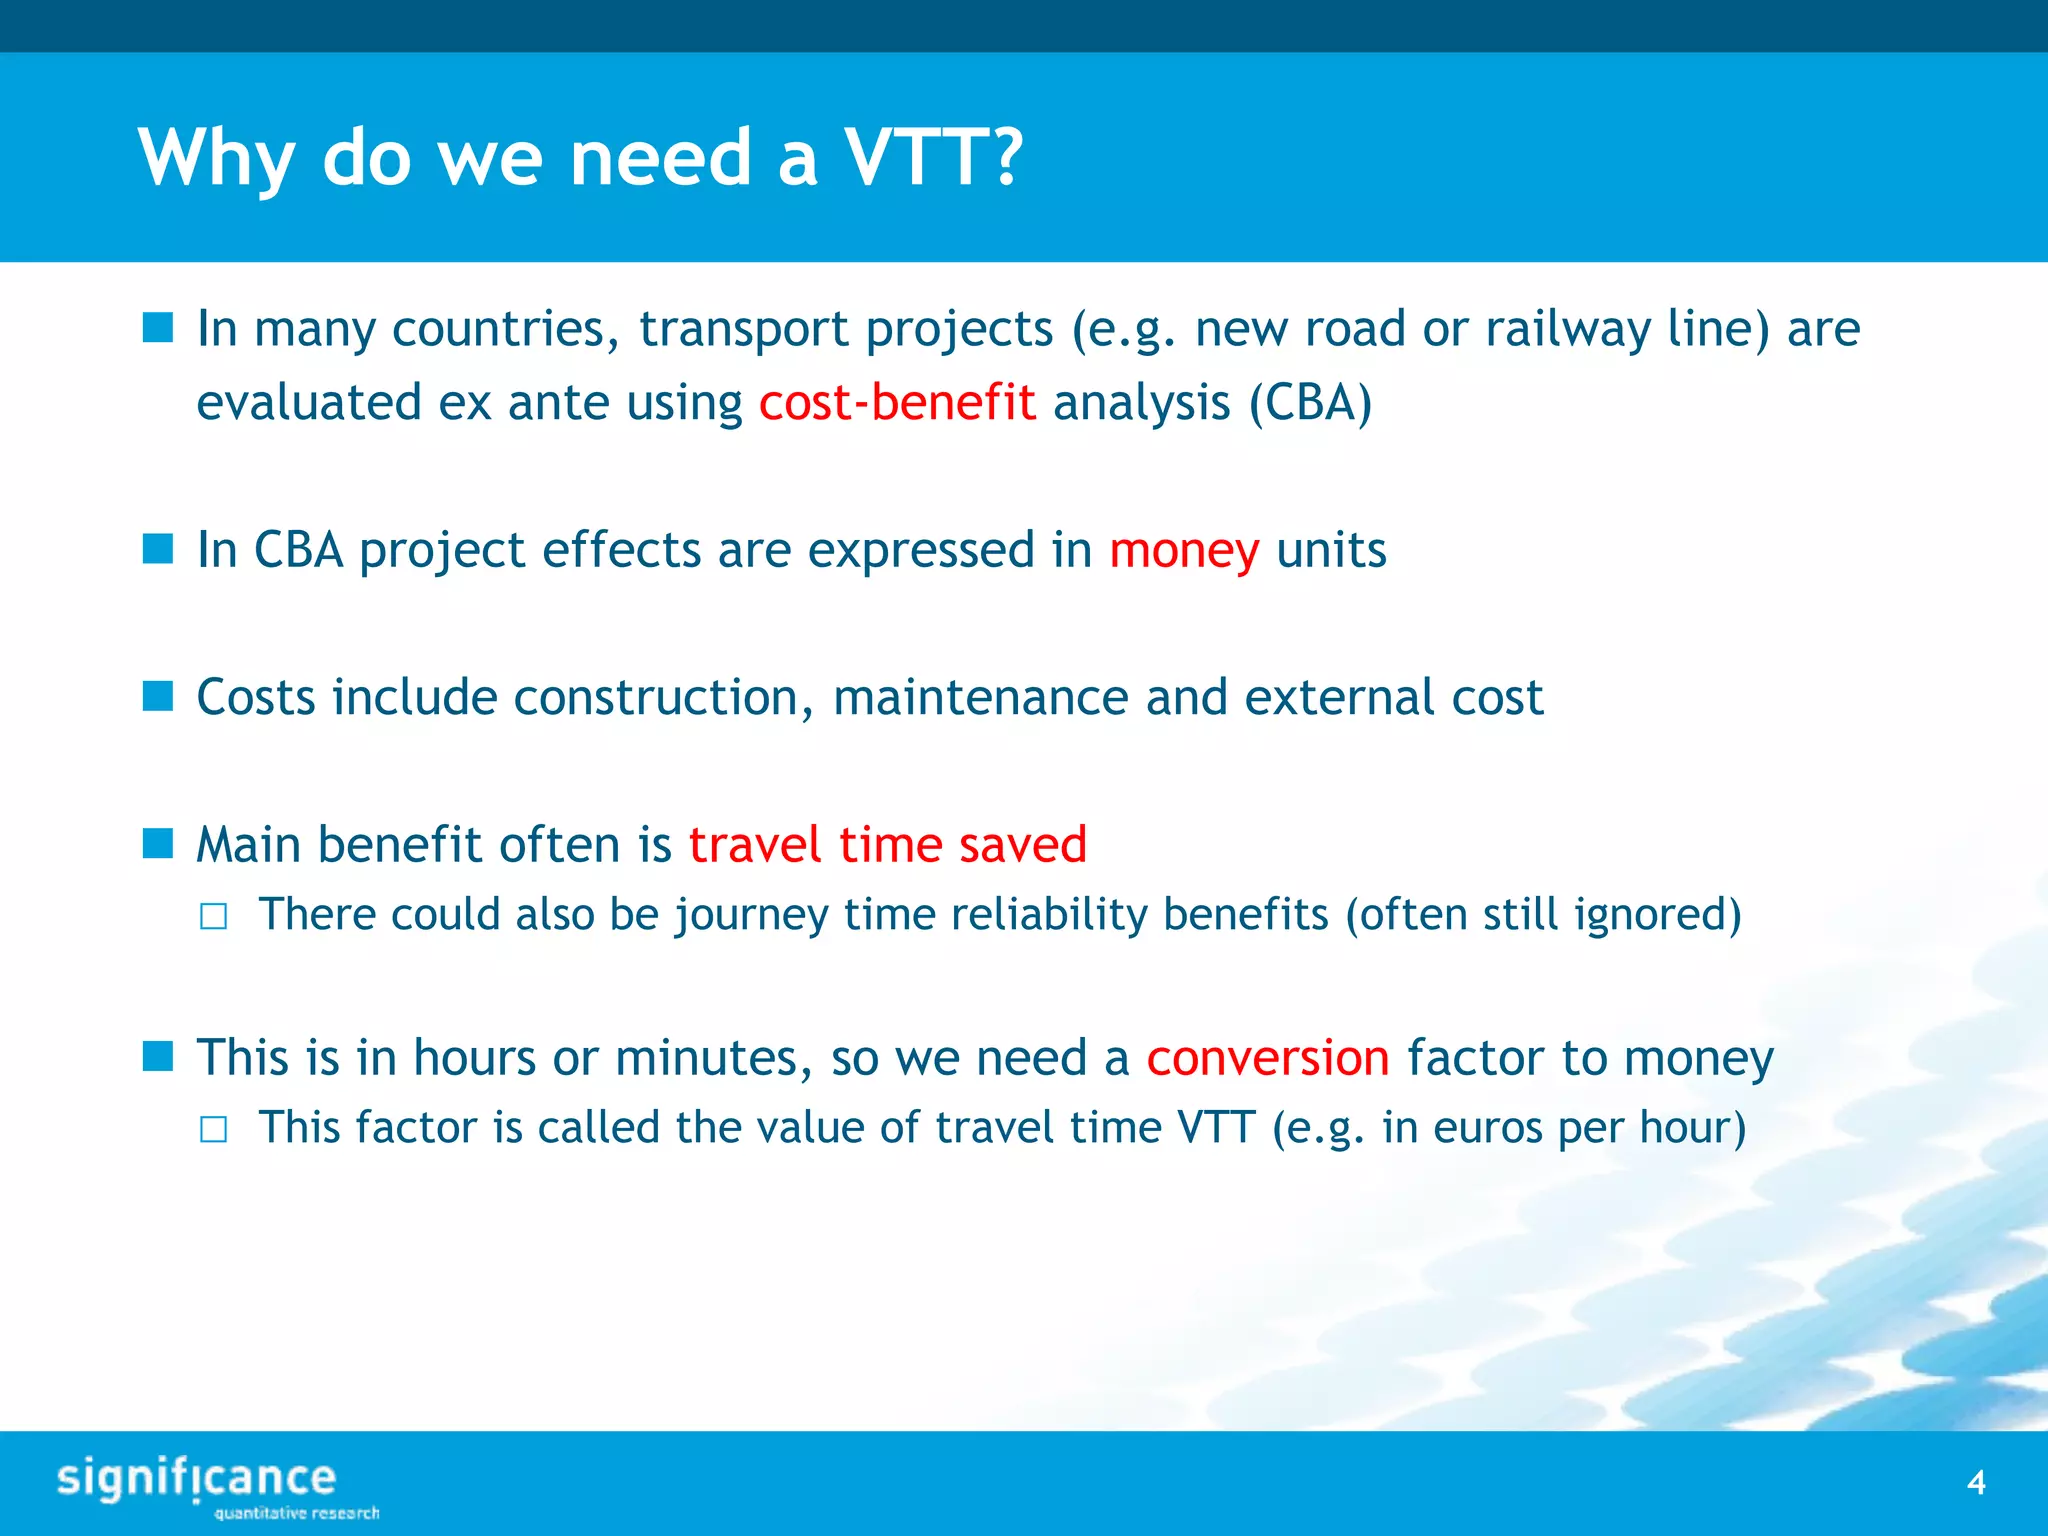
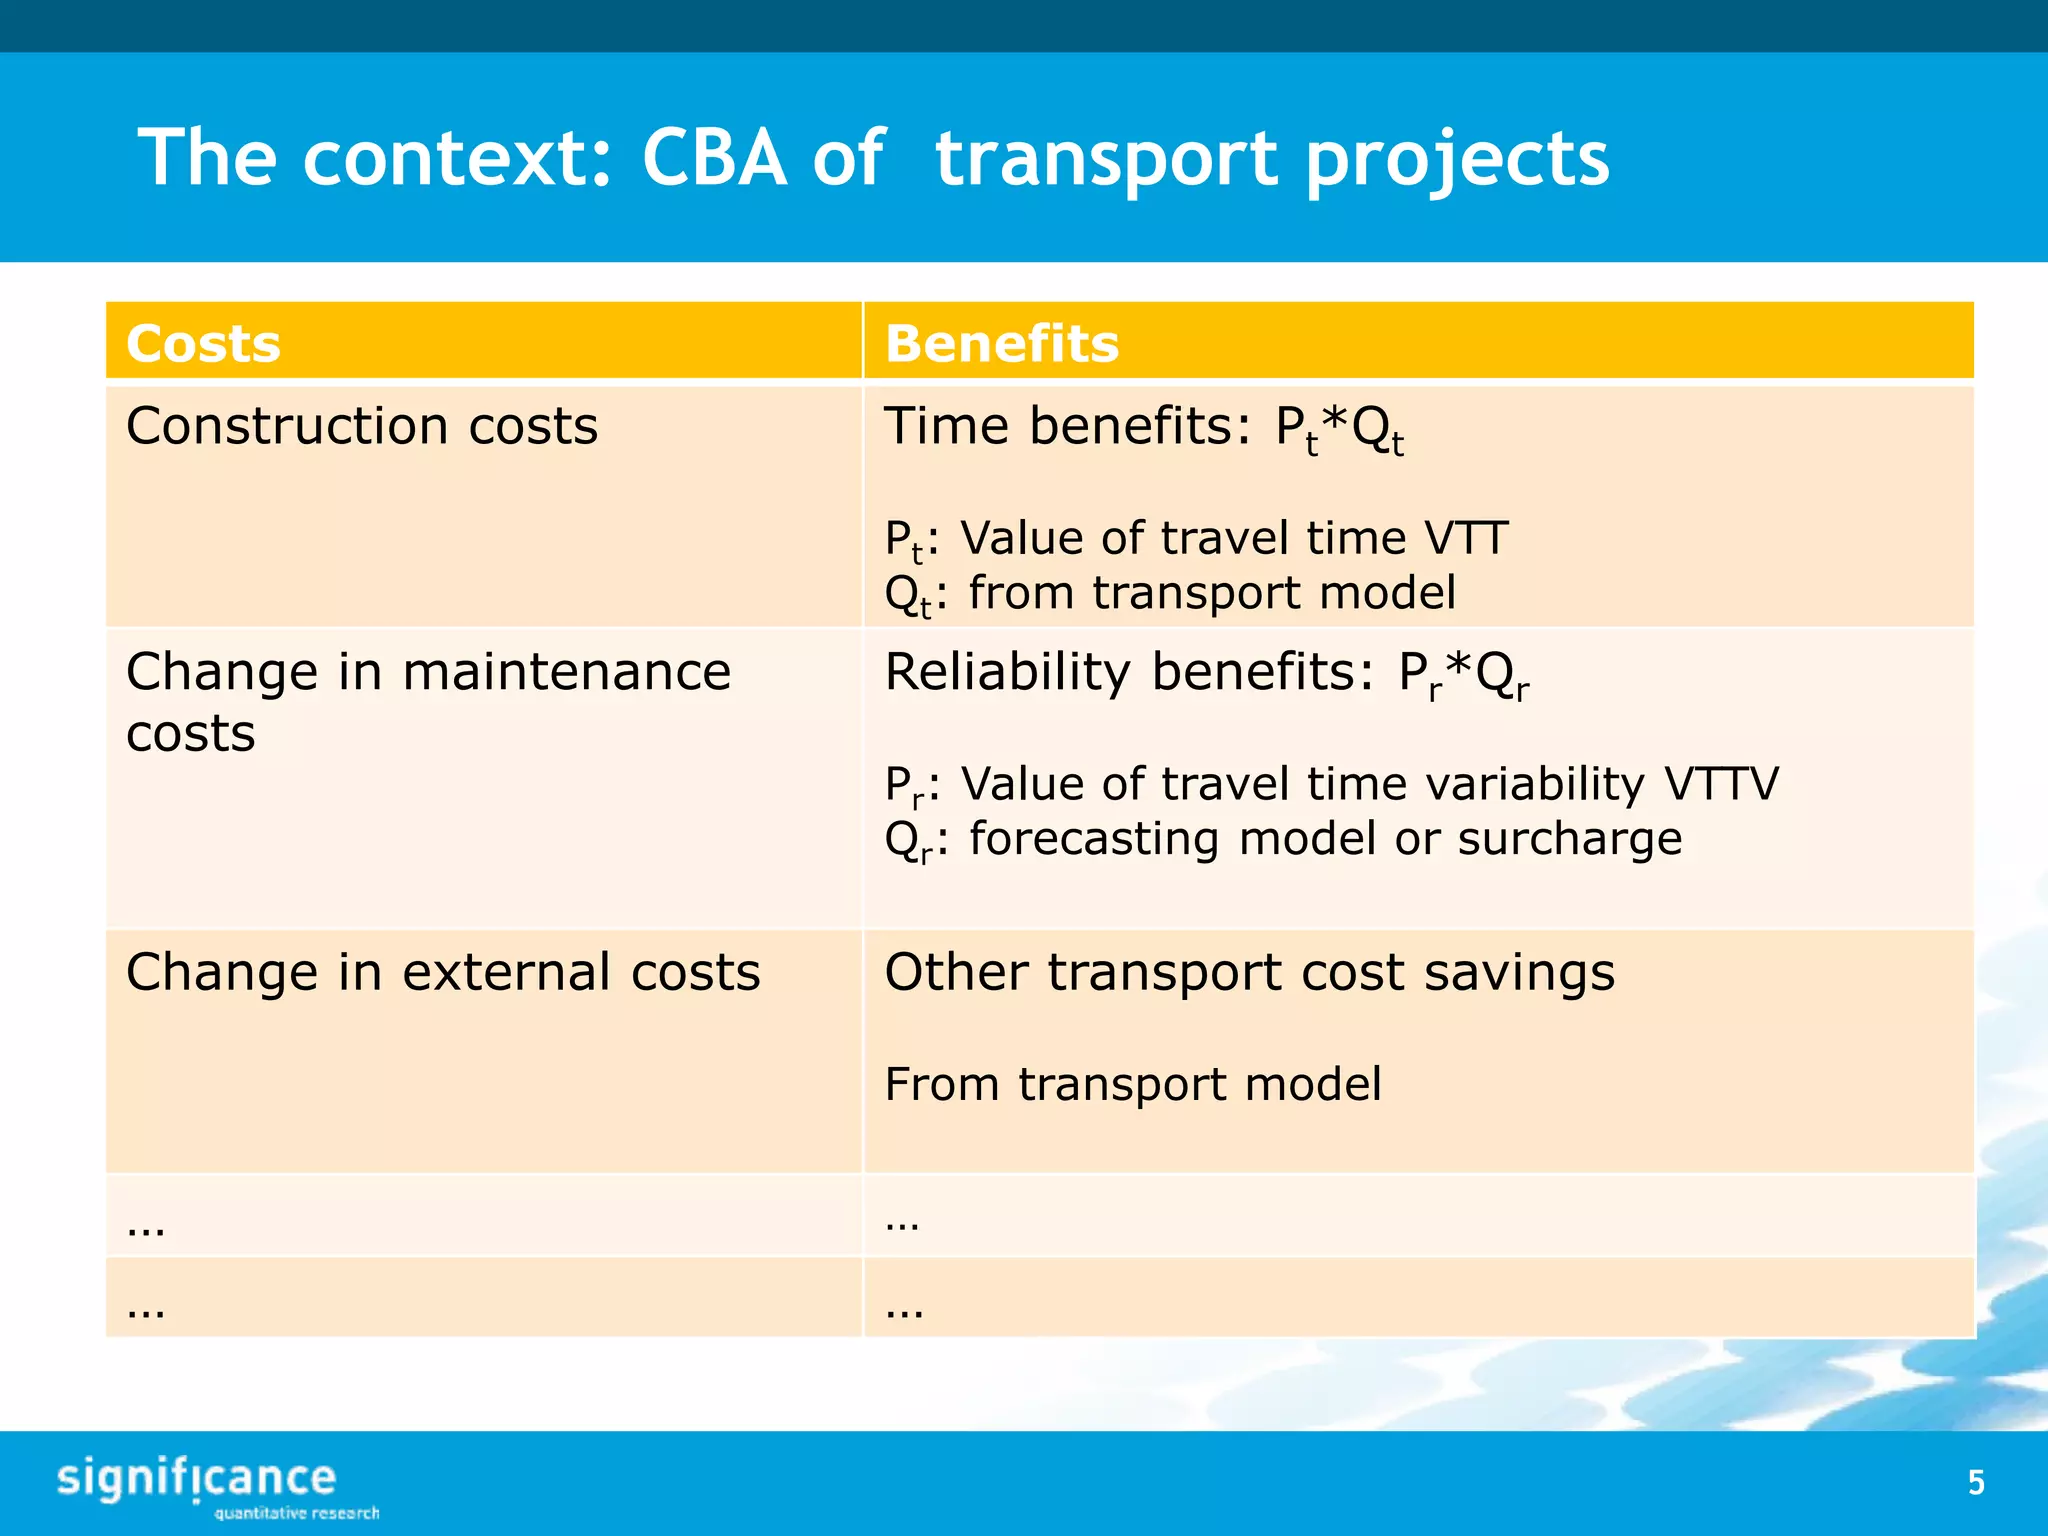
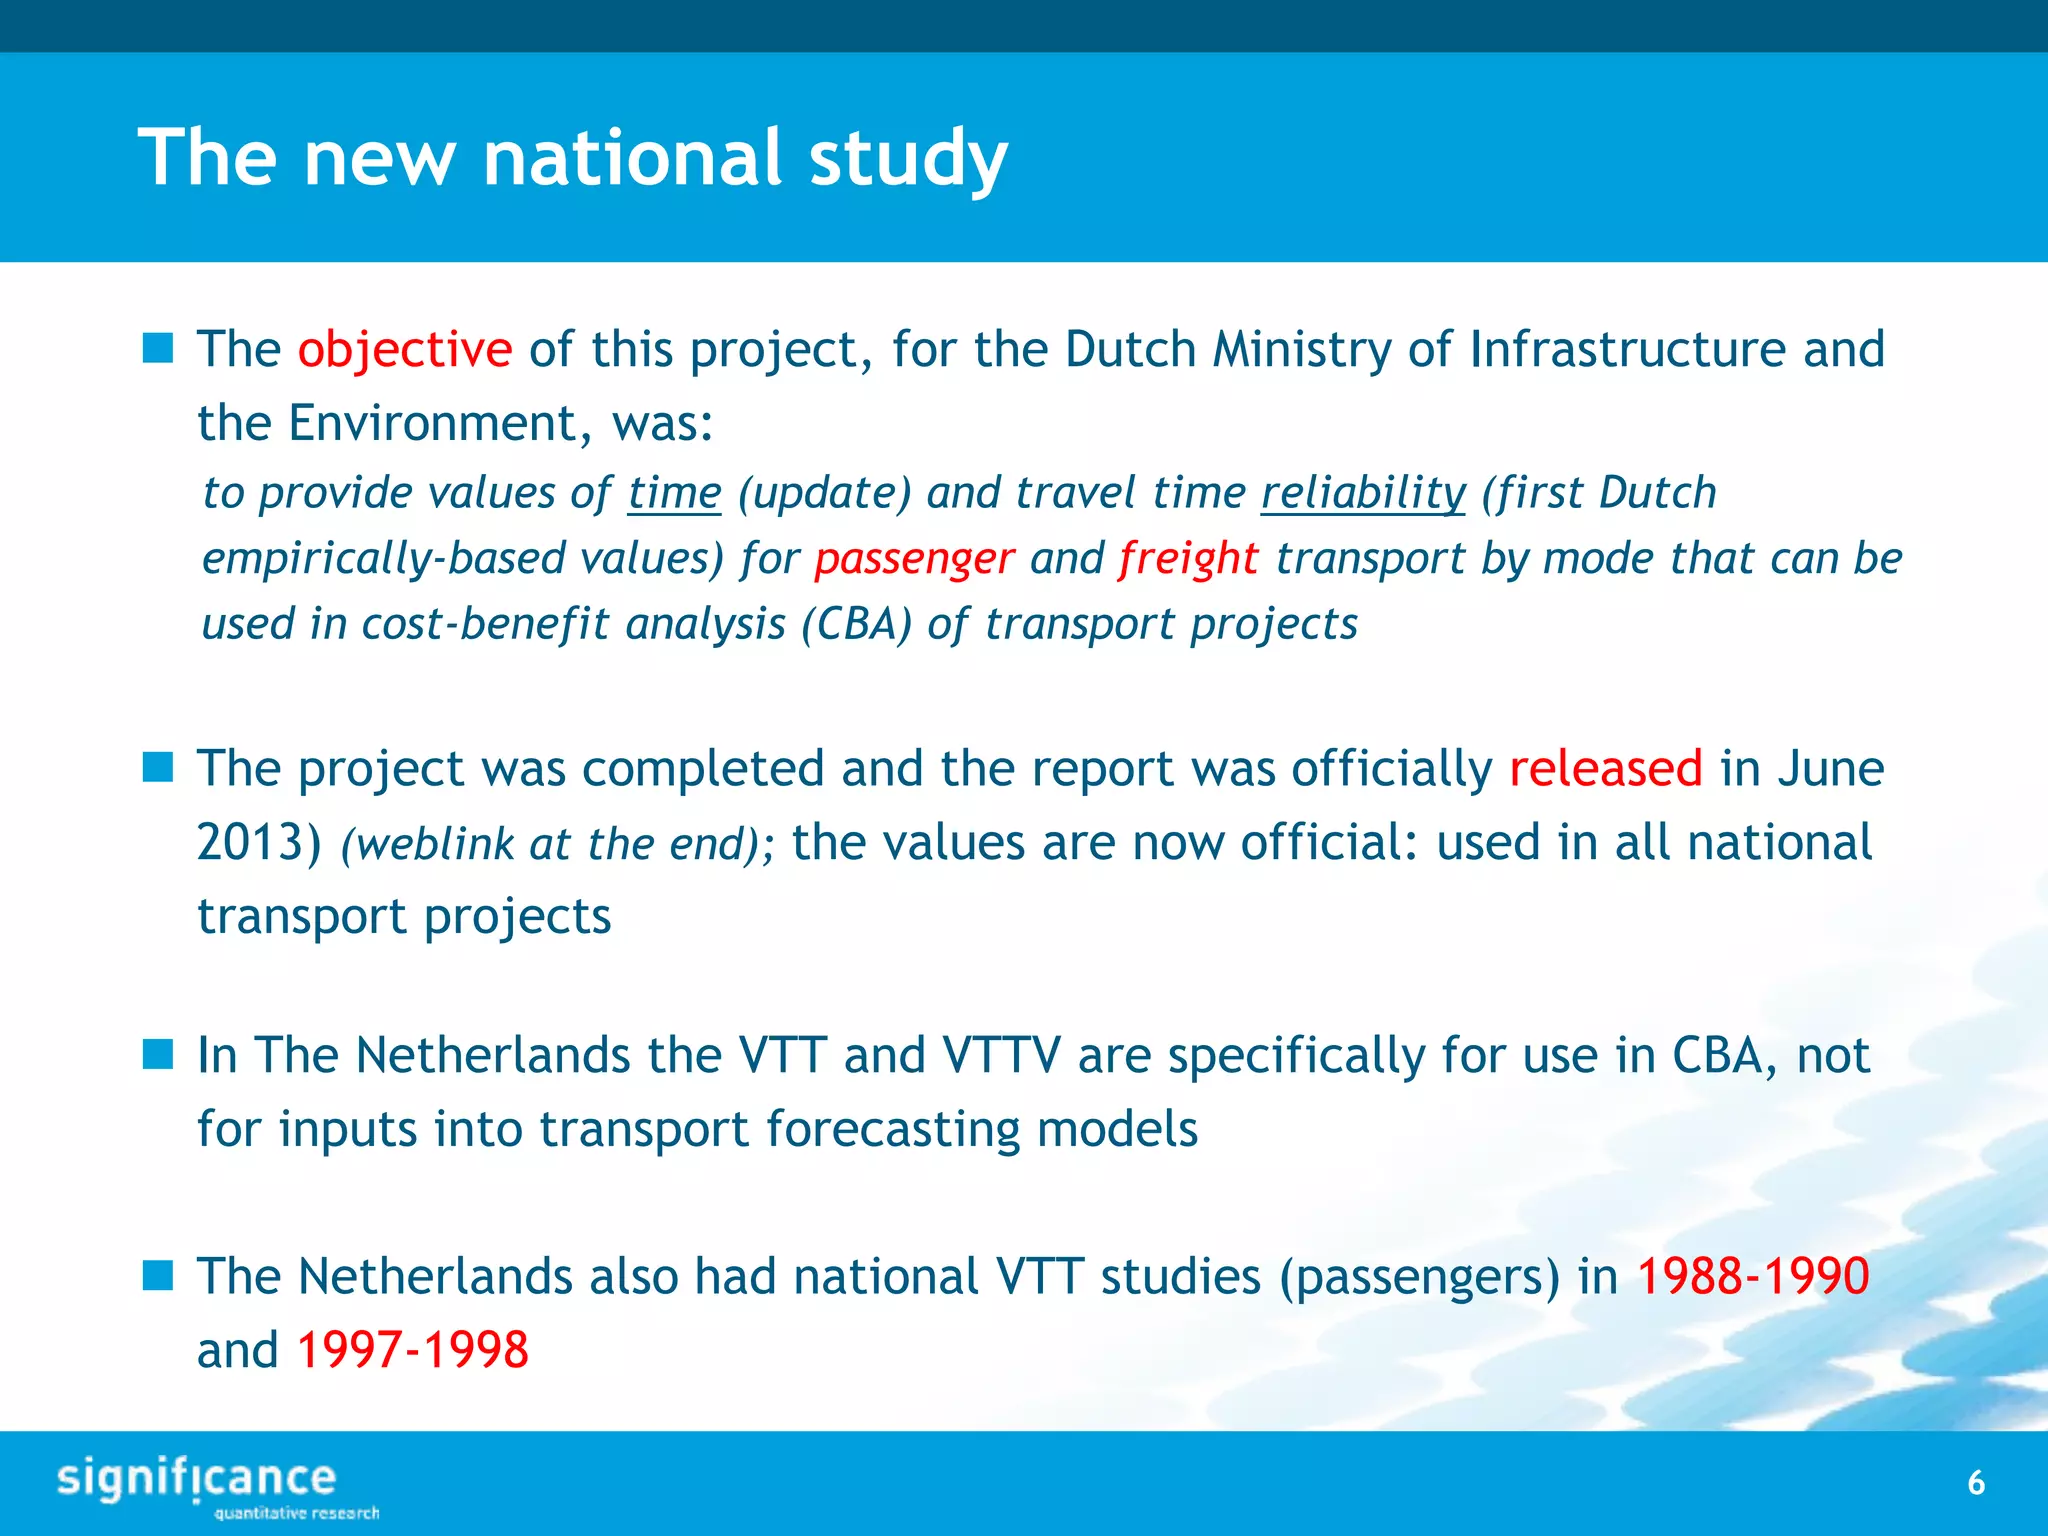
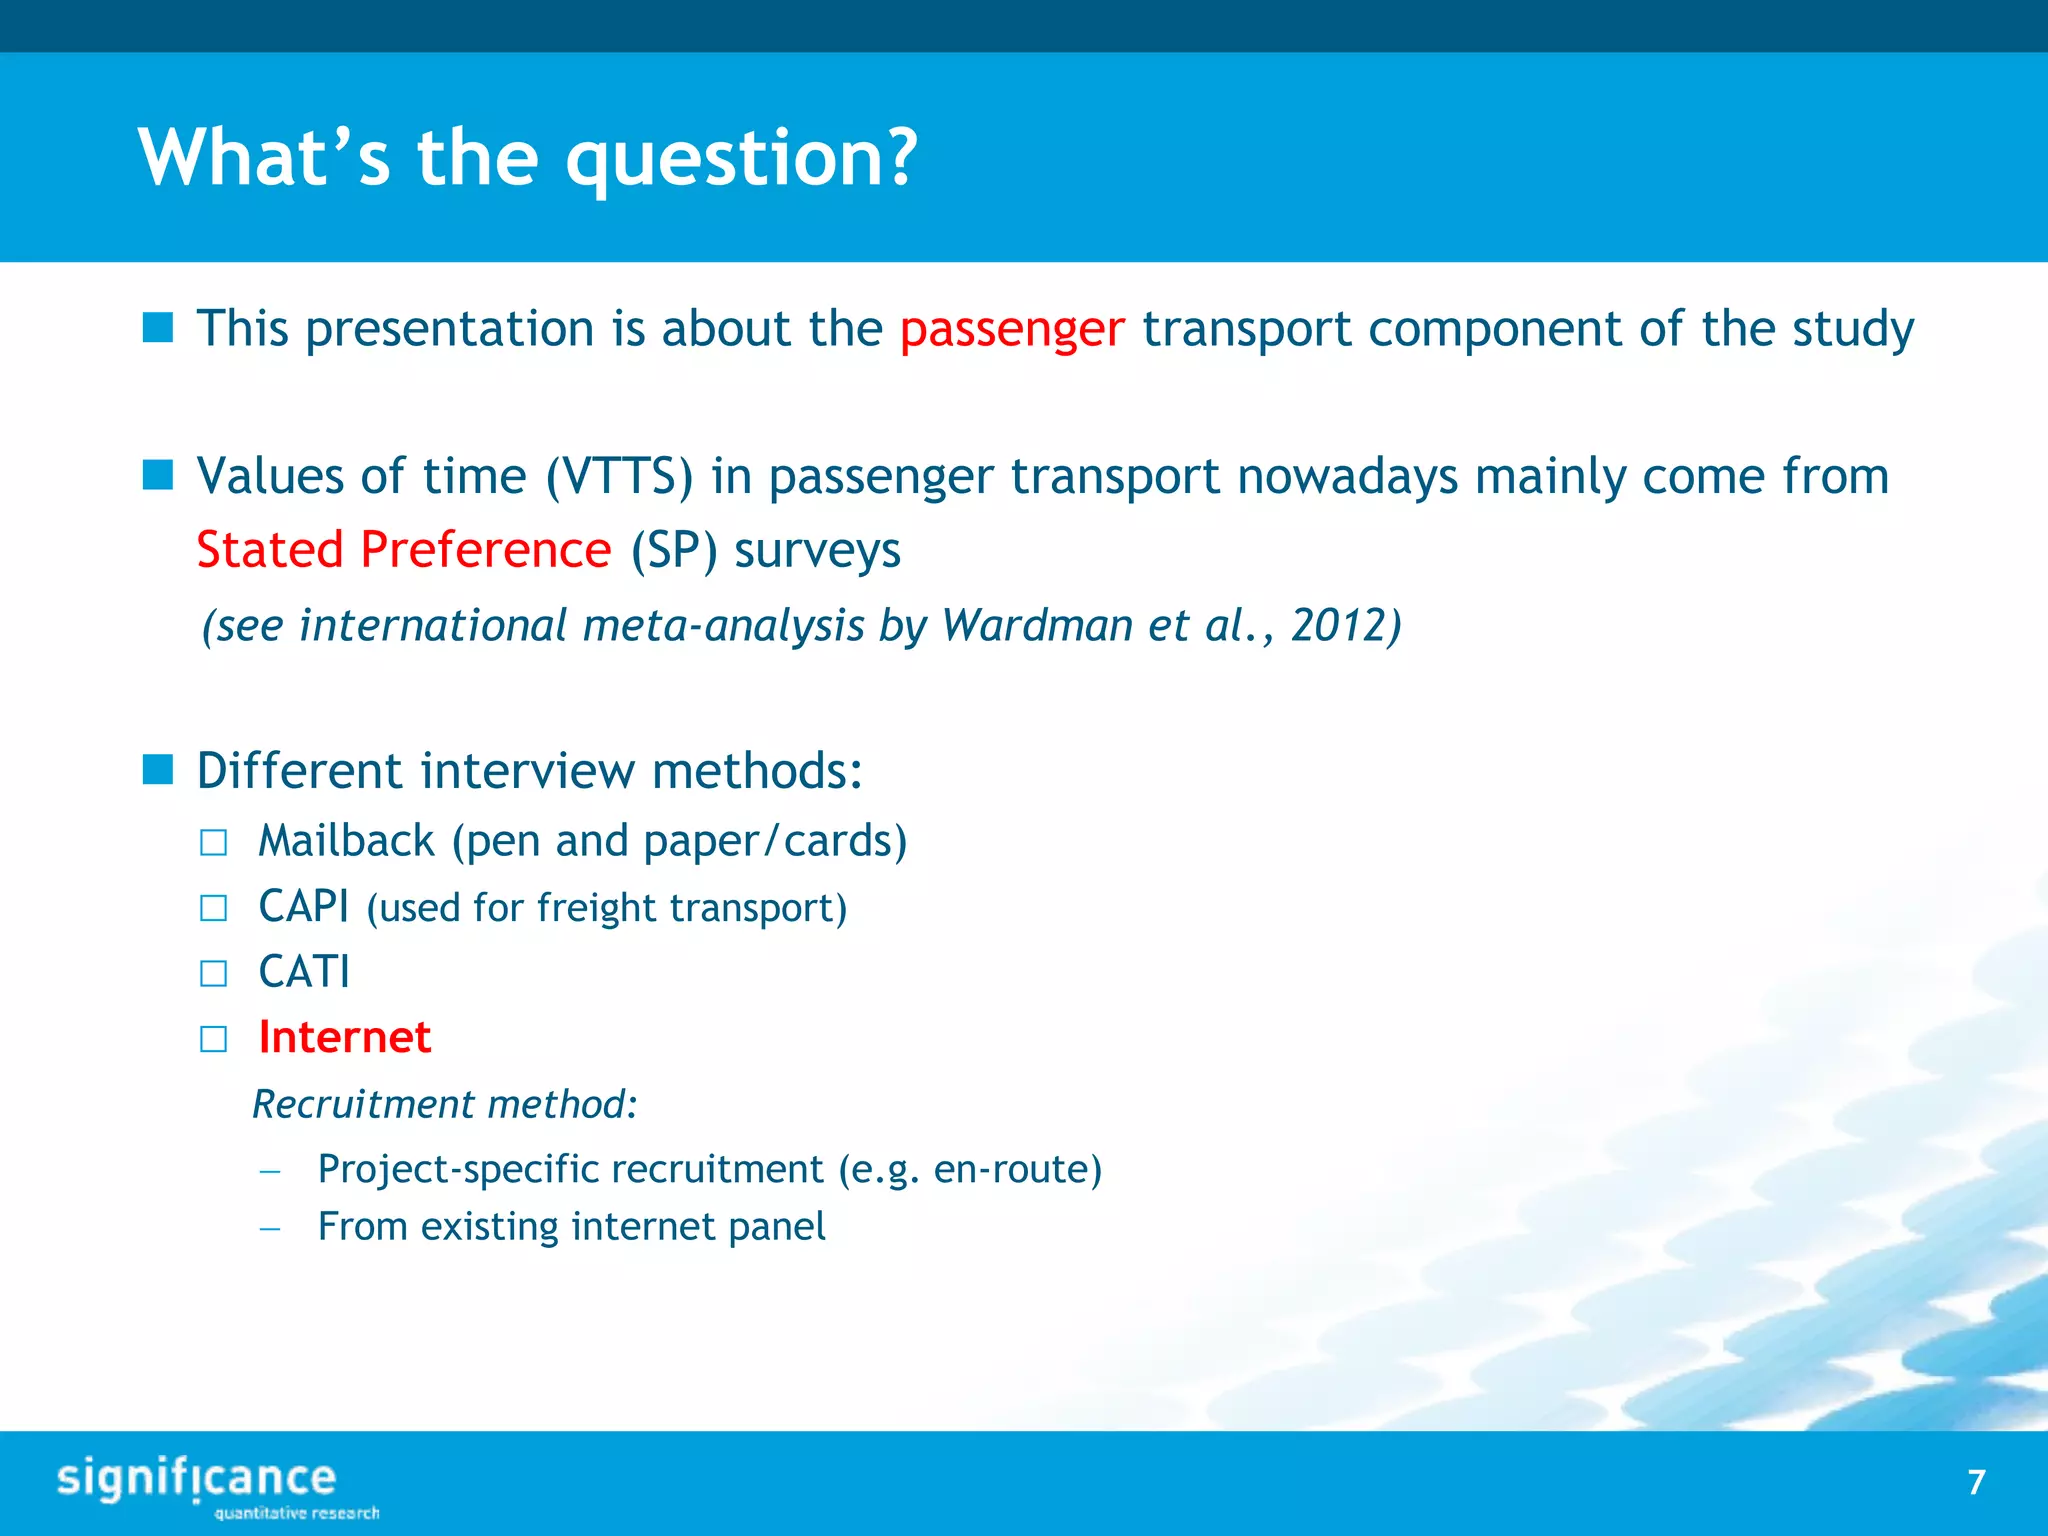
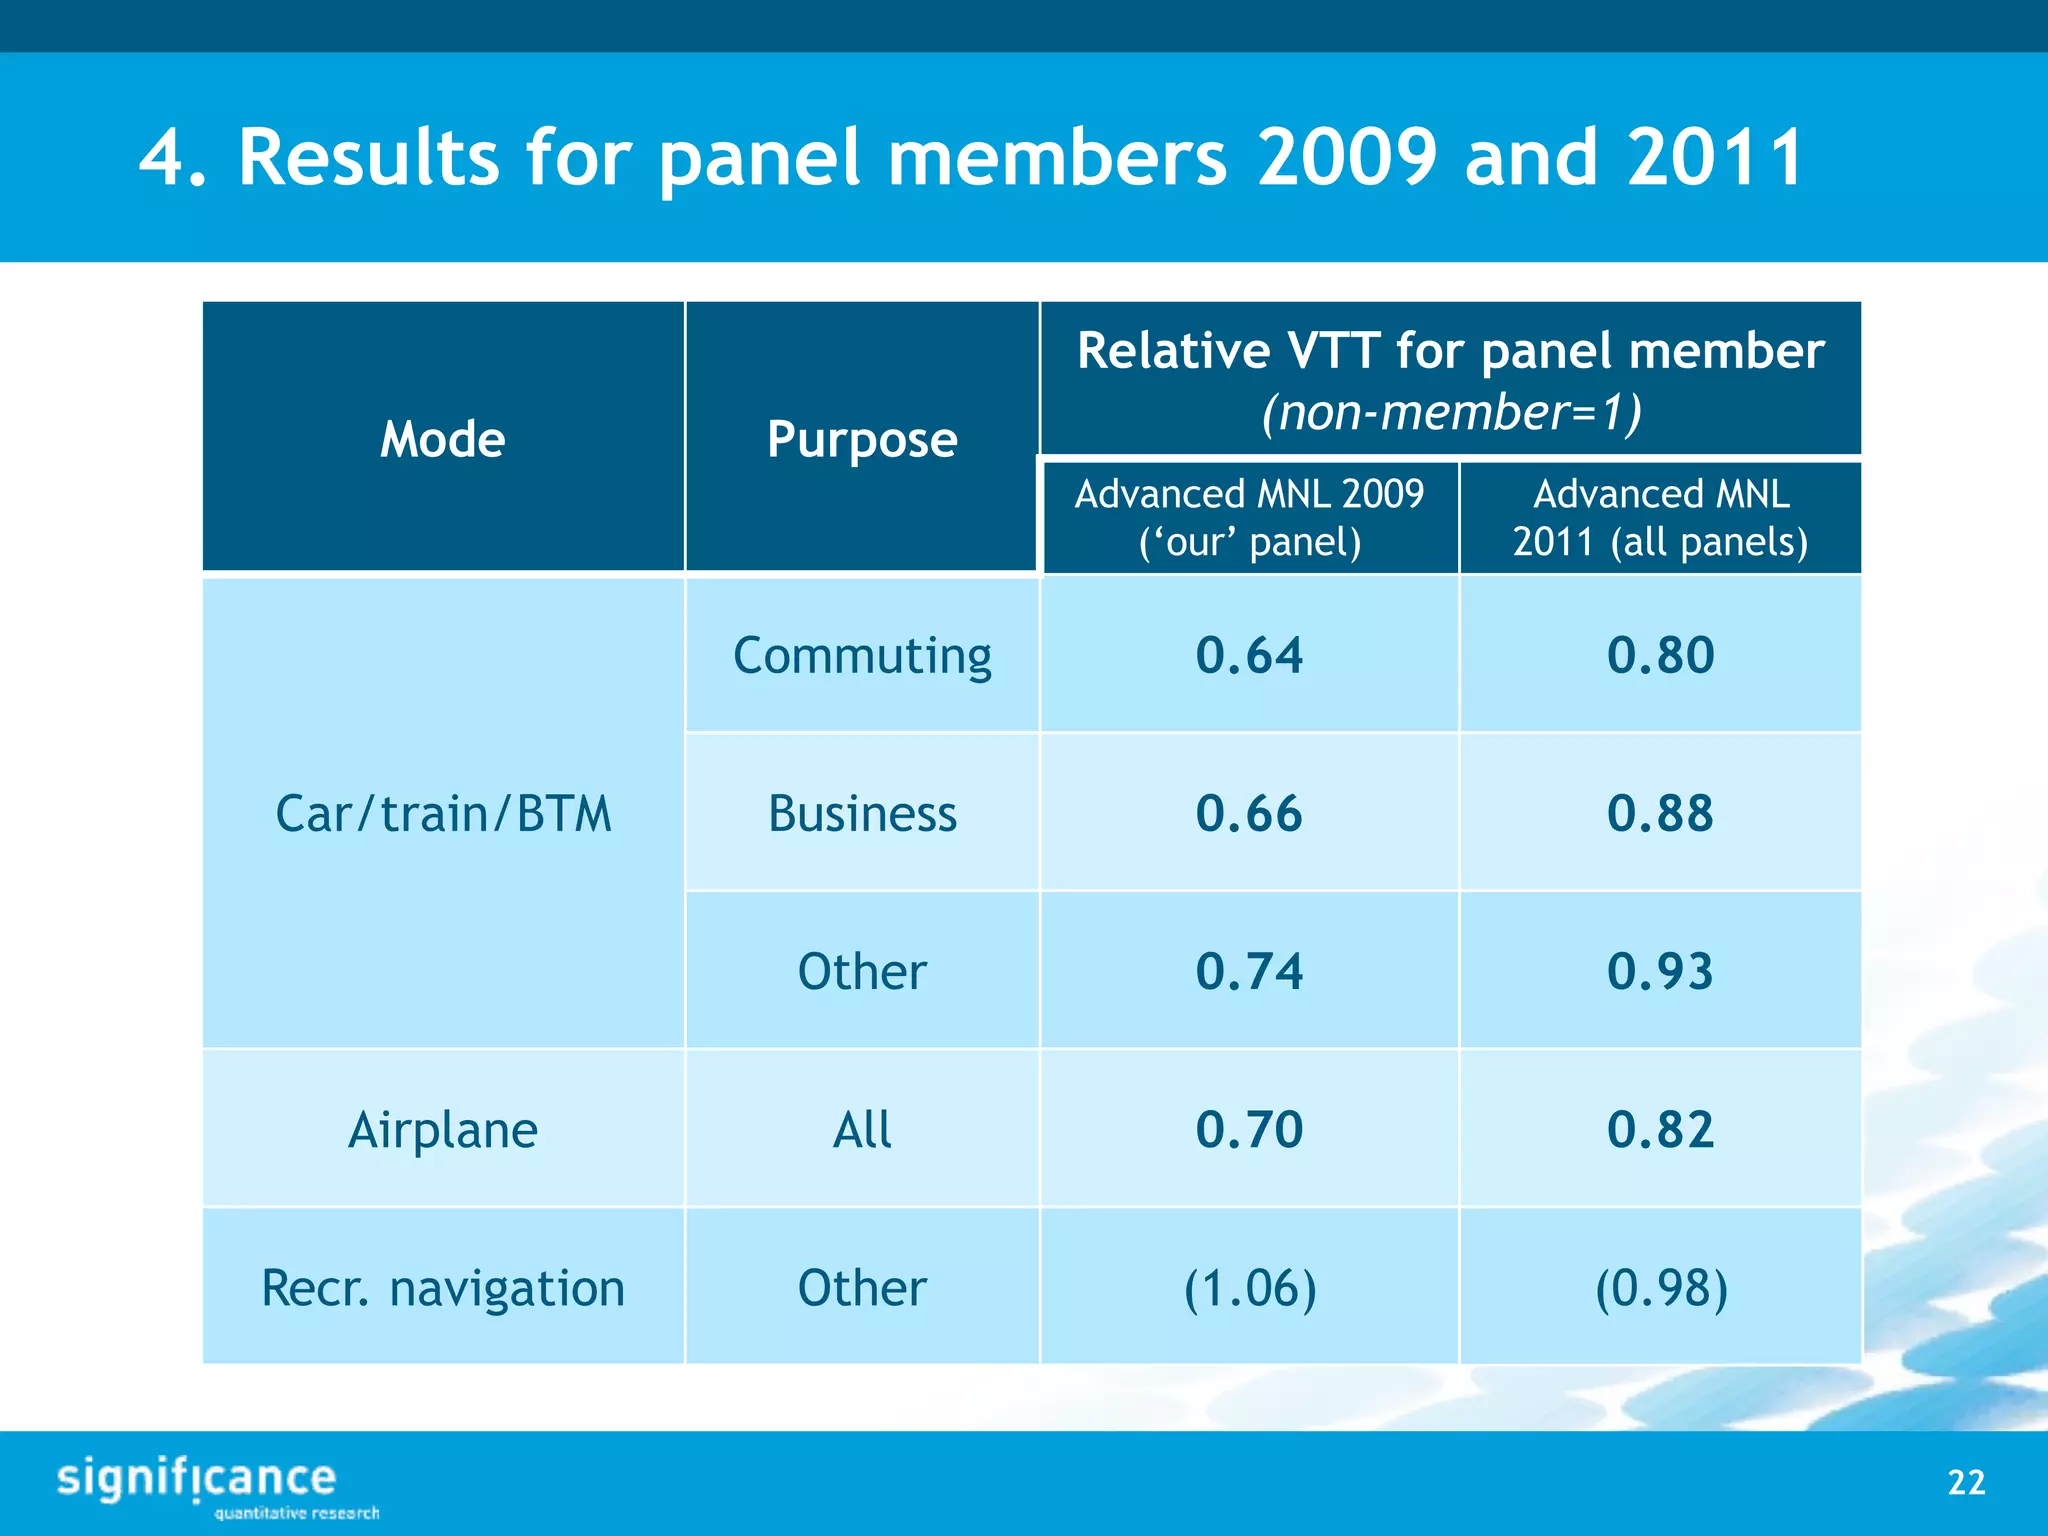
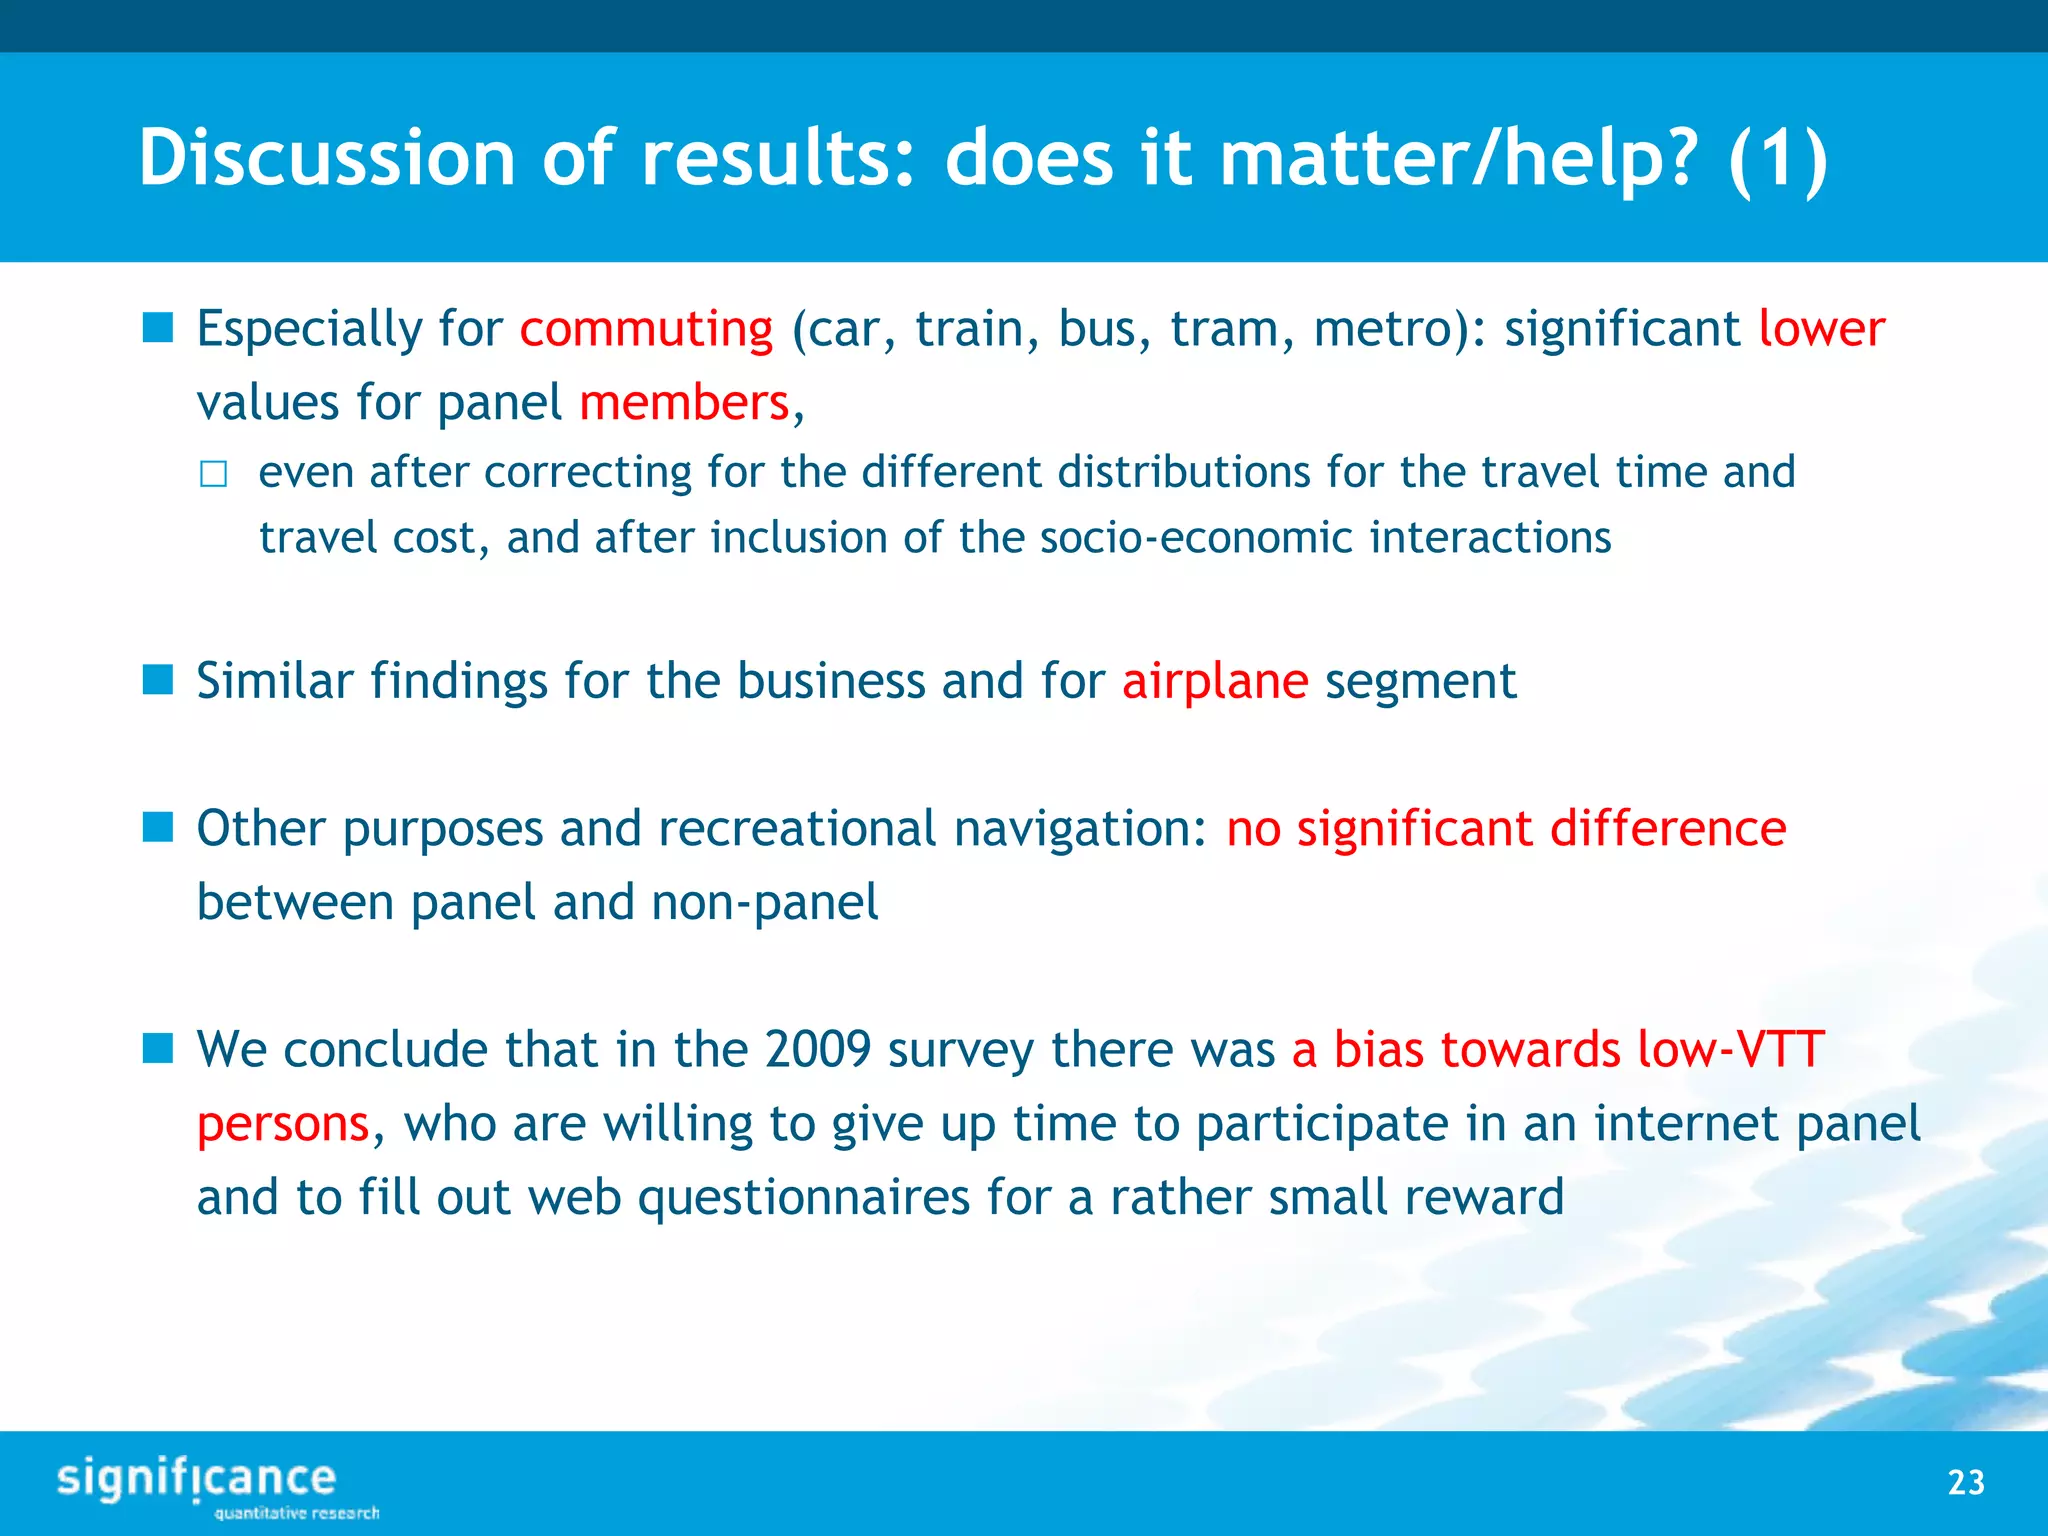
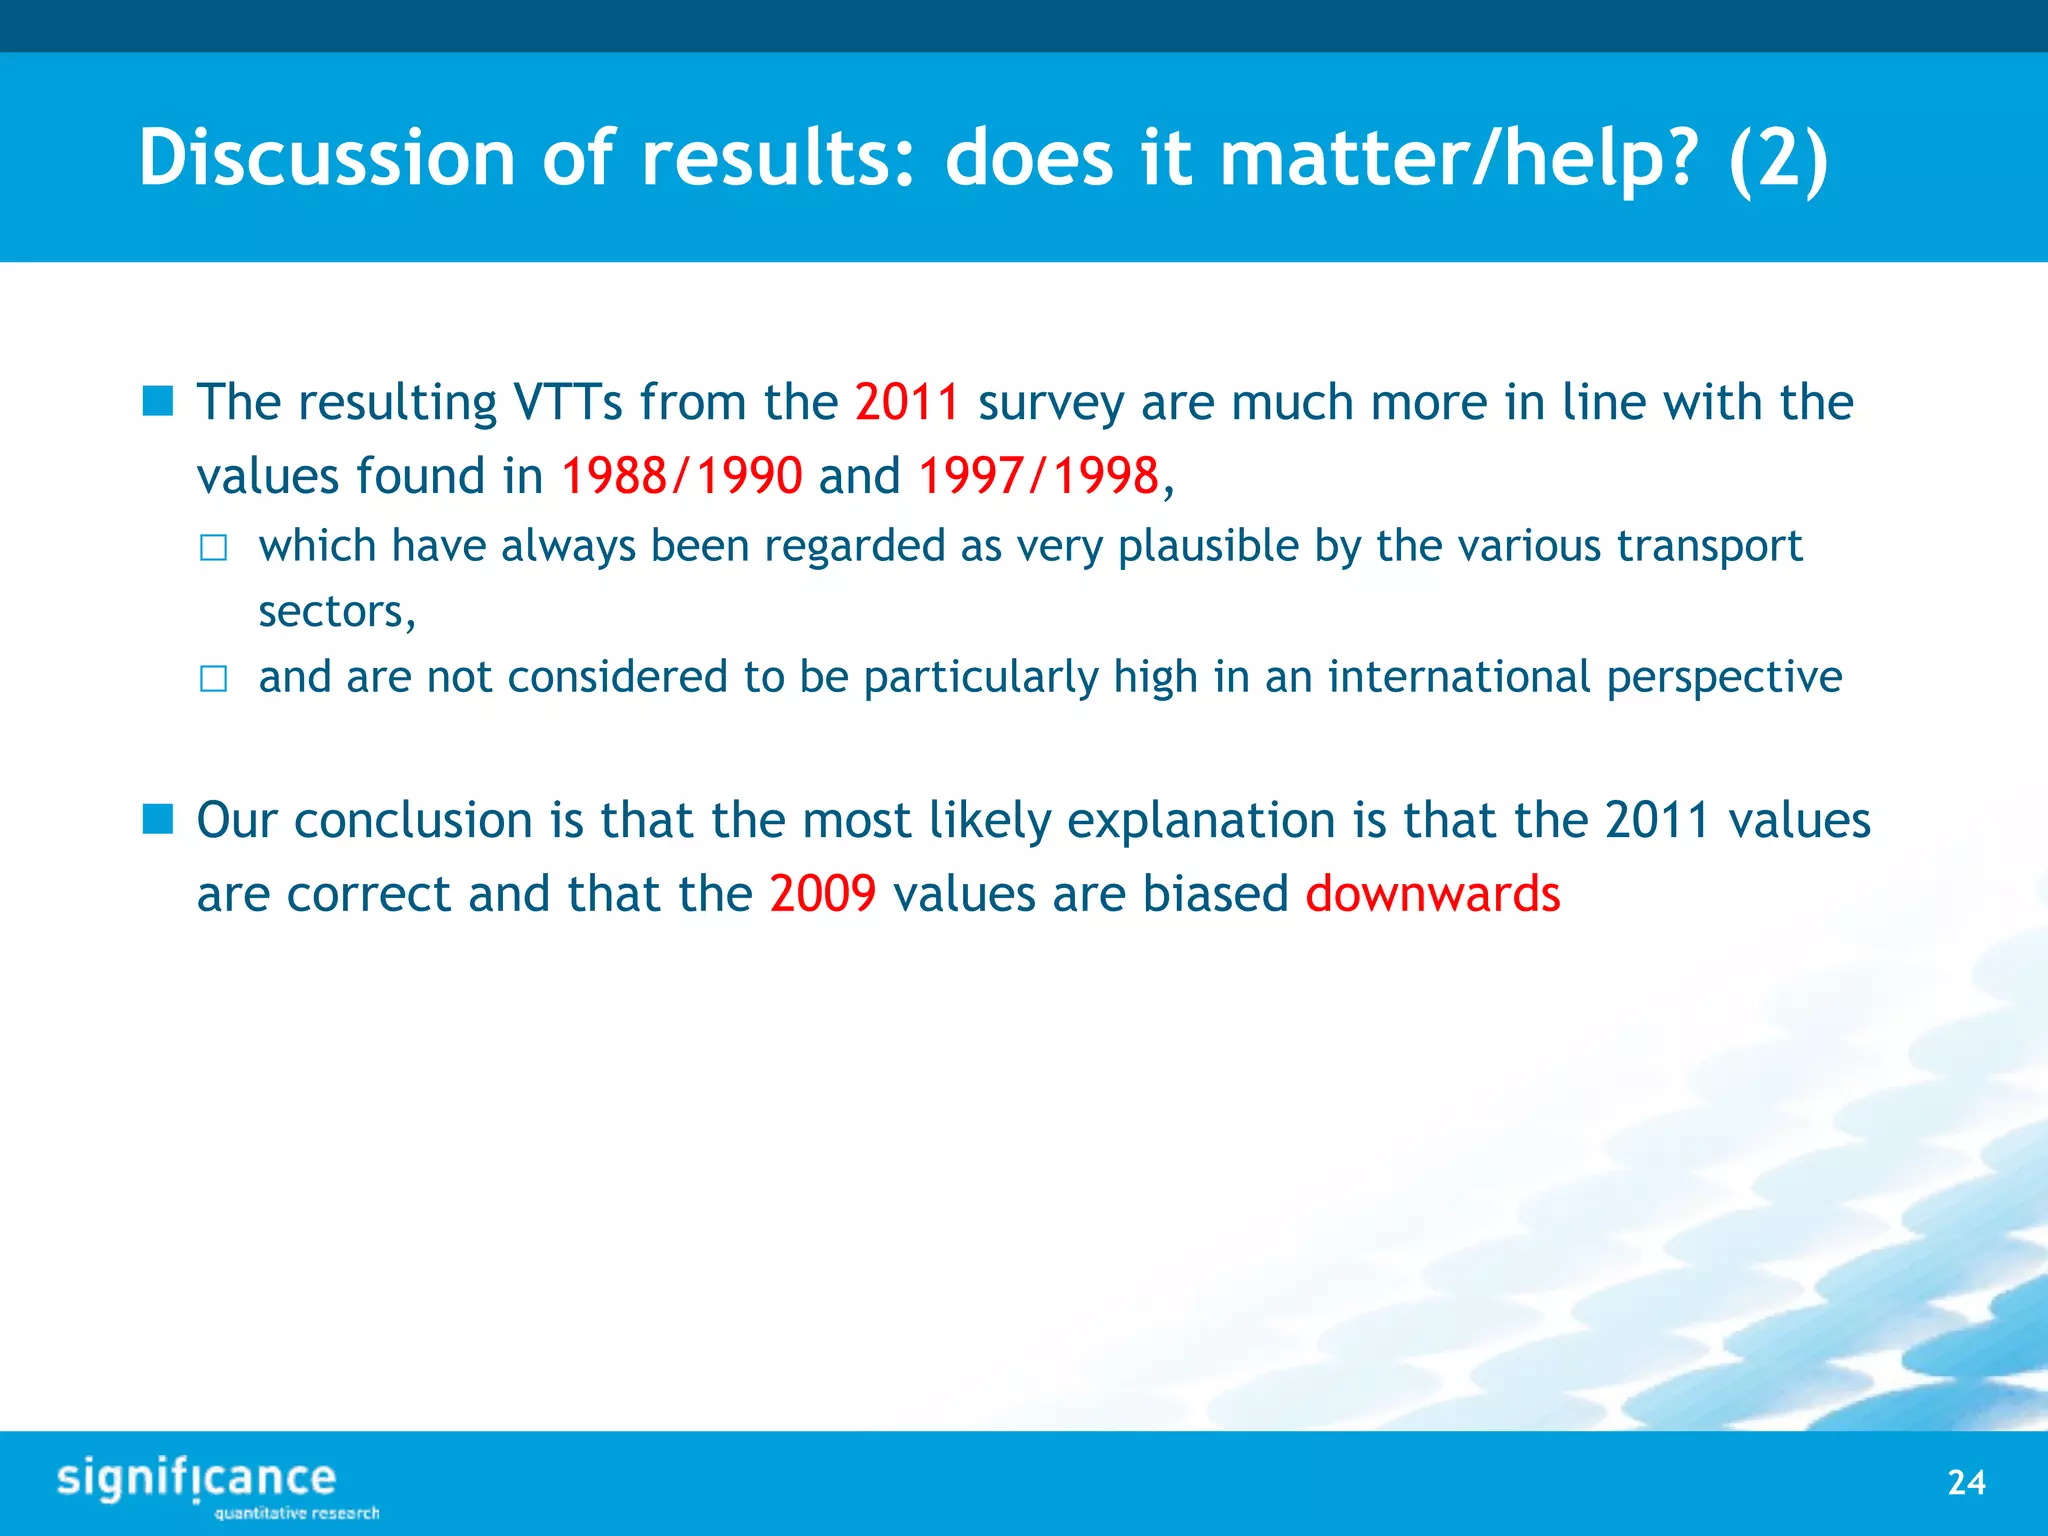
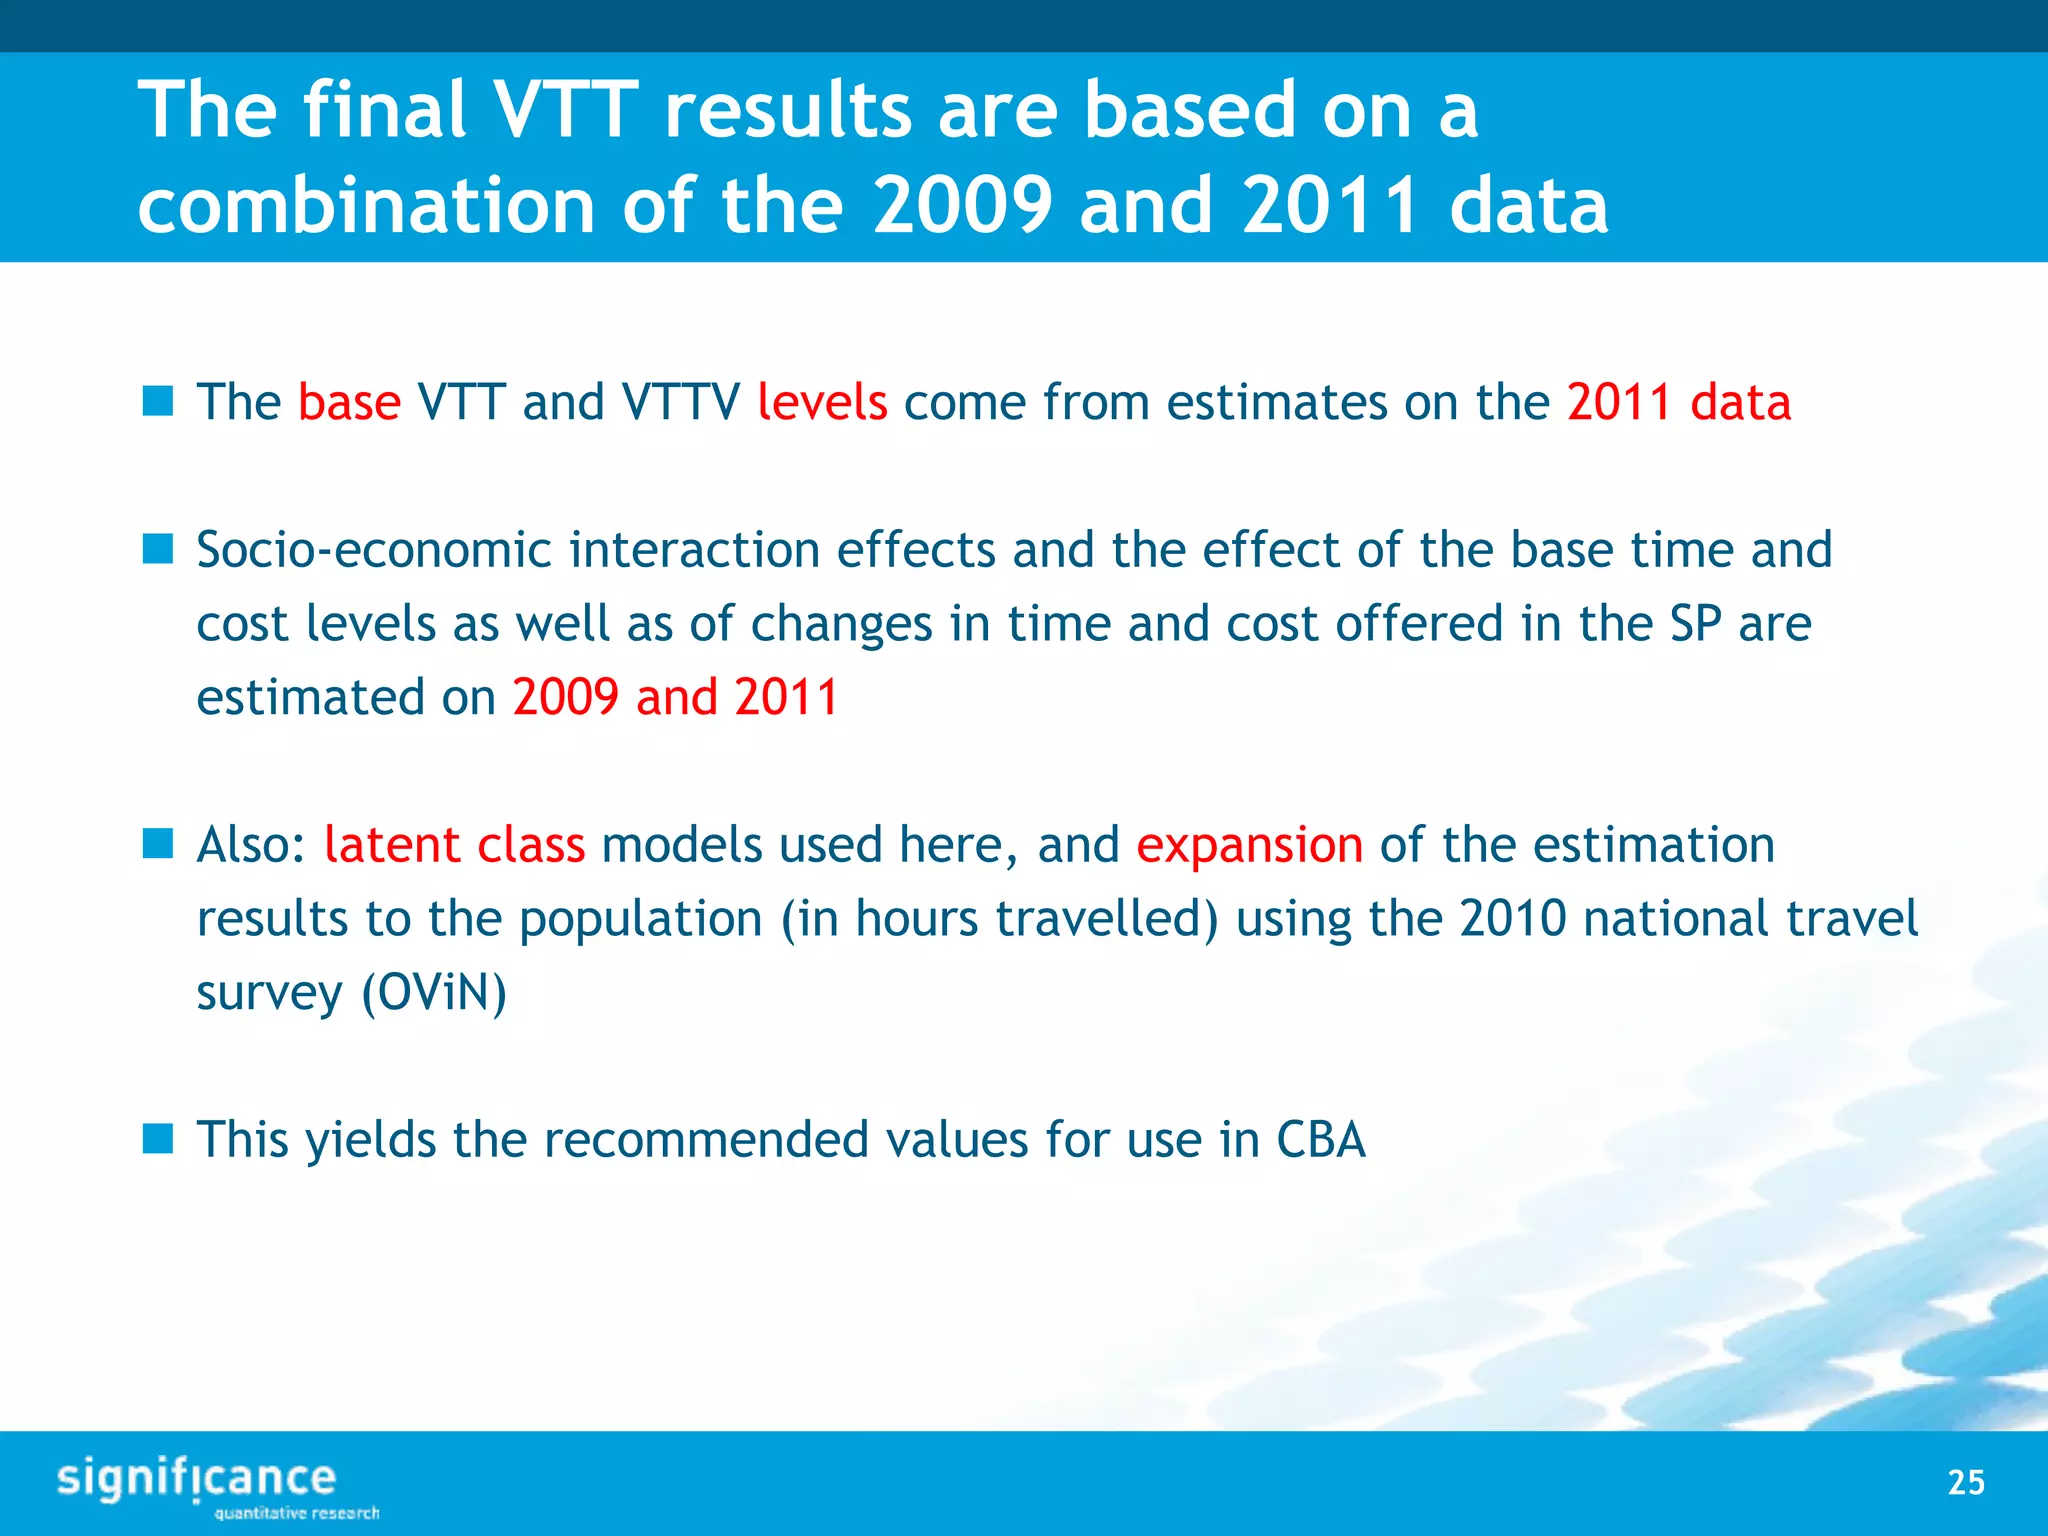
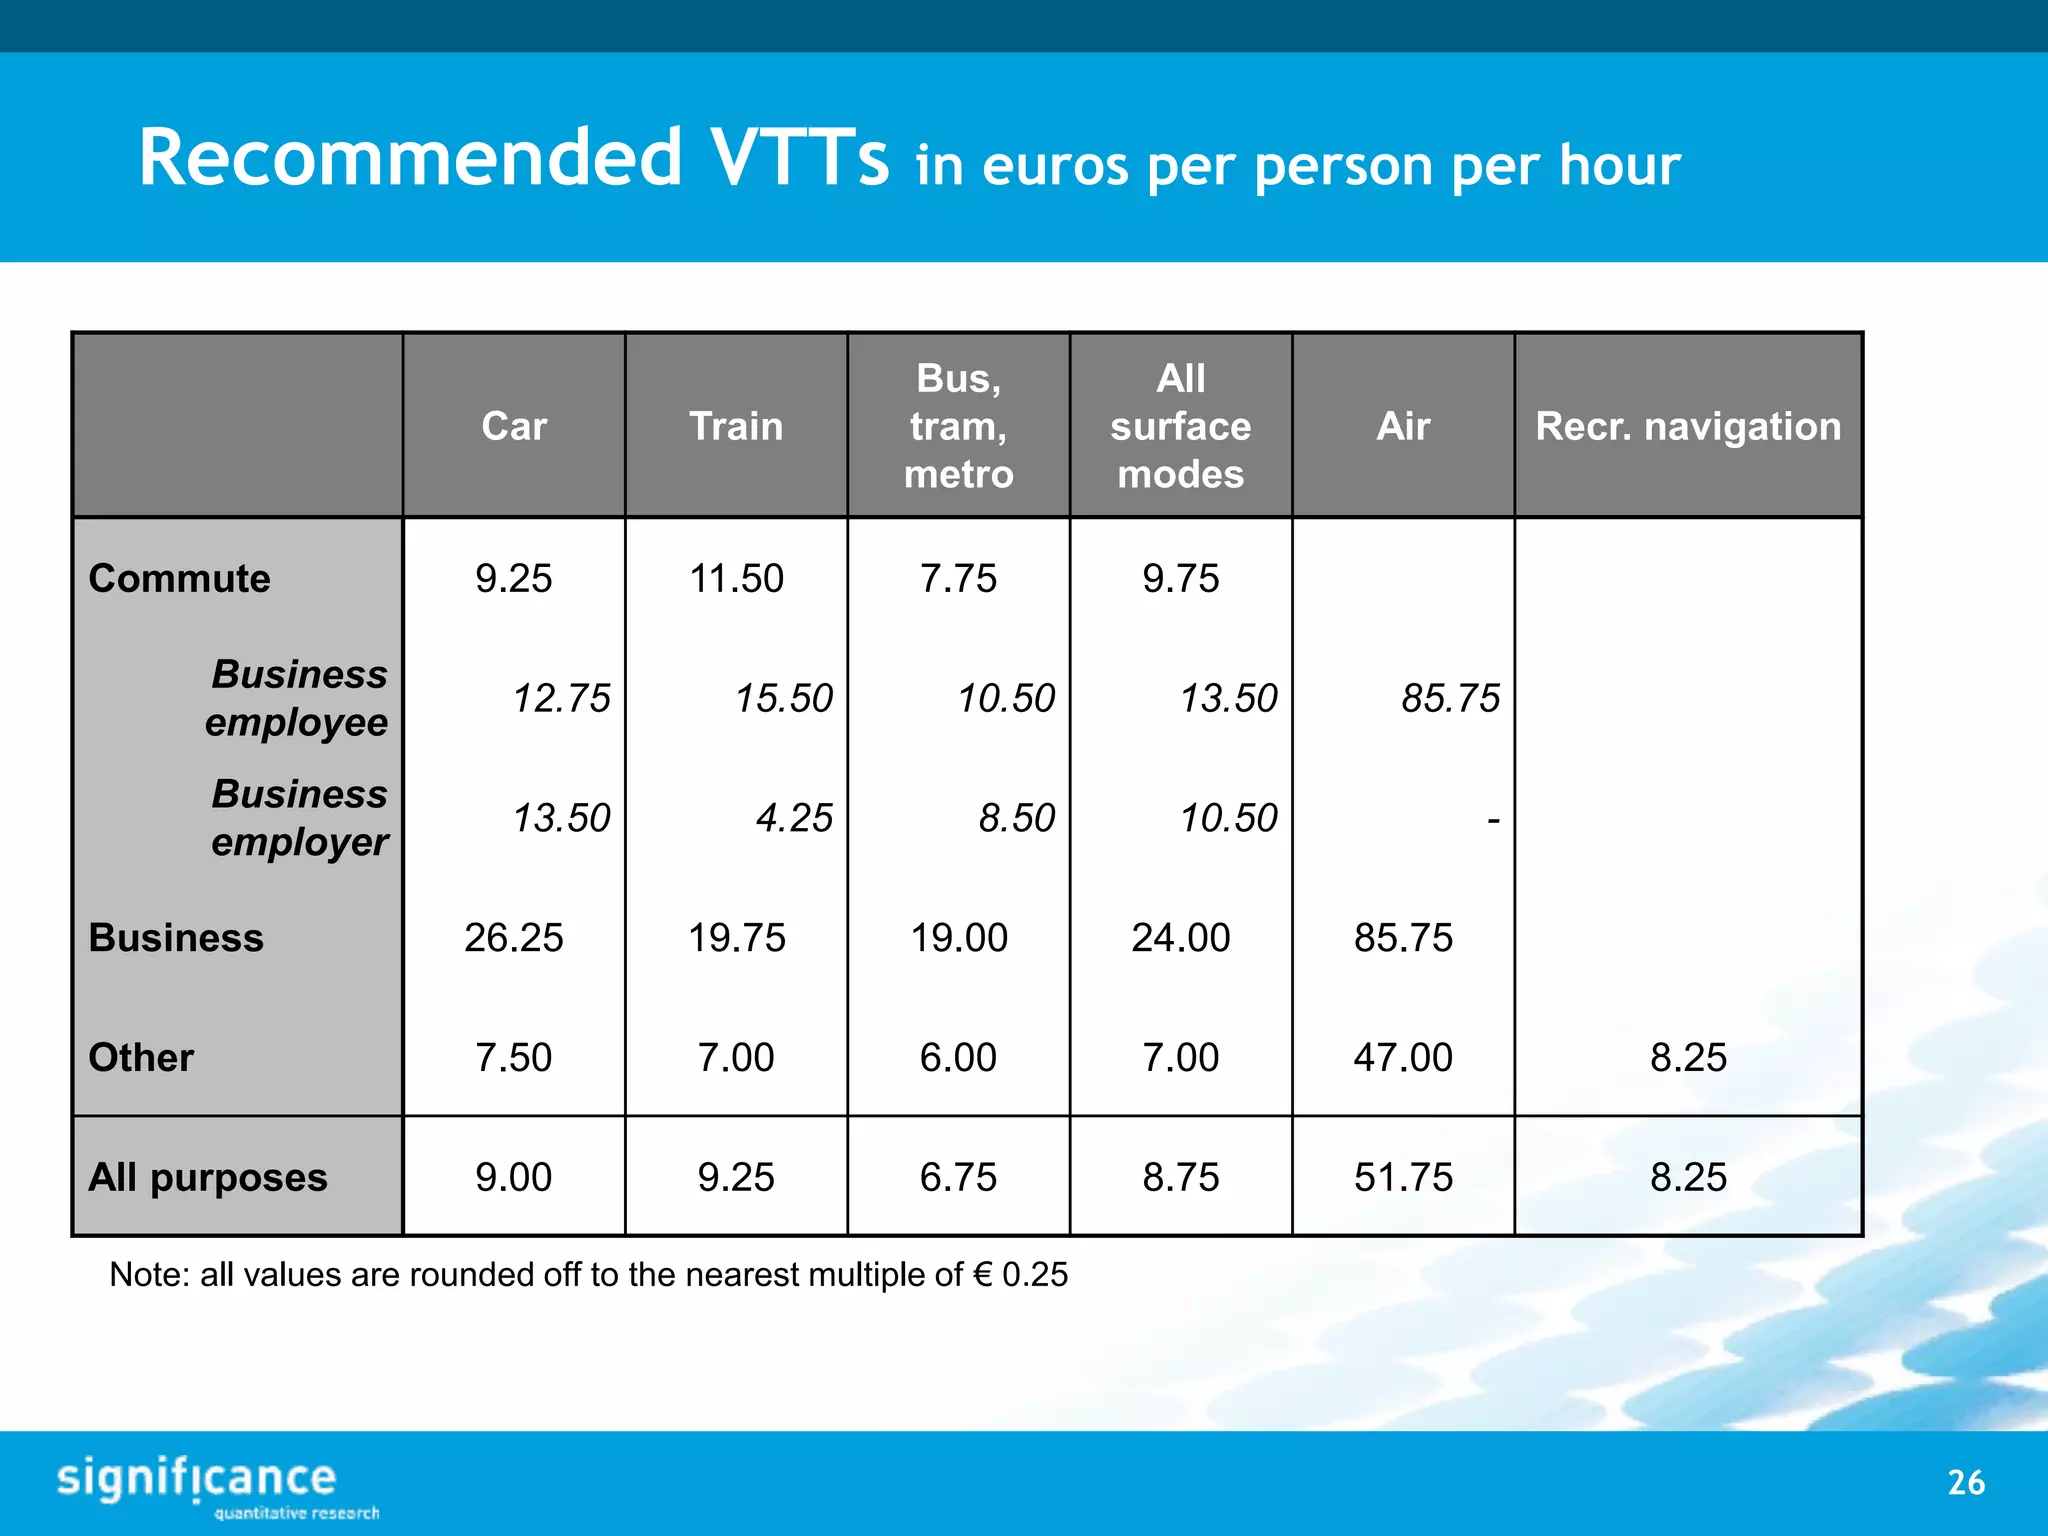
The 2013 national Dutch value of time study
Gerard de Jong – Significance and ITS Leeds
29 October 2015
The 2013 national Dutch value of time study
Gerard de Jong – Significance and ITS Leeds
29 October 2015
and reliability
Contents
1. What’s the question?
2. Data collection:
I. The 2009 SP data: internet panel
II. The 2011 SP data: en-route recruitment
3. Model estimation
4. Impact of recruitment method
5. The recommended values
6. A fair comparison of the 1997 and 2009/2011 VTT
3
Why do we need a VTT?
 In many countries, transport projects (e.g. new road or railway line) are
evaluated ex ante using cost-benefit analysis (CBA)
 In CBA project effects are expressed in money units
 Costs include construction, maintenance and external cost
 Main benefit often is travel time saved
□ There could also be journey time reliability benefits (often still ignored)
 This is in hours or minutes, so we need a conversion factor to money
□ This factor is called the value of travel time VTT (e.g. in euros per hour)
4
The context: CBA of transport projects
Costs Benefits
Construction costs Time benefits: Pt*Qt
Pt: Value of travel time VTT
Qt: from transport model
Change in maintenance
costs
Reliability benefits: Pr*Qr
Pr: Value of travel time variability VTTV
Qr: forecasting model or surcharge
Change in external costs Other transport cost savings
From transport model
… …
… …
5
The new national study
 The objective of this project, for the Dutch Ministry of Infrastructure and
the Environment, was:
to provide values of time (update) and travel time reliability (first Dutch
empirically-based values) for passenger and freight transport by mode that can be
used in cost-benefit analysis (CBA) of transport projects
 The project was completed and the report was officially released in June
2013) (weblink at the end); the values are now official: used in all national
transport projects
 In The Netherlands the VTT and VTTV are specifically for use in CBA, not
for inputs into transport forecasting models
 The Netherlands also had national VTT studies (passengers) in 1988-1990
and 1997-1998
6
What’s the question?
 This presentation is about the passenger transport component of the study
 Values of time (VTTS) in passenger transport nowadays mainly come from
Stated Preference (SP) surveys
(see international meta-analysis by Wardman et al., 2012)
 Different interview methods:
□ Mailback (pen and paper/cards)
□ CAPI (used for freight transport)
□ CATI
□ Internet
Recruitment method:
 Project-specific recruitment (e.g. en-route)
 From existing internet panel
7
Initial choice of interview and recruitment
method (2009 data)
 The SP surveys required considerable customisation
□ Mailback can only provide this through extensive two-step procedures
 CAPI and CATI were considered too expensive for a large survey (labour
cost)
 Initial choice: internet survey using an existing internet panel
8
2009 survey procedure (1)
 5,760 members of an existing on-line panel were interviewed using
computerised stated preference interviews in November 2009
 Specific target numbers of interviews were set (and reached) for different
segments:
□ Transport mode used (car, train/metro, bus/tram, airplane and recreational
navigation)
□ Travel purpose (commuting, business, other)
□ Time-of-day (peak, off-peak)
□ Presence of transfers (public transport only)
 All respondents were asked which modes they had used in the past three
months, etc.
□ This was used to allocate respondents to questionnaires for specific segments
9
2009 survey procedure (2)
 All respondents were drawn from the largest on-line panel of The
Netherlands (240.000 participants)
 The survey could be started by clicking on a weblink
 The members received a reward for successfully completing the interview
(equivalent to €1.50)
 The interviews on average took 20 minutes
10
Example of an SP choice screen (exp. 1)
11
Example of an SP choice screen (exp. 2a)
12
Initial results (2009 data)
 VOTs implausibly low
□ About € 4 per hour for car and public transport
□ Substantially lower than the official values (about € 9 per hour) and the
international literature
 Checked for possible explanations:
□ socio-economic composition of sample
□ travel time distribution of sample
□ changes in the statistical design of the SP
□ Including reliability in the SP
□ Increased use of mobile phones, smartphones
□ Impact of economic crisis
□ Increase in congestion
 These only explained part of the differences with the official values
13
But there could be another explanation …
 The sample of respondents obtained from this internet panel might be
biased with respect to their value of time
 Within each segment (socio-economic, trip purpose, trip length, mode),
the respondents that participate in such an online panel (which takes
time, for a rather low monetary reward) might have a lower VOT than a
non-participant
 This is a self-selection problem
 Even after expansion, the resulting values of time would then be lower
than the true values of time
 To investigate this hypothesis, another data set was collected in the first
half of 2011
14
The 2011 SP data: en-route recruitment
 Almost 1500 respondents recruited at petrol stations, parking garages,
train stations, bus stops, airports and ports
 This is the same recruitment method as in earlier national value of time
surveys of 1988/1990 and 1997/1998
 Persons willing to participate were asked to answer an internet
questionnaire on the intercepted trip:
□ Almost identical to the questionnaire used in 2009
□ We only asked one additional question to determine whether they were a
member of an internet panel (and whether this was “our” internet panel)
15
2011 Models distinguishing members/non-
members of internet panels
 MNL models
 Advanced MNL models that:
□ yield a higher VTT for higher base time and cost levels, and
□ smaller VTTs for smaller changes offered in time and cost
 Advanced MNL with socio-economic interaction terms
 Advanced MNL with socio-economic interaction terms plus latent VTT
classes (LC model)
16
Linear versus non-linear time and cost
effects in the utility function
Utility function 1997:
Utility function 2009/2011:
17
4. Results for MNL model
Mode Purpose
Relative VTT for panel member
(non-member=1)
MNL Adv MNL
Adv MNL +
socio
Latent
class
Car/train/BTM
Commuting 0.61
Business 0.93
Other 0.90
Airplane All 1.07
Recr. navigation Other (0.96)
18
4. Results for MNL models
Mode Purpose
Relative VTT for panel member
(non-member=1)
MNL
Advanced
MNL
Car/train/BTM
Commuting 0.61 0.80
Business 0.93 0.88
Other 0.90 0.93
Airplane All 1.07 0.82
Recr. navigation Other (0.96) (0.98)
19
4. Results for MNL models
Mode Purpose
Relative VTT for panel member
(non-member=1)
MNL
Advanced
MNL
Adv.MNL w.
interaction
Car/train/BTM
Commuting 0.61 0.80 0.80
Business 0.93 0.88 0.87
Other 0.90 0.93 (1.01)
Airplane All 1.07 0.82 0.82
Recr. navigation Other (0.96) (0.98) (0.98)
20
4. Results for MNL and LC models
Mode Purpose
Relative VTT for panel member
(non-member=1)
MNL
Advanced
MNL
Adv.MNL w.
interaction
Latent
class
Car/train/BTM
Commuting 0.61 0.80 0.80 0.80
Business 0.93 0.88 0.87 (0.81)
Other 0.90 0.93 (1.01) (0.89)
Airplane All 1.07 0.82 0.82 0.82
Recr. navigation Other (0.96) (0.98) (0.98) (0.95)
21
4. Results for panel members 2009 and 2011
Mode Purpose
Relative VTT for panel member
(non-member=1)
Advanced MNL 2009
(‘our’ panel)
Advanced MNL
2011 (all panels)
Car/train/BTM
Commuting 0.64 0.80
Business 0.66 0.88
Other 0.74 0.93
Airplane All 0.70 0.82
Recr. navigation Other (1.06) (0.98)
22
Discussion of results: does it matter/help? (1)
 Especially for commuting (car, train, bus, tram, metro): significant lower
values for panel members,
□ even after correcting for the different distributions for the travel time and
travel cost, and after inclusion of the socio-economic interactions
 Similar findings for the business and for airplane segment
 Other purposes and recreational navigation: no significant difference
between panel and non-panel
 We conclude that in the 2009 survey there was a bias towards low-VTT
persons, who are willing to give up time to participate in an internet panel
and to fill out web questionnaires for a rather small reward
23
Discussion of results: does it matter/help? (2)
 The resulting VTTs from the 2011 survey are much more in line with the
values found in 1988/1990 and 1997/1998,
□ which have always been regarded as very plausible by the various transport
sectors,
□ and are not considered to be particularly high in an international perspective
 Our conclusion is that the most likely explanation is that the 2011 values
are correct and that the 2009 values are biased downwards
24
The final VTT results are based on a
combination of the 2009 and 2011 data
 The base VTT and VTTV levels come from estimates on the 2011 data
 Socio-economic interaction effects and the effect of the base time and
cost levels as well as of changes in time and cost offered in the SP are
estimated on 2009 and 2011
 Also: latent class models used here, and expansion of the estimation
results to the population (in hours travelled) using the 2010 national travel
survey (OViN)
 This yields the recommended values for use in CBA
25
Recommended VTTs in euros per person per hour
26
Car Train
Bus,
tram,
metro
All
surface
modes
Air Recr. navigation
Commute 9.25 11.50 7.75 9.75
Business
employee
12.75 15.50 10.50 13.50 85.75
Business
employer
13.50 4.25 8.50 10.50 -
Business 26.25 19.75 19.00 24.00 85.75
Other 7.50 7.00 6.00 7.00 47.00 8.25
All purposes 9.00 9.25 6.75 8.75 51.75 8.25
Note: all values are rounded off to the nearest multiple of € 0.25
Recommended reliability ratios
 Reliability ratio (RR) = value of standard deviation of travel time/VTT
 Car, train, bus, tram and metro:
□ Commuting 0.4
□ Business 1.1
□ Other 0.6
 Air:
□ Business 0.7
□ Other 0.7
27
It’s just not fair!
28
It’s just not fair!
29
 Fair comparison: comparing like with like
 Otherwise conclusions will be incorrect:
 Not based on real differences but on differences in methodology
The seven differences (methodological)
1997 2009/2011
Estimation space
Interactions with
cost and time
Interactions with
VTT
Cost and time terms Linear Linear & non-linear
Dependence of VTT
on travel time itself
No Yes
Socio-economic
interaction factors
No education
Different set,
including education
Expansion procedure
Weights per
segment
Sample enumeration
Expansion totals OVG 1995 OViN 2010
Type of model MNL panel latent class
30
 Therefore the VTT in the 1998 report and the 2013 report cannot be
compared
Expected changes 1997-2010
 Consumer prices rose by 32%
-> VTT +32%
 Real income (over and above the price change) went up by 30%. The Dutch
guidelines adopted an income elasticity of the VTT of 0.5
-> VTT +15%
 More congestion, more crowded trains, lower compensation of cost, crisis
 New ICT has become much more common in this period:
□ Mobiles (including handsfree, car kit), smartphones, iPads, laptops
□ Easier to use travel time in a more productive/enjoyable way
-> VTT 
 In the period 1988-1997 VTT did not change much:
□ Gunn (2001): effect of real income growth more or less balanced by the
technology effects
31
Methodology to obtain a fair comparison
 Applying the 1997 methods on the 2009/2011 data is not so interesting (no
benefits from methodological improvements)
 So we redid the analysis of the 1997 data using the 2009/2011 methods
 We did this re-analysis step-by-step to see the impact of each of the seven
differences (similar steps for the analysis of 2009/2011 data)
 This gives two results:
□ Which VTT would we have obtained in the nineties if we could had used modern
methods (and future population data)?
□ The real evolution of VTT by mode and purpose between 1997 and 2009/2011
32
Detailed comparison for commute
33
Outcomes: impact of methodological
differences on 1997 or 2009/2011 VTT
1997 2009/2011 VTT
Estimation space
Interactions with
cost and time
Interactions with VTT 4%
Cost and time terms Linear Linear & non-linear 0%
Dependence of VTT
on travel time itself
No Yes 2%
Differs by
mode
Socio-economic
interaction factors
No education
Different set,
including education
+1%
Expansion
procedure
Weights per
segment
Sample enumeration +4%
Differs by
mode
Expansion totals OVG 1995 OViN 2010 0%
Differs by
mode
Type of model MNL panel latent class
34
Outcomes: impact of methodological
differences on 1997 or 2009/2011 VTT
1997 2009/2011 VTT
Estimation space
Interactions with
cost and time
Interactions with VTT 4%
Cost and time terms Linear Linear & non-linear 0%
Dependence of VTT
on travel time itself
No Yes 2%
Differs by
mode
Socio-economic
interaction factors
No education
Different set,
including education
+1%
Expansion
procedure
Weights per
segment
Sample enumeration +4%
Differs by
mode
Expansion totals OVG 1995 OViN 2010 0%
Differs by
mode
Type of model MNL panel latent class +31%
General
range:
20-40%
35
 Unobserved heterogeneity leads to a large downward bias in the VTT
Fair comparison 1997 – 2010 (no inflation
correction; comparison of p-LC models)
36
Car Train
Bus,
tram,
metro
All
surface
modes
Commute +13% +49% +9% +23%
Business +13% +60% +98% +26%
Other +71% +59% +52% +65%
Discussion of results of the comparison
 All VTTs by mode and purpose have increased
 Overall, the increase is slightly below the expected increase of +47%
□ small overall impact of ICT changes?
□ Income elasticity of 0.5 seems about right?
 Relatively small changes for commute and business: ICT developments
more important than for other travel?
 Relatively small increases for car (relative to train):
□ important ICT developments for train had already entered the market in 1997?
□ trains more crowded than in 1997?
37
What do we conclude?
 Beware of internet panels in VTT research!
 Allowing for unobserved heterogeneity (using a panel Latent Class model)
increases VTT considerably
□ Much more than the other six differences
 In the period 1997-2009/2011 the average VTT went up by about price
change plus 0.5 times the real income change
□ But differences between purposes and modes that could be related to ICT
developments
38
For more information
email: dejong@significance.nl or g.c.dejong@its.leeds.ac.uk
Final report and papers:
http://www.kimnet.nl/sites/kimnet.nl/files/filemanager/bijlagen/Bijlage_Value_of_t
ime_and_reliability_in_passenger_and_freight_transport_in_the_Netherlands_reprint.p
df
Kouwenhoven, M., G.C. de Jong, P. Koster, V.A.C. van den Berg, E.T. Verhoef, J.J.
Bates and P. Warffemius (2014) New values of time and reliability in passenger
transport in The Netherlands, Research in Transportation Economics, 47, 37-49.
Jong, G.C. de, M. Kouwenhoven, J. Bates, P. Koster, E. Verhoef. L. Tavasszy en P.
Warffemius (2014) New SP-values of time and reliability for freight transport in the
Netherlands, Transportation Research Part E, 64, 71-87.
39

The importance of Value of Time studies - a Dutch perspective

  • 1.
    The 2013 nationalDutch value of time study Gerard de Jong – Significance and ITS Leeds 29 October 2015
  • 2.
    The 2013 nationalDutch value of time study Gerard de Jong – Significance and ITS Leeds 29 October 2015 and reliability
  • 3.
    Contents 1. What’s thequestion? 2. Data collection: I. The 2009 SP data: internet panel II. The 2011 SP data: en-route recruitment 3. Model estimation 4. Impact of recruitment method 5. The recommended values 6. A fair comparison of the 1997 and 2009/2011 VTT 3
  • 4.
    Why do weneed a VTT?  In many countries, transport projects (e.g. new road or railway line) are evaluated ex ante using cost-benefit analysis (CBA)  In CBA project effects are expressed in money units  Costs include construction, maintenance and external cost  Main benefit often is travel time saved □ There could also be journey time reliability benefits (often still ignored)  This is in hours or minutes, so we need a conversion factor to money □ This factor is called the value of travel time VTT (e.g. in euros per hour) 4
  • 5.
    The context: CBAof transport projects Costs Benefits Construction costs Time benefits: Pt*Qt Pt: Value of travel time VTT Qt: from transport model Change in maintenance costs Reliability benefits: Pr*Qr Pr: Value of travel time variability VTTV Qr: forecasting model or surcharge Change in external costs Other transport cost savings From transport model … … … … 5
  • 6.
    The new nationalstudy  The objective of this project, for the Dutch Ministry of Infrastructure and the Environment, was: to provide values of time (update) and travel time reliability (first Dutch empirically-based values) for passenger and freight transport by mode that can be used in cost-benefit analysis (CBA) of transport projects  The project was completed and the report was officially released in June 2013) (weblink at the end); the values are now official: used in all national transport projects  In The Netherlands the VTT and VTTV are specifically for use in CBA, not for inputs into transport forecasting models  The Netherlands also had national VTT studies (passengers) in 1988-1990 and 1997-1998 6
  • 7.
    What’s the question? This presentation is about the passenger transport component of the study  Values of time (VTTS) in passenger transport nowadays mainly come from Stated Preference (SP) surveys (see international meta-analysis by Wardman et al., 2012)  Different interview methods: □ Mailback (pen and paper/cards) □ CAPI (used for freight transport) □ CATI □ Internet Recruitment method:  Project-specific recruitment (e.g. en-route)  From existing internet panel 7
  • 8.
    Initial choice ofinterview and recruitment method (2009 data)  The SP surveys required considerable customisation □ Mailback can only provide this through extensive two-step procedures  CAPI and CATI were considered too expensive for a large survey (labour cost)  Initial choice: internet survey using an existing internet panel 8
  • 9.
    2009 survey procedure(1)  5,760 members of an existing on-line panel were interviewed using computerised stated preference interviews in November 2009  Specific target numbers of interviews were set (and reached) for different segments: □ Transport mode used (car, train/metro, bus/tram, airplane and recreational navigation) □ Travel purpose (commuting, business, other) □ Time-of-day (peak, off-peak) □ Presence of transfers (public transport only)  All respondents were asked which modes they had used in the past three months, etc. □ This was used to allocate respondents to questionnaires for specific segments 9
  • 10.
    2009 survey procedure(2)  All respondents were drawn from the largest on-line panel of The Netherlands (240.000 participants)  The survey could be started by clicking on a weblink  The members received a reward for successfully completing the interview (equivalent to €1.50)  The interviews on average took 20 minutes 10
  • 11.
    Example of anSP choice screen (exp. 1) 11
  • 12.
    Example of anSP choice screen (exp. 2a) 12
  • 13.
    Initial results (2009data)  VOTs implausibly low □ About € 4 per hour for car and public transport □ Substantially lower than the official values (about € 9 per hour) and the international literature  Checked for possible explanations: □ socio-economic composition of sample □ travel time distribution of sample □ changes in the statistical design of the SP □ Including reliability in the SP □ Increased use of mobile phones, smartphones □ Impact of economic crisis □ Increase in congestion  These only explained part of the differences with the official values 13
  • 14.
    But there couldbe another explanation …  The sample of respondents obtained from this internet panel might be biased with respect to their value of time  Within each segment (socio-economic, trip purpose, trip length, mode), the respondents that participate in such an online panel (which takes time, for a rather low monetary reward) might have a lower VOT than a non-participant  This is a self-selection problem  Even after expansion, the resulting values of time would then be lower than the true values of time  To investigate this hypothesis, another data set was collected in the first half of 2011 14
  • 15.
    The 2011 SPdata: en-route recruitment  Almost 1500 respondents recruited at petrol stations, parking garages, train stations, bus stops, airports and ports  This is the same recruitment method as in earlier national value of time surveys of 1988/1990 and 1997/1998  Persons willing to participate were asked to answer an internet questionnaire on the intercepted trip: □ Almost identical to the questionnaire used in 2009 □ We only asked one additional question to determine whether they were a member of an internet panel (and whether this was “our” internet panel) 15
  • 16.
    2011 Models distinguishingmembers/non- members of internet panels  MNL models  Advanced MNL models that: □ yield a higher VTT for higher base time and cost levels, and □ smaller VTTs for smaller changes offered in time and cost  Advanced MNL with socio-economic interaction terms  Advanced MNL with socio-economic interaction terms plus latent VTT classes (LC model) 16
  • 17.
    Linear versus non-lineartime and cost effects in the utility function Utility function 1997: Utility function 2009/2011: 17
  • 18.
    4. Results forMNL model Mode Purpose Relative VTT for panel member (non-member=1) MNL Adv MNL Adv MNL + socio Latent class Car/train/BTM Commuting 0.61 Business 0.93 Other 0.90 Airplane All 1.07 Recr. navigation Other (0.96) 18
  • 19.
    4. Results forMNL models Mode Purpose Relative VTT for panel member (non-member=1) MNL Advanced MNL Car/train/BTM Commuting 0.61 0.80 Business 0.93 0.88 Other 0.90 0.93 Airplane All 1.07 0.82 Recr. navigation Other (0.96) (0.98) 19
  • 20.
    4. Results forMNL models Mode Purpose Relative VTT for panel member (non-member=1) MNL Advanced MNL Adv.MNL w. interaction Car/train/BTM Commuting 0.61 0.80 0.80 Business 0.93 0.88 0.87 Other 0.90 0.93 (1.01) Airplane All 1.07 0.82 0.82 Recr. navigation Other (0.96) (0.98) (0.98) 20
  • 21.
    4. Results forMNL and LC models Mode Purpose Relative VTT for panel member (non-member=1) MNL Advanced MNL Adv.MNL w. interaction Latent class Car/train/BTM Commuting 0.61 0.80 0.80 0.80 Business 0.93 0.88 0.87 (0.81) Other 0.90 0.93 (1.01) (0.89) Airplane All 1.07 0.82 0.82 0.82 Recr. navigation Other (0.96) (0.98) (0.98) (0.95) 21
  • 22.
    4. Results forpanel members 2009 and 2011 Mode Purpose Relative VTT for panel member (non-member=1) Advanced MNL 2009 (‘our’ panel) Advanced MNL 2011 (all panels) Car/train/BTM Commuting 0.64 0.80 Business 0.66 0.88 Other 0.74 0.93 Airplane All 0.70 0.82 Recr. navigation Other (1.06) (0.98) 22
  • 23.
    Discussion of results:does it matter/help? (1)  Especially for commuting (car, train, bus, tram, metro): significant lower values for panel members, □ even after correcting for the different distributions for the travel time and travel cost, and after inclusion of the socio-economic interactions  Similar findings for the business and for airplane segment  Other purposes and recreational navigation: no significant difference between panel and non-panel  We conclude that in the 2009 survey there was a bias towards low-VTT persons, who are willing to give up time to participate in an internet panel and to fill out web questionnaires for a rather small reward 23
  • 24.
    Discussion of results:does it matter/help? (2)  The resulting VTTs from the 2011 survey are much more in line with the values found in 1988/1990 and 1997/1998, □ which have always been regarded as very plausible by the various transport sectors, □ and are not considered to be particularly high in an international perspective  Our conclusion is that the most likely explanation is that the 2011 values are correct and that the 2009 values are biased downwards 24
  • 25.
    The final VTTresults are based on a combination of the 2009 and 2011 data  The base VTT and VTTV levels come from estimates on the 2011 data  Socio-economic interaction effects and the effect of the base time and cost levels as well as of changes in time and cost offered in the SP are estimated on 2009 and 2011  Also: latent class models used here, and expansion of the estimation results to the population (in hours travelled) using the 2010 national travel survey (OViN)  This yields the recommended values for use in CBA 25
  • 26.
    Recommended VTTs ineuros per person per hour 26 Car Train Bus, tram, metro All surface modes Air Recr. navigation Commute 9.25 11.50 7.75 9.75 Business employee 12.75 15.50 10.50 13.50 85.75 Business employer 13.50 4.25 8.50 10.50 - Business 26.25 19.75 19.00 24.00 85.75 Other 7.50 7.00 6.00 7.00 47.00 8.25 All purposes 9.00 9.25 6.75 8.75 51.75 8.25 Note: all values are rounded off to the nearest multiple of € 0.25
  • 27.
    Recommended reliability ratios Reliability ratio (RR) = value of standard deviation of travel time/VTT  Car, train, bus, tram and metro: □ Commuting 0.4 □ Business 1.1 □ Other 0.6  Air: □ Business 0.7 □ Other 0.7 27
  • 28.
  • 29.
    It’s just notfair! 29  Fair comparison: comparing like with like  Otherwise conclusions will be incorrect:  Not based on real differences but on differences in methodology
  • 30.
    The seven differences(methodological) 1997 2009/2011 Estimation space Interactions with cost and time Interactions with VTT Cost and time terms Linear Linear & non-linear Dependence of VTT on travel time itself No Yes Socio-economic interaction factors No education Different set, including education Expansion procedure Weights per segment Sample enumeration Expansion totals OVG 1995 OViN 2010 Type of model MNL panel latent class 30  Therefore the VTT in the 1998 report and the 2013 report cannot be compared
  • 31.
    Expected changes 1997-2010 Consumer prices rose by 32% -> VTT +32%  Real income (over and above the price change) went up by 30%. The Dutch guidelines adopted an income elasticity of the VTT of 0.5 -> VTT +15%  More congestion, more crowded trains, lower compensation of cost, crisis  New ICT has become much more common in this period: □ Mobiles (including handsfree, car kit), smartphones, iPads, laptops □ Easier to use travel time in a more productive/enjoyable way -> VTT   In the period 1988-1997 VTT did not change much: □ Gunn (2001): effect of real income growth more or less balanced by the technology effects 31
  • 32.
    Methodology to obtaina fair comparison  Applying the 1997 methods on the 2009/2011 data is not so interesting (no benefits from methodological improvements)  So we redid the analysis of the 1997 data using the 2009/2011 methods  We did this re-analysis step-by-step to see the impact of each of the seven differences (similar steps for the analysis of 2009/2011 data)  This gives two results: □ Which VTT would we have obtained in the nineties if we could had used modern methods (and future population data)? □ The real evolution of VTT by mode and purpose between 1997 and 2009/2011 32
  • 33.
  • 34.
    Outcomes: impact ofmethodological differences on 1997 or 2009/2011 VTT 1997 2009/2011 VTT Estimation space Interactions with cost and time Interactions with VTT 4% Cost and time terms Linear Linear & non-linear 0% Dependence of VTT on travel time itself No Yes 2% Differs by mode Socio-economic interaction factors No education Different set, including education +1% Expansion procedure Weights per segment Sample enumeration +4% Differs by mode Expansion totals OVG 1995 OViN 2010 0% Differs by mode Type of model MNL panel latent class 34
  • 35.
    Outcomes: impact ofmethodological differences on 1997 or 2009/2011 VTT 1997 2009/2011 VTT Estimation space Interactions with cost and time Interactions with VTT 4% Cost and time terms Linear Linear & non-linear 0% Dependence of VTT on travel time itself No Yes 2% Differs by mode Socio-economic interaction factors No education Different set, including education +1% Expansion procedure Weights per segment Sample enumeration +4% Differs by mode Expansion totals OVG 1995 OViN 2010 0% Differs by mode Type of model MNL panel latent class +31% General range: 20-40% 35  Unobserved heterogeneity leads to a large downward bias in the VTT
  • 36.
    Fair comparison 1997– 2010 (no inflation correction; comparison of p-LC models) 36 Car Train Bus, tram, metro All surface modes Commute +13% +49% +9% +23% Business +13% +60% +98% +26% Other +71% +59% +52% +65%
  • 37.
    Discussion of resultsof the comparison  All VTTs by mode and purpose have increased  Overall, the increase is slightly below the expected increase of +47% □ small overall impact of ICT changes? □ Income elasticity of 0.5 seems about right?  Relatively small changes for commute and business: ICT developments more important than for other travel?  Relatively small increases for car (relative to train): □ important ICT developments for train had already entered the market in 1997? □ trains more crowded than in 1997? 37
  • 38.
    What do weconclude?  Beware of internet panels in VTT research!  Allowing for unobserved heterogeneity (using a panel Latent Class model) increases VTT considerably □ Much more than the other six differences  In the period 1997-2009/2011 the average VTT went up by about price change plus 0.5 times the real income change □ But differences between purposes and modes that could be related to ICT developments 38
  • 39.
    For more information email:dejong@significance.nl or g.c.dejong@its.leeds.ac.uk Final report and papers: http://www.kimnet.nl/sites/kimnet.nl/files/filemanager/bijlagen/Bijlage_Value_of_t ime_and_reliability_in_passenger_and_freight_transport_in_the_Netherlands_reprint.p df Kouwenhoven, M., G.C. de Jong, P. Koster, V.A.C. van den Berg, E.T. Verhoef, J.J. Bates and P. Warffemius (2014) New values of time and reliability in passenger transport in The Netherlands, Research in Transportation Economics, 47, 37-49. Jong, G.C. de, M. Kouwenhoven, J. Bates, P. Koster, E. Verhoef. L. Tavasszy en P. Warffemius (2014) New SP-values of time and reliability for freight transport in the Netherlands, Transportation Research Part E, 64, 71-87. 39