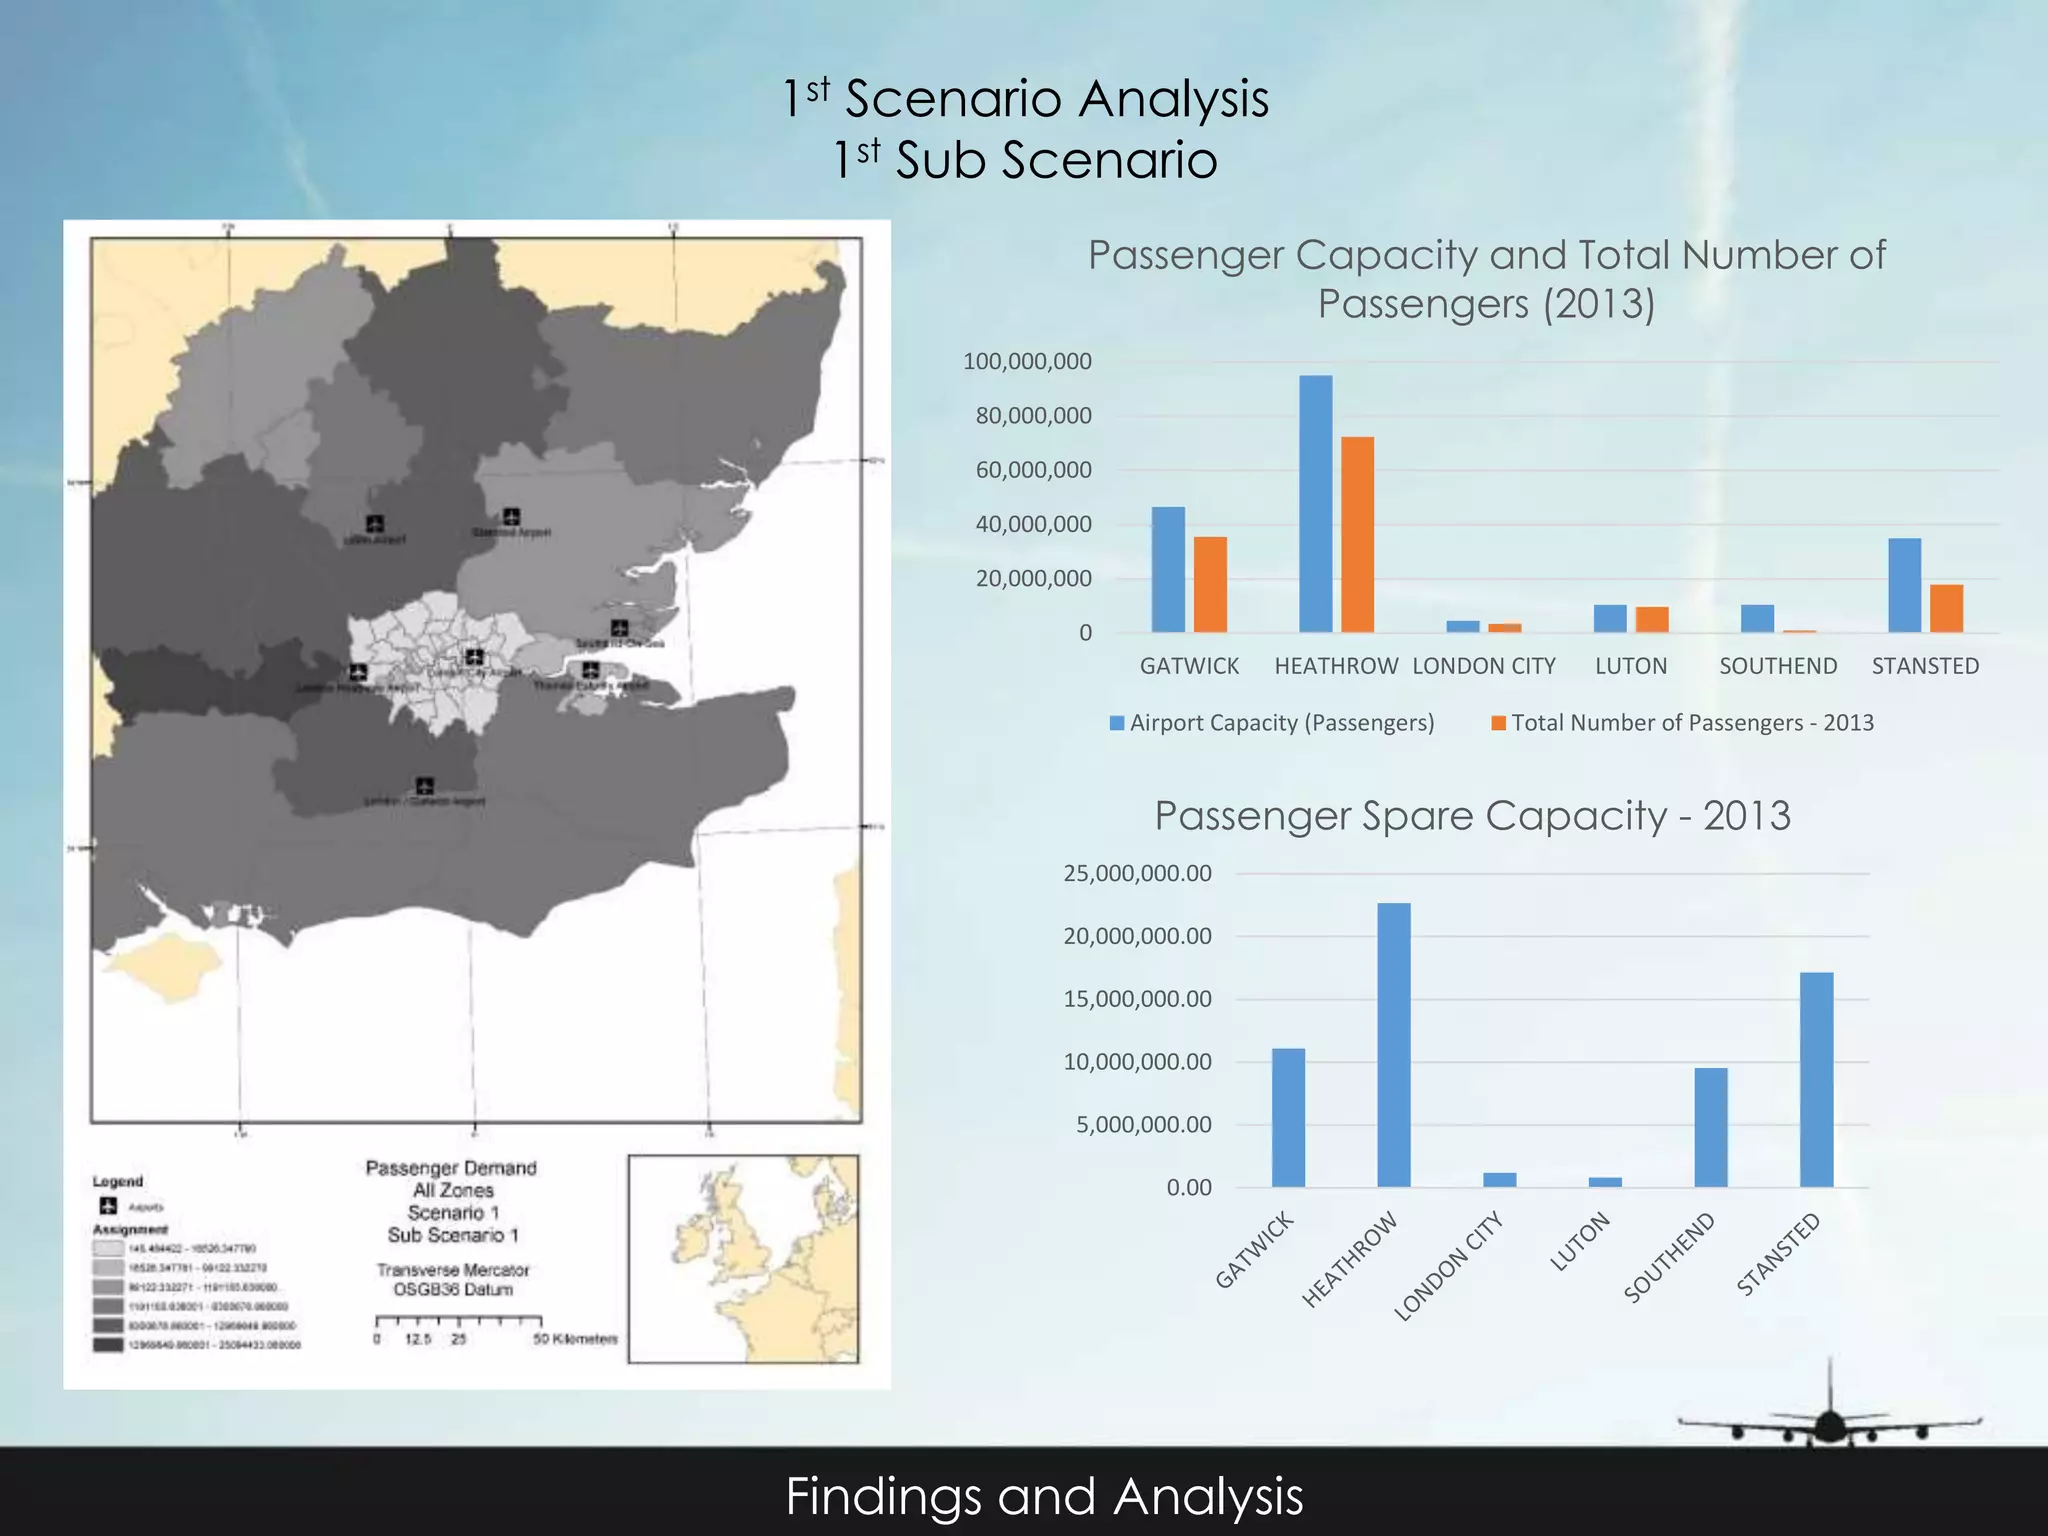
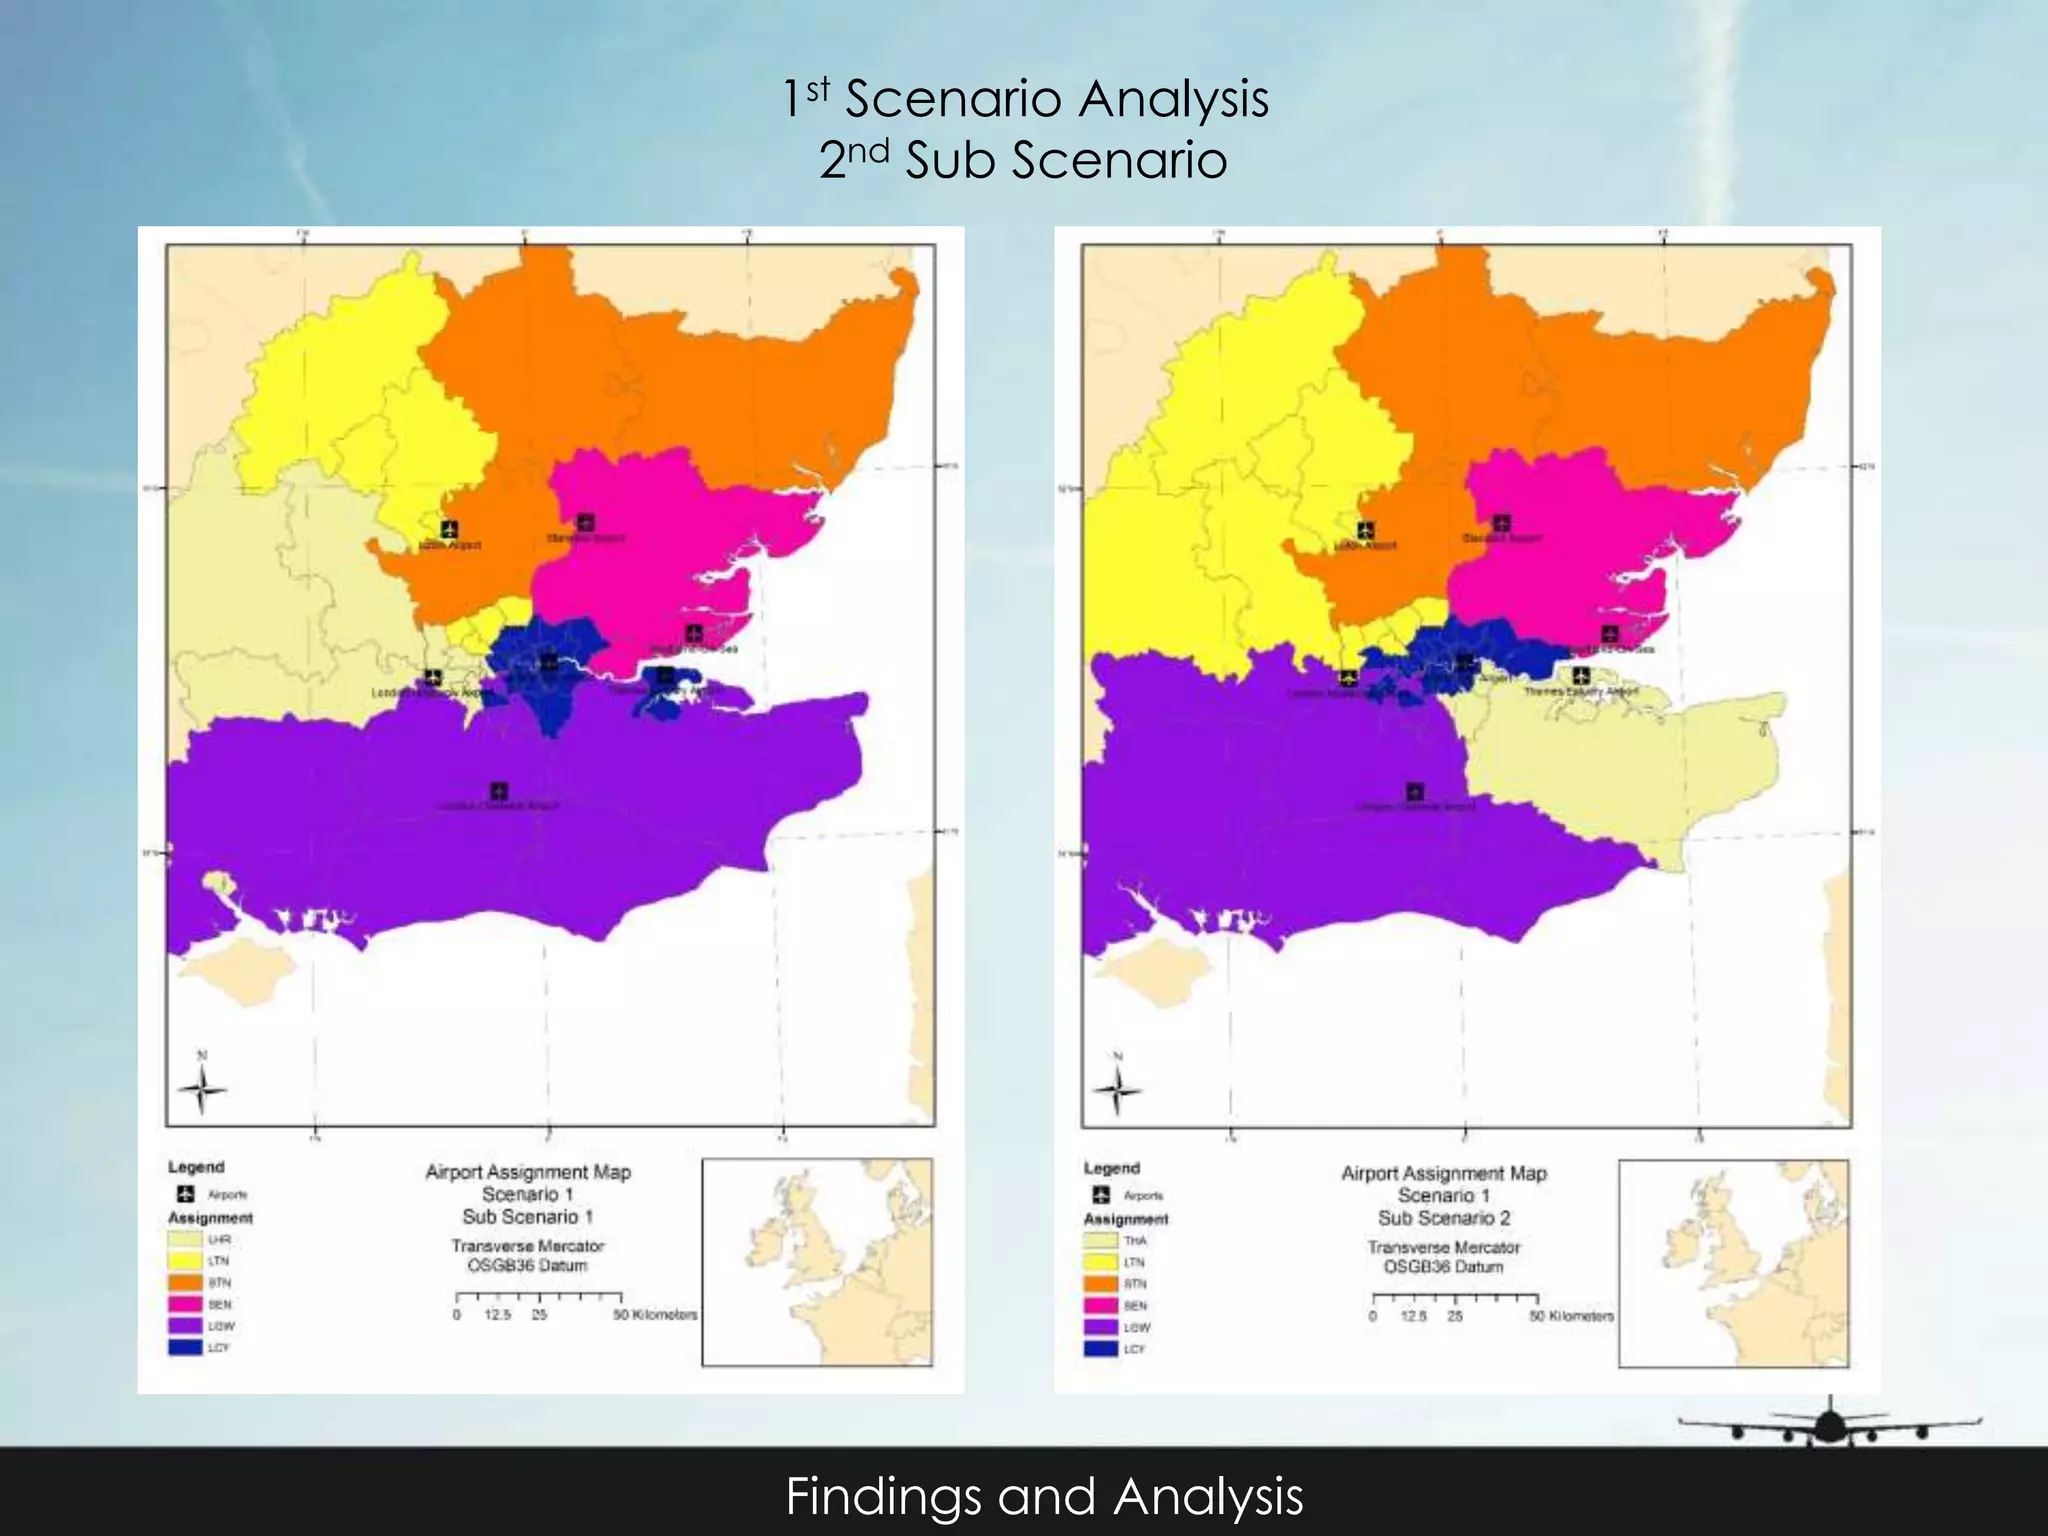
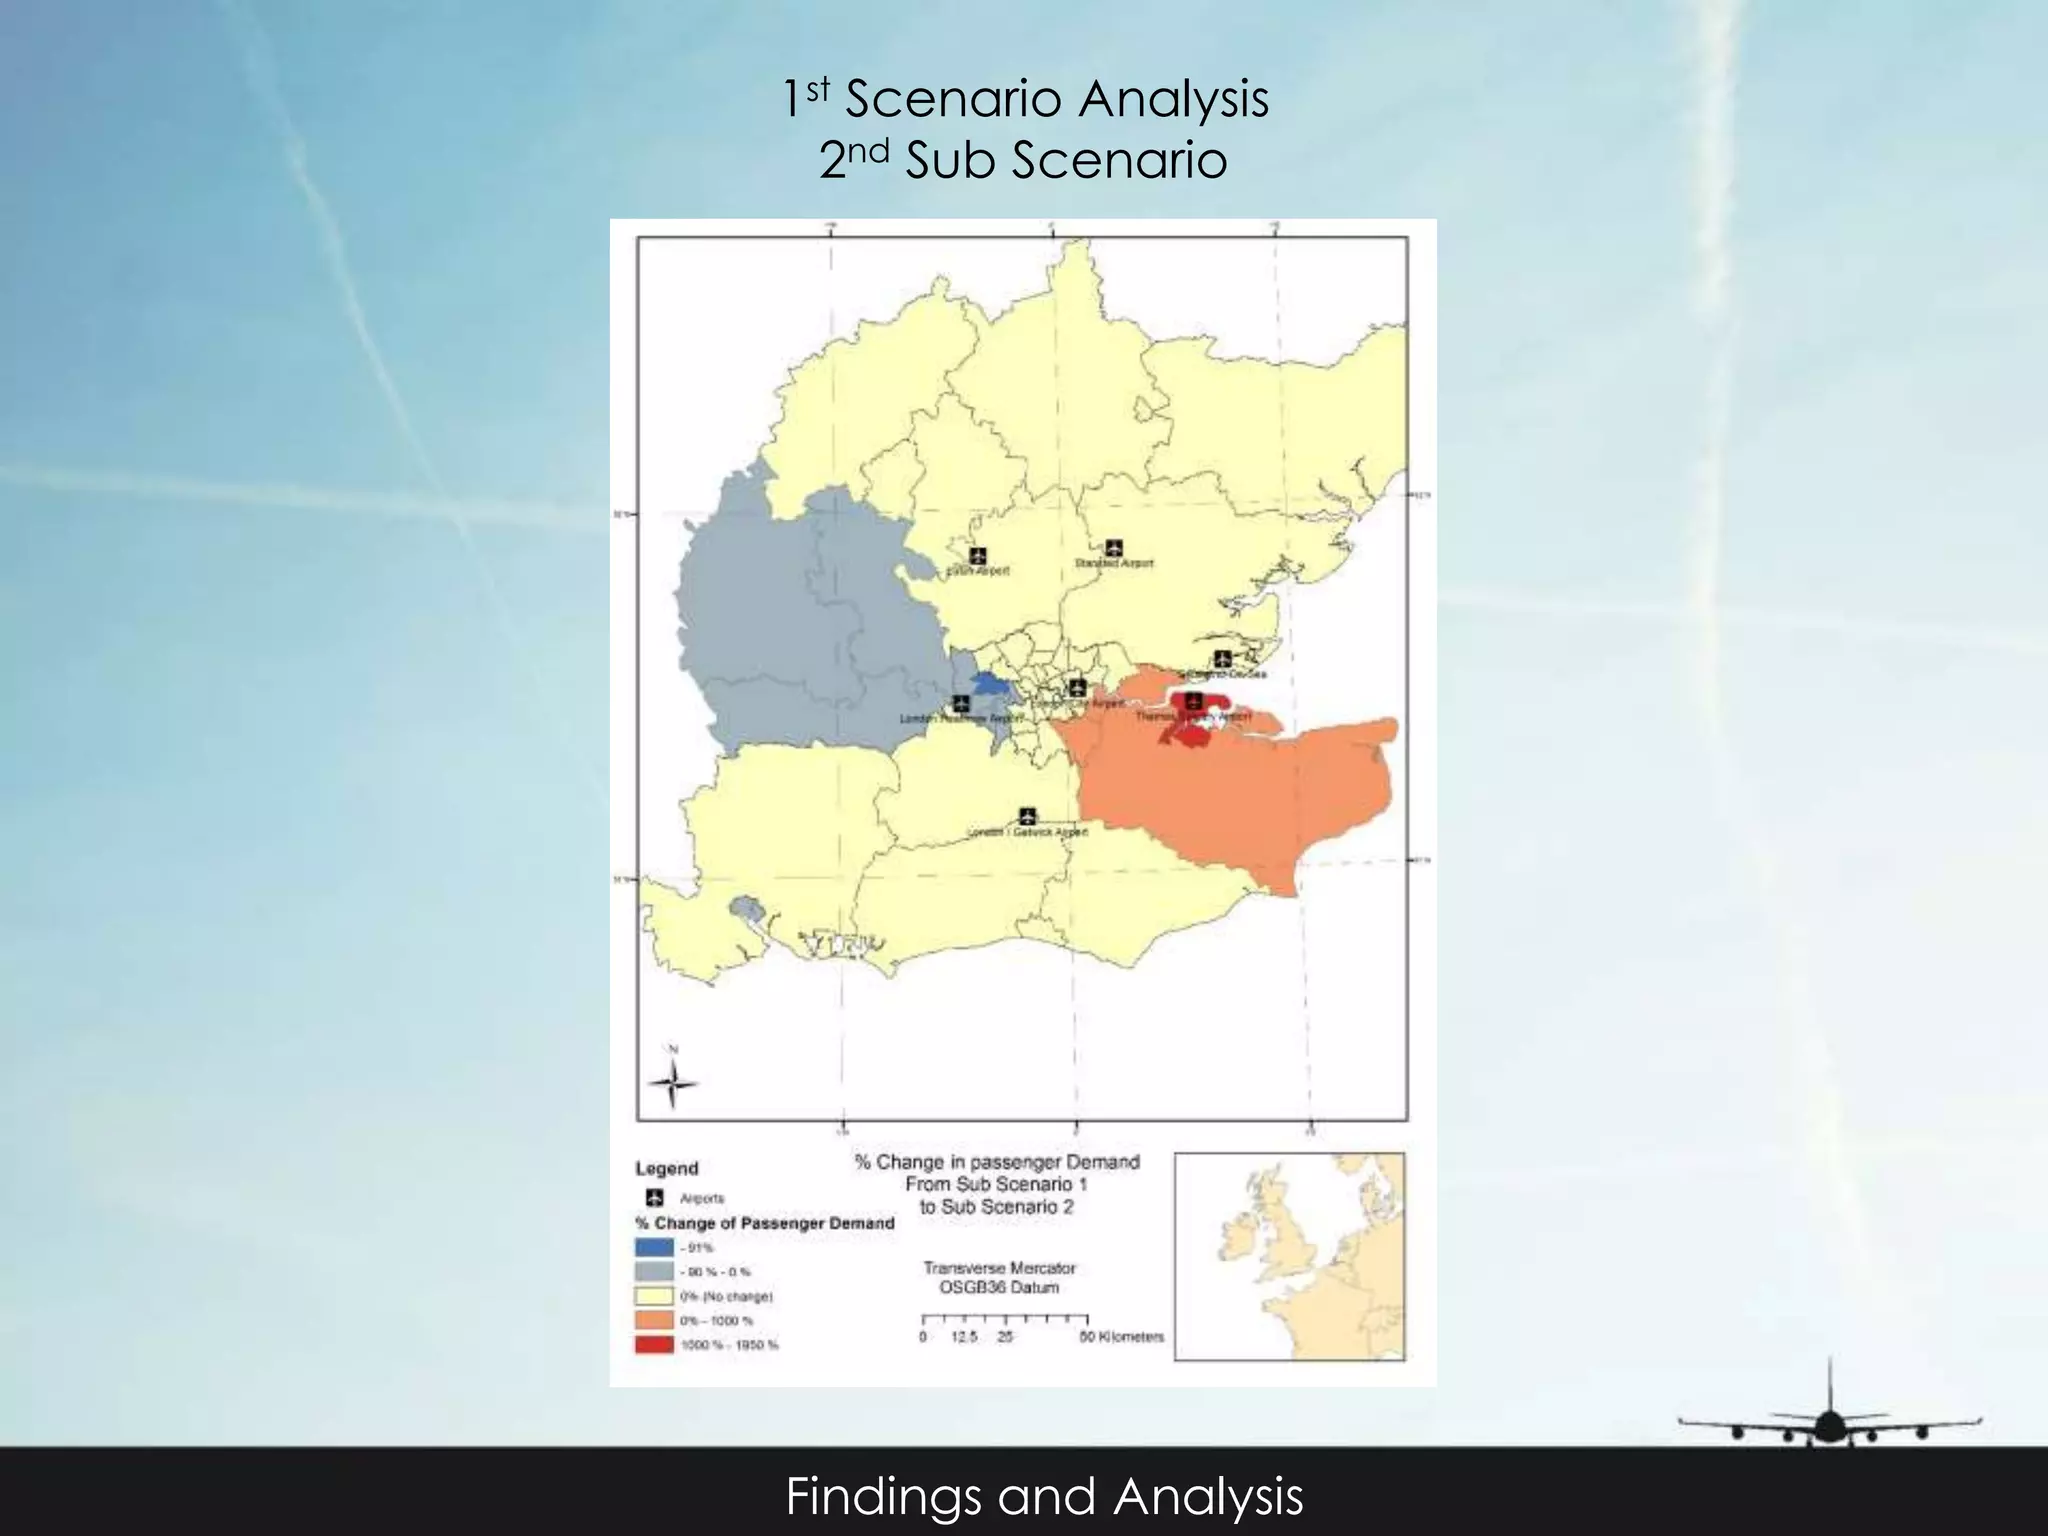
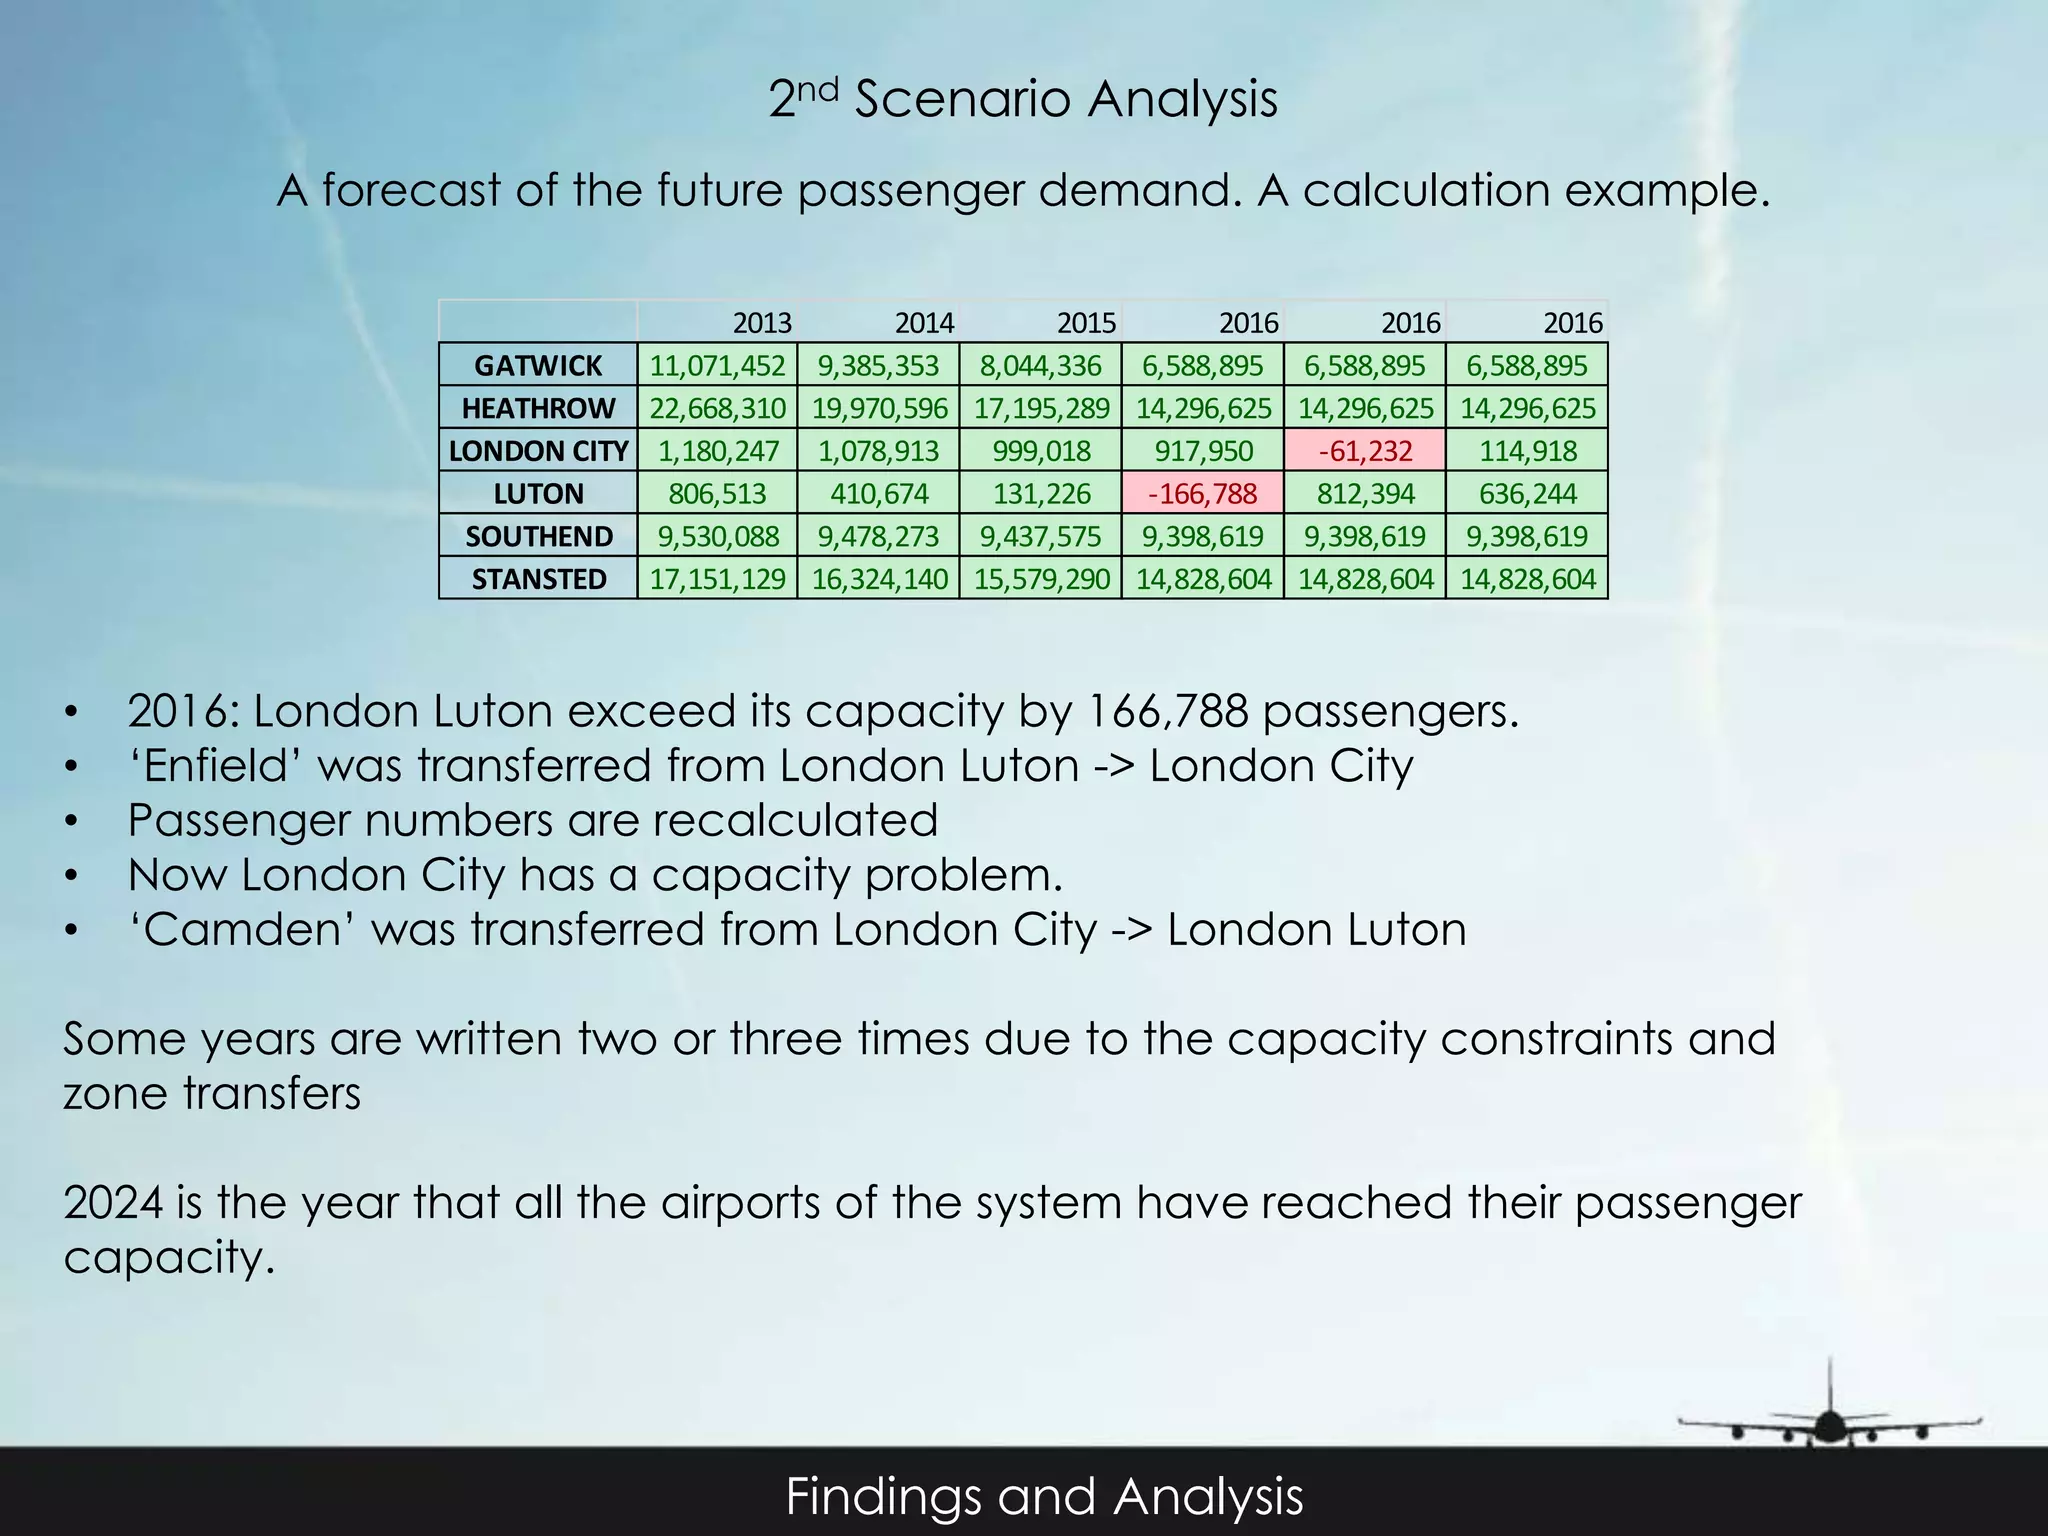
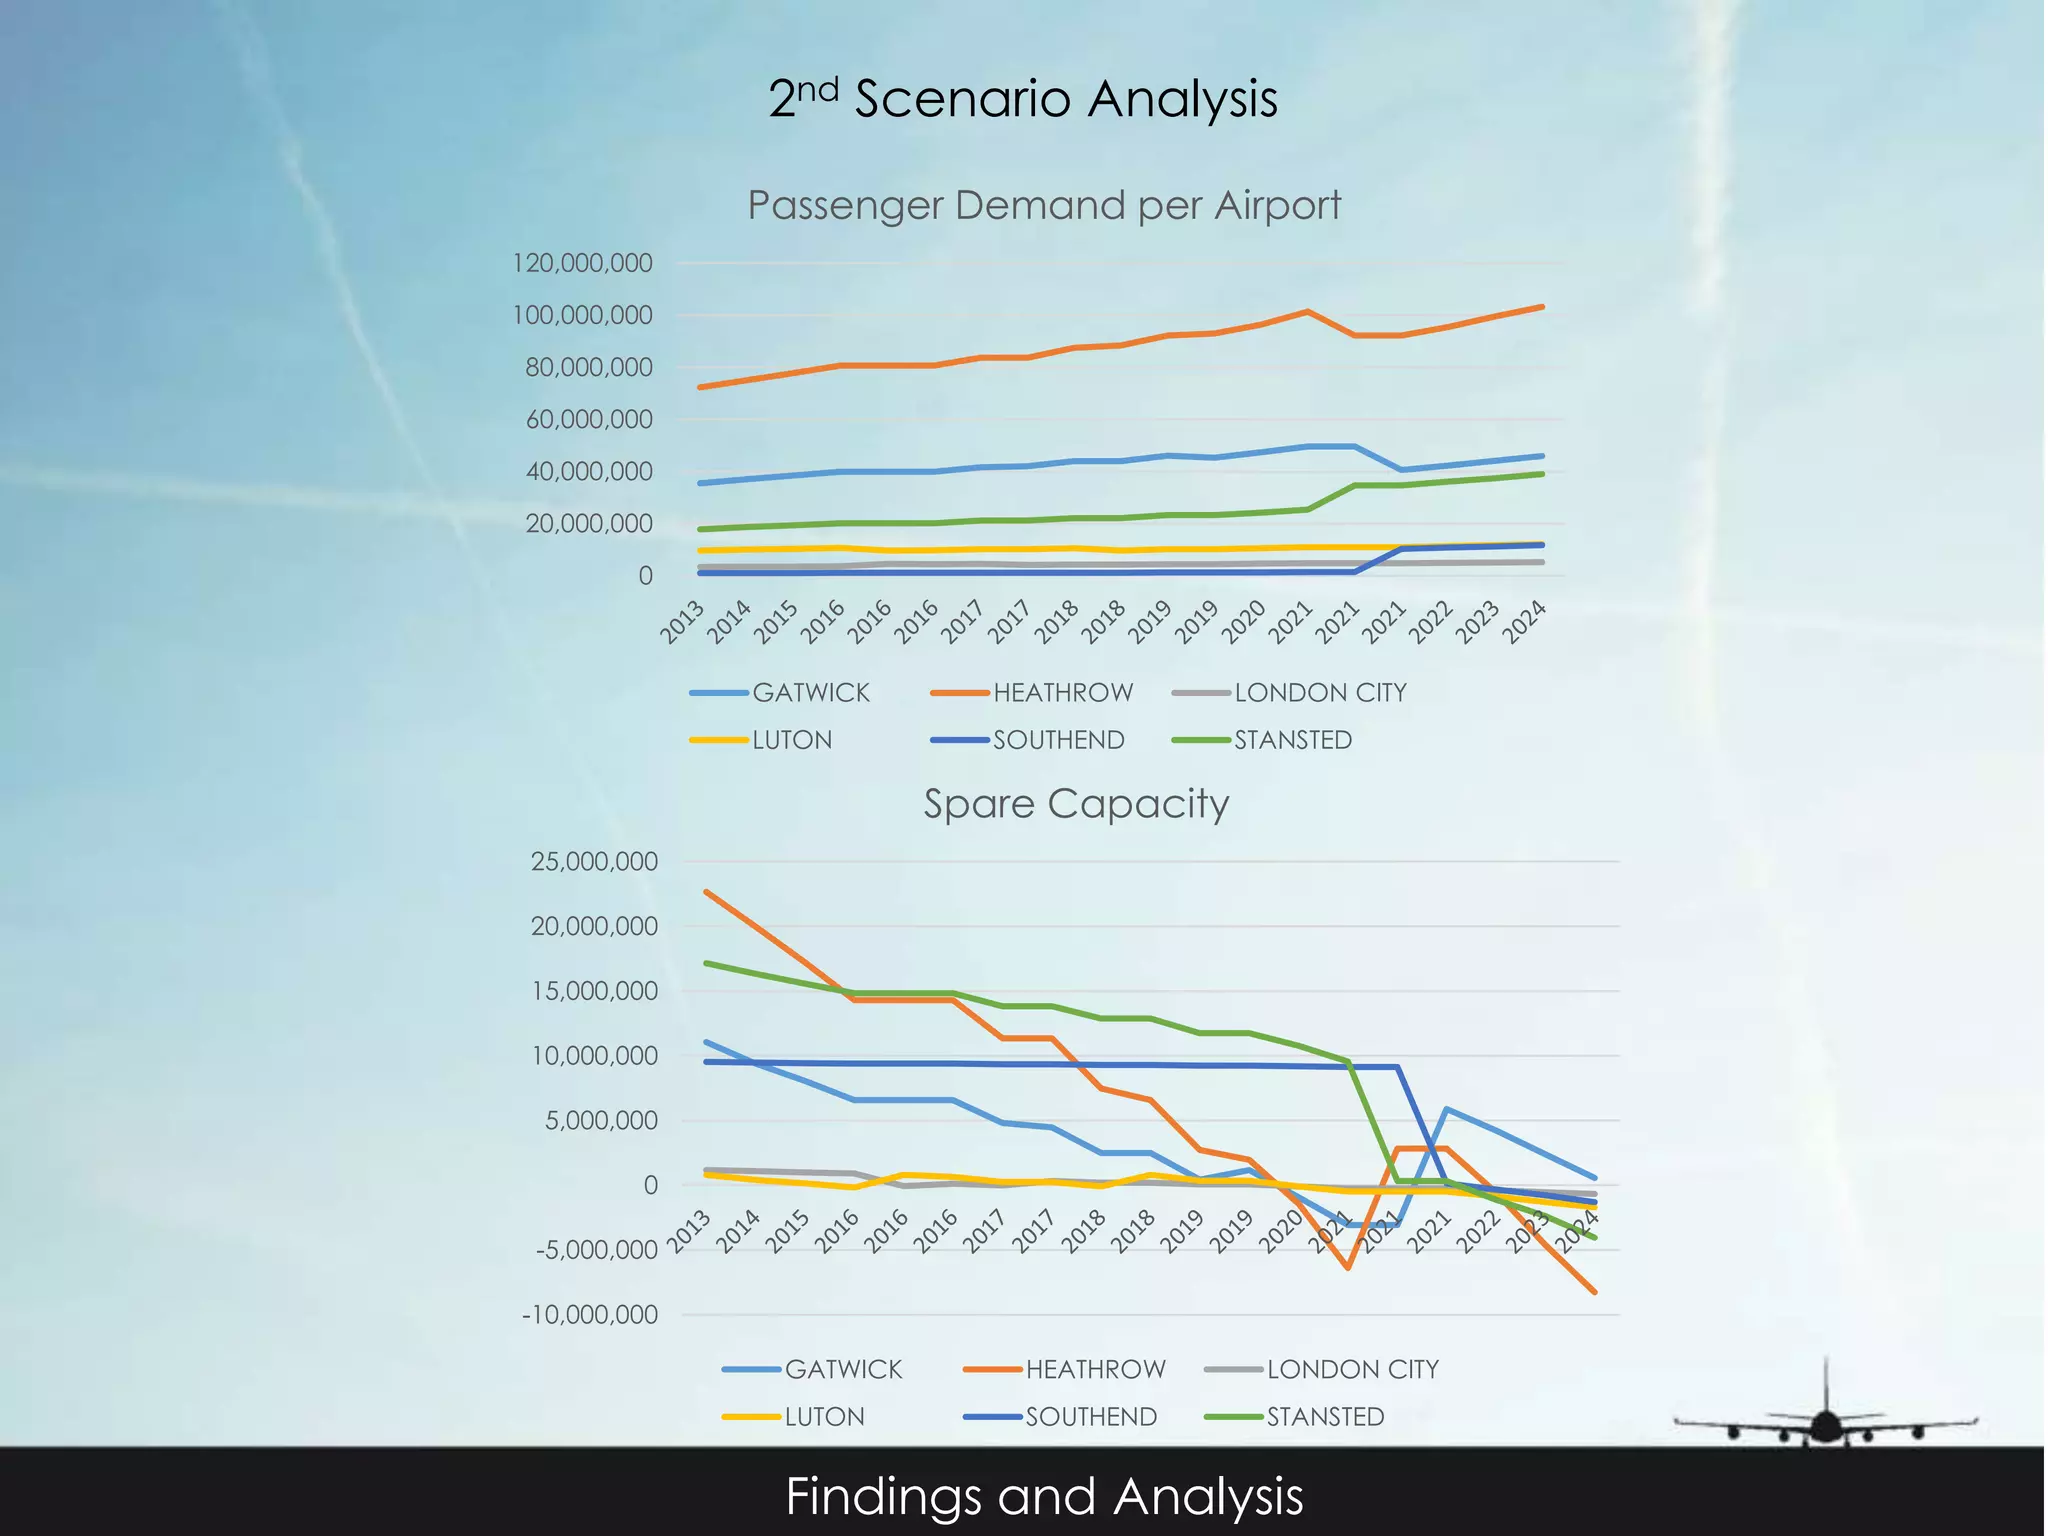
Contents 
Introduction 
Literature Review 
Methodology 
Scenario 1: Determination of passenger demand for each zone of the system 
Sub Scenario 1: Current situation – BAU 
Sub Scenario 2: Heathrow is closed. Thames Estuary Airport is in use. 
Scenario 2: A forecast of the future passenger demand 
Findings and Analysis 
Figures 
Maps 
Conclusions 
Contents
Aim and Objectives 
The main aim of this dissertation is to develop a strategic modelling tool to assess the 
provision of additional airport capacity in Britain. 
• Particular focus on London and South East 
• Using the Infrastructure Transitions Research Consortium’s Transport Demand 
and Capacity Assessment (ITRC) model 
Objectives 
• To review the work of the Airport Commission and the related literature 
• To review work on modelling the demand for and supply of airport infrastructure 
• To adapt the ITRC model so as to incorporate cross effects between airports 
Introduction
Making best use of existing capacity 
Literature Review 
Short term measures 
• Congestion charge scheme 
• Early morning smoothing 
Medium term measures 
• The introduction of mixed mode operations at Heathrow 
• The removal of planning restrictions on runway operations 
Long term measures 
London Heathrow London Gatwick
Demand modelling literature review 
Categories of passenger preference models: 
• the standard Nested Logit (NL) model 
• the Cross-Nested Logit (CNL) model 
• the multinomial logit (MNL) model 
• mixed multinomial logit (MMNL) model 
According to Hess and Polak the CNL models are more suitable for airport choice 
analysis and forecasting. 
• They allow the researchers to analyse the correlation between multiple choice 
parameters such as the access times, the type of the airport, the level of service 
and the frequency of the flights. 
In this study a Deterministic All-or-Nothing assignment has been used. 
Methodology
Description of the selected methodology 
• First Scenario: Determination of passenger demand for each zone of the system 
Sub Scenario 1: Current situation - BAU 
• The South-East region is divided into 55 zones 
• A centroid is defined in each zone (usually a Tube or Railway station) 
• Journey times from each centroid to each airport are calculated (road + rail) 
• Each zone is assigned to its nearest (in terms of journey time) airport 
• The attractiveness of each zone is calculated by an attraction model 
Methodology 
• Aij= (Pj/Fdij) * Pi 
Where: 
Aij: total attraction for each zone 
Pj: population of each zone 
Fdij: deterrence function (an expression of the generalised journey time) 
Pi: passengers per airport 
• The total attractiveness of each airport is calculated (the sum of the attractiveness 
of every zone in the catchment area of specific airport) 
• The final number of Passengers per zone is calculated using: 
• Passengers (Zone A) = Zone A Attractiveness / Total Airport Attractiveness 
Sub Scenario 2: Heathrow is closed. Thames Estuary Airport is in use. 
• Same methodology as with Sub Scenario 1, except: 
• PassZ1 NEW = PassZ1OLD * (Az1 NEW / AZ1 OLD)
Description of the selected methodology 
• Second Scenario: A forecast of the future passenger demand for the 6 airports and 
how excess demand affects the system 
• It uses the number of passengers that have been assigned to specific zones in the First 
Methodology 
Scenario/ Sub Scenario 1. 
• A formula is used in order to forecast future demand. 
• Pass NEW = Pass OLD * (Popt+1 / Popt)^np * (GVAt+1 / GVAt)^nGVA * (Fct+1 / Fct)^nF 
Popt+1 : is the population of the zone for the year t+1 
Popt : is the population of the zone for the year t 
np : is the population elasticity in respect of population growth 
GVAt+1 : is the GVA of the zone for the year t+1 
GVAt : is the GVA of the zone for the year t 
nGVA : is the GVA elasticity in respect of population growth 
Fct+1 : is the fuel cost for the year t+1 
Fct : is the fuel cost for the year t 
nFc : is the fuel cost elasticity in respect of population growth 
Pass OLD : is the previous number of passengers at the year t 
Pass NEW : is the new number of passengers at the year t+1 
• The overall passenger capacity of each airport is known. 
• If: Passenger Demand < Airport Passenger Capacity Then OK 
• If: Passenger Demand > Airport Passenger Capacity Then 
• The nearest zone that belongs to the congested airport is transferred to the catchment area 
of the nearest uncongested airport. 
• The procedure is repeated until all airports of the system reach their capacity.
1st Scenario Analysis 
1st Sub Scenario 
Findings and Analysis
1st Scenario Analysis 
1st Sub Scenario 
Passenger Capacity and Total Number of 
100,000,000 
80,000,000 
60,000,000 
40,000,000 
20,000,000 
0 
GATWICK HEATHROW LONDON CITY LUTON SOUTHEND STANSTED 
Passenger Spare Capacity - 2013 
25,000,000.00 
20,000,000.00 
15,000,000.00 
10,000,000.00 
5,000,000.00 
Findings and Analysis 
Passengers (2013) 
Airport Capacity (Passengers) Total Number of Passengers - 2013 
0.00
1st Scenario Analysis 
2nd Sub Scenario 
Findings and Analysis
1st Scenario Analysis 
2nd Sub Scenario 
Findings and Analysis
2nd Scenario Analysis 
A forecast of the future passenger demand. A calculation example. 
2013 2014 2015 2016 2016 2016 
GATWICK 11,071,452 9,385,353 8,044,336 6,588,895 6,588,895 6,588,895 
HEATHROW 22,668,310 19,970,596 17,195,289 14,296,625 14,296,625 14,296,625 
LONDON CITY 1,180,247 1,078,913 999,018 917,950 -61,232 114,918 
LUTON 806,513 410,674 131,226 -166,788 812,394 636,244 
SOUTHEND 9,530,088 9,478,273 9,437,575 9,398,619 9,398,619 9,398,619 
STANSTED 17,151,129 16,324,140 15,579,290 14,828,604 14,828,604 14,828,604 
• 2016: London Luton exceed its capacity by 166,788 passengers. 
• ‘Enfield’ was transferred from London Luton -> London City 
• Passenger numbers are recalculated 
• Now London City has a capacity problem. 
• ‘Camden’ was transferred from London City -> London Luton 
Some years are written two or three times due to the capacity constraints and 
zone transfers 
2024 is the year that all the airports of the system have reached their passenger 
capacity. 
Findings and Analysis
2nd Scenario Analysis 
Findings and Analysis 
120,000,000 
100,000,000 
80,000,000 
60,000,000 
40,000,000 
20,000,000 
0 
Passenger Demand per Airport 
GATWICK HEATHROW LONDON CITY 
LUTON SOUTHEND STANSTED 
25,000,000 
20,000,000 
15,000,000 
10,000,000 
5,000,000 
0 
-5,000,000 
-10,000,000 
Spare Capacity 
GATWICK HEATHROW LONDON CITY 
LUTON SOUTHEND STANSTED
Modelling Conclusions 
• Secondary data were used in all modelling calculations. A better approach 
includes the usage of primary data from passenger preference surveys. 
• GVA, Fuel prices and Population show an upward trend in the future. 
First Scenario 
First Sub Scenario 
• The west zones have the greatest demand per zone. 
Second Sub Scenario 
• Compared with the First Sub Scenario: 
• More passenger demand in the East zones and less in the West zones. 
• There is an overall passenger demand reduction of 23% 
Second Scenario 
• The system is running normally up to 2015. 
• The first overcapacity problems start in 2016. 
• In 2021 London City and London Luton are practically full. 
• The whole system is considered full in 2024. 
Conclusions
Thank you for your attention. 
Questions?

Airport Capacity and the case of a new London Airport

  • 2.
    Contents Introduction LiteratureReview Methodology Scenario 1: Determination of passenger demand for each zone of the system Sub Scenario 1: Current situation – BAU Sub Scenario 2: Heathrow is closed. Thames Estuary Airport is in use. Scenario 2: A forecast of the future passenger demand Findings and Analysis Figures Maps Conclusions Contents
  • 3.
    Aim and Objectives The main aim of this dissertation is to develop a strategic modelling tool to assess the provision of additional airport capacity in Britain. • Particular focus on London and South East • Using the Infrastructure Transitions Research Consortium’s Transport Demand and Capacity Assessment (ITRC) model Objectives • To review the work of the Airport Commission and the related literature • To review work on modelling the demand for and supply of airport infrastructure • To adapt the ITRC model so as to incorporate cross effects between airports Introduction
  • 4.
    Making best useof existing capacity Literature Review Short term measures • Congestion charge scheme • Early morning smoothing Medium term measures • The introduction of mixed mode operations at Heathrow • The removal of planning restrictions on runway operations Long term measures London Heathrow London Gatwick
  • 5.
    Demand modelling literaturereview Categories of passenger preference models: • the standard Nested Logit (NL) model • the Cross-Nested Logit (CNL) model • the multinomial logit (MNL) model • mixed multinomial logit (MMNL) model According to Hess and Polak the CNL models are more suitable for airport choice analysis and forecasting. • They allow the researchers to analyse the correlation between multiple choice parameters such as the access times, the type of the airport, the level of service and the frequency of the flights. In this study a Deterministic All-or-Nothing assignment has been used. Methodology
  • 6.
    Description of theselected methodology • First Scenario: Determination of passenger demand for each zone of the system Sub Scenario 1: Current situation - BAU • The South-East region is divided into 55 zones • A centroid is defined in each zone (usually a Tube or Railway station) • Journey times from each centroid to each airport are calculated (road + rail) • Each zone is assigned to its nearest (in terms of journey time) airport • The attractiveness of each zone is calculated by an attraction model Methodology • Aij= (Pj/Fdij) * Pi Where: Aij: total attraction for each zone Pj: population of each zone Fdij: deterrence function (an expression of the generalised journey time) Pi: passengers per airport • The total attractiveness of each airport is calculated (the sum of the attractiveness of every zone in the catchment area of specific airport) • The final number of Passengers per zone is calculated using: • Passengers (Zone A) = Zone A Attractiveness / Total Airport Attractiveness Sub Scenario 2: Heathrow is closed. Thames Estuary Airport is in use. • Same methodology as with Sub Scenario 1, except: • PassZ1 NEW = PassZ1OLD * (Az1 NEW / AZ1 OLD)
  • 7.
    Description of theselected methodology • Second Scenario: A forecast of the future passenger demand for the 6 airports and how excess demand affects the system • It uses the number of passengers that have been assigned to specific zones in the First Methodology Scenario/ Sub Scenario 1. • A formula is used in order to forecast future demand. • Pass NEW = Pass OLD * (Popt+1 / Popt)^np * (GVAt+1 / GVAt)^nGVA * (Fct+1 / Fct)^nF Popt+1 : is the population of the zone for the year t+1 Popt : is the population of the zone for the year t np : is the population elasticity in respect of population growth GVAt+1 : is the GVA of the zone for the year t+1 GVAt : is the GVA of the zone for the year t nGVA : is the GVA elasticity in respect of population growth Fct+1 : is the fuel cost for the year t+1 Fct : is the fuel cost for the year t nFc : is the fuel cost elasticity in respect of population growth Pass OLD : is the previous number of passengers at the year t Pass NEW : is the new number of passengers at the year t+1 • The overall passenger capacity of each airport is known. • If: Passenger Demand < Airport Passenger Capacity Then OK • If: Passenger Demand > Airport Passenger Capacity Then • The nearest zone that belongs to the congested airport is transferred to the catchment area of the nearest uncongested airport. • The procedure is repeated until all airports of the system reach their capacity.
  • 8.
    1st Scenario Analysis 1st Sub Scenario Findings and Analysis
  • 9.
    1st Scenario Analysis 1st Sub Scenario Passenger Capacity and Total Number of 100,000,000 80,000,000 60,000,000 40,000,000 20,000,000 0 GATWICK HEATHROW LONDON CITY LUTON SOUTHEND STANSTED Passenger Spare Capacity - 2013 25,000,000.00 20,000,000.00 15,000,000.00 10,000,000.00 5,000,000.00 Findings and Analysis Passengers (2013) Airport Capacity (Passengers) Total Number of Passengers - 2013 0.00
  • 10.
    1st Scenario Analysis 2nd Sub Scenario Findings and Analysis
  • 11.
    1st Scenario Analysis 2nd Sub Scenario Findings and Analysis
  • 12.
    2nd Scenario Analysis A forecast of the future passenger demand. A calculation example. 2013 2014 2015 2016 2016 2016 GATWICK 11,071,452 9,385,353 8,044,336 6,588,895 6,588,895 6,588,895 HEATHROW 22,668,310 19,970,596 17,195,289 14,296,625 14,296,625 14,296,625 LONDON CITY 1,180,247 1,078,913 999,018 917,950 -61,232 114,918 LUTON 806,513 410,674 131,226 -166,788 812,394 636,244 SOUTHEND 9,530,088 9,478,273 9,437,575 9,398,619 9,398,619 9,398,619 STANSTED 17,151,129 16,324,140 15,579,290 14,828,604 14,828,604 14,828,604 • 2016: London Luton exceed its capacity by 166,788 passengers. • ‘Enfield’ was transferred from London Luton -> London City • Passenger numbers are recalculated • Now London City has a capacity problem. • ‘Camden’ was transferred from London City -> London Luton Some years are written two or three times due to the capacity constraints and zone transfers 2024 is the year that all the airports of the system have reached their passenger capacity. Findings and Analysis
  • 13.
    2nd Scenario Analysis Findings and Analysis 120,000,000 100,000,000 80,000,000 60,000,000 40,000,000 20,000,000 0 Passenger Demand per Airport GATWICK HEATHROW LONDON CITY LUTON SOUTHEND STANSTED 25,000,000 20,000,000 15,000,000 10,000,000 5,000,000 0 -5,000,000 -10,000,000 Spare Capacity GATWICK HEATHROW LONDON CITY LUTON SOUTHEND STANSTED
  • 14.
    Modelling Conclusions •Secondary data were used in all modelling calculations. A better approach includes the usage of primary data from passenger preference surveys. • GVA, Fuel prices and Population show an upward trend in the future. First Scenario First Sub Scenario • The west zones have the greatest demand per zone. Second Sub Scenario • Compared with the First Sub Scenario: • More passenger demand in the East zones and less in the West zones. • There is an overall passenger demand reduction of 23% Second Scenario • The system is running normally up to 2015. • The first overcapacity problems start in 2016. • In 2021 London City and London Luton are practically full. • The whole system is considered full in 2024. Conclusions
  • 15.
    Thank you foryour attention. Questions?

Editor's Notes

  • #5 The Airports Commission will examine the cases of: London Heathrow London Gatwick London Heathrow: Two new main passenger terminals, connected by underground passenger transit and baggage system Reduction of the connection time between terminals from 75 to 60 minutes Doubling the cargo handling capacity London Gatwick: 3 different proposals, the distance between the runways varies + Different capacity for every solution
  • #6 Models: the MMNL have one major disadvantage. In order to use an MMNL model one has to calculate the choice probabilities. That was not possible in my example.
  • #7 Journey times: Road (AA trip planner), Rail (Network Rail journey planner) Sub Scenario 2: elasticity of demand with respect to accessibility equals Number of Passengers for each airport were extracted from the Civil Aviation Authority website
  • #8 GVA, Fc, Population, Airport Passenger Capacity and the elasticities came from the ITRC model the airport assignment to specific zones follows the same rule as in scenario one This is a simplified deterministic all-or-nothing assignment. In reality each zone can feed many airports with passengers.
  • #9 The first scenario is analysing the current situation without moving on to any forecast calculations The aim of the first sub scenario is the calculation of passenger demand from each zone of the system to every airport of the system. Gatwick: southern zones are mostly favoured and show lower access times. Brighton + Bedford (Thameslink Railway) Accessibility maps were produced for all 6 airports of the system Assignment: Every zone was assigned to its nearest airport. Gatwick prevails in the south Heathrow at the West London City has the biggest portion of London zones
  • #10  The west zones are showing the greatest demand per zone (population, proximity to big airports and good transport links) Berkshire is generating the biggest amount of demand per zone in the system due to its proximity to Heathrow and its big population. Medway is not well connected to an airport and it has a relatively small population therefore it is producing low levels of passenger demand. It is also clear that central London has lower demand per zone compared to the areas outside London, due to the difference of zone population. ------------------------------------ Passenger capacity and not runway capacity. Passenger capacity is mainly defined by how many passengers an airport can handle in its terminals. Heathrow has the biggest passenger spare capacity. Stansted follows. Interesting that Gatwick=Southend
  • #11 Heathrow is considered closed Thames Estuary airport is operational in the Isle of Dogs. the absence of Heathrow Airport has changed the situation at the West zones of the system Oxfordshire and Buckinghamshire (Heathrow) -> (Luton) Berkshire + West London Zones (Heathrow) -> (Gatwick) The Thames Estuary airport took Kent from London Gatwick and some east London zones from London City.
  • #12 One of the bigger changes has happened to the county of Kent. Overall trend: reduction in passenger demand at the west zones and an increase of passenger demand at the east and south zones. Many zones does not Overall passenger demand is decreased by -23%
  • #14 London City and London Luton are operating very close to their capacity for almost all the examined time period. Big change: After 2021, when the only two uncongested airports (London Stansted and Southend) are also reaching their capacity. After 2024 the whole system becomes heavily congested and there is no spare capacity in any of London’s airports. Despite the existence of the uncongested airports like Stansted and Southend, their capacity can only provide a few more years of operation to the other heavy congested airports.