Downloaded 223 times
![1985 1986 1987 1988 1989 1990 1991 1992 1993 1994 1995 1996 1997 1998 1999 2000 2001 2002 2003 2004 2005 2006 2007 2008 2009 2010 2011 2012 2013 2014 2015 … 2030
Background
• China’s first car was made in 1956 and the
first private car was made in early 1980;
• In 1994, the government started to
encourage people to buy private cars;
• Nowadays the car ownership in China has
reached 290 million With the growth of
27.5 million cars and 33.1 million drivers in
2016 (Xinhua news agency 2017);
• Traffic congestion and environment
problems have been more serious;
• More traffic policies are carried out to
restrict the amount of cars since 2008;
Private Car ownership analysis in several cities in China
Shijun Cheng, M.Sc. Transport Planning & Engineering Supervisor: Zia Wadud Institute of Transport Study
(Traffic congestion in Beijing)
Source: http://chuansong.me/n/981272952969
The proposed scope
• Taking Beijing ,Shanghai ,Tianjin,
Guangzhou and Hangzhou as the examples;
• The time series are divided into three parts:
“1985 - 2008”, “2008 - 2015”, “2015 -
2030”;
• Choose GDP per capita (RMB), population
data (1,000 people) and fuel price (RMB)
as the main valuable factors.
The proposed methodology
• Econometric model:
ln 𝐶𝑡 = 𝐾 +
𝑖=1
𝑚
𝛼𝑖 ln 𝐶𝑡−𝑖 +
𝑗=0
𝑛
𝛽𝑗 ln 𝐺𝐷𝑃𝑡−𝑗
+ 𝑘=0
𝑜
𝛾 𝑘 ln 𝑃𝑡−𝑘 𝑙=0
𝑝
δ𝑙 ln 𝐹𝑡−𝑙 + 𝜀𝑡;
• For the eq., C is the number of vehicles,
GDP is real GDP per capita ,P is population
and F is fuel price, 𝜀𝑡 is the error of the
econometric model, m n o p will be
chosen to fit the error 𝜀𝑡 and α, β, γ, δ, k
are the estimated parameters;
• Intervention analysis will be used in time
series econometrics to estimate the impact
of traffic polices.
Expected conclusions
• GDP per capita and population could be the
main variables of the car ownership model;
• After carrying out traffic policies,
comparing with the actual data, the growth
of the car ownership starts to slow down;
• The growth of the predictive results should
be more slowly.
Aims and Objectives
• By analysing the previous car ownership
data from to get estimated results;
• To find the differences between the actual
data and estimated results;
• Whether the traffic policies have positive
impacts on the restraint of car numbers?
• What is the predicted value of car ownership
in the future (2030)?
Private car ownership in China (per 1000)
GDP
(Population)
(Grass Domestic
Product) per capita
References
Bhat, C.R. and Sen, S. 2006. Transportation Research Part B: Methodological. Household Vehicle Type Holdings and Usage: An Application of the Multiple Discrete-
Continuous Extreme Value (MDCEV) Model. [Online]. 40(1).pp 35-53. [Available from]:
http://www.sciencedirect.com/science/article/pii/S0191261505000093
Dargay, J. et al. 2007. Science Direct: Transportation Research Part A. The effect of prices and income on car travel in the UK. [Online]. 2017(4).pp 949-960. [Available
from]:
http://www.sciencedirect.com/science/article/pii/S0965856407000419
Deng, X. 2007. Private Car Ownership in China: How Important is the effect of Income? [Online]. [Available from]:
https://www.researchgate.net/publication/241654202_Private_Car_Ownership_in_China_How_Important_is_the_effect_of_Income
Huang, X. 2011. Michigan Tech: Dissertations, Master's Theses and Master's Reports. Car ownership modeling and forecasts for China. [Online]. [Available from]:
http://digitalcommons.mtu.edu/etds/444/
Li, J. et al. 2010. Modelling Private Car Ownership in China: Investigation of Urban Form Impact across Megacities. [Online]. [Available from]:
https://trid.trb.org/view.aspx?id=909830
Wadud, Z. 2012. Transportation Research Part A. Transport impacts of an energy-environment policy: The case of CNG conversion of vehicles in Dhaka. [Online].
[Available from]:
www.sciencedirect.com/science/article/pii/S0965856414001128
Wu, T. 2014. Sustainability. Vehicle Ownership Analysis Based on GDP per Capita in China: 1963–2050. [Online]. 2014(6).pp 4877-4899. [Available from]:
https://www.researchgate.net/publication/277673929_Vehicle_Ownership_Analysis_Based_on_GDP_per_Capita_in_China_1963-2050
Xinhua News Agency. 2017. The car ownership in China.[Online].[Accessed 17 April]. Available from : http://www.gov.cn/shuju/2017-01/11/content_5158647.htm
Traffic policies have been taken in 2008
Where will it go in the future?
Fuel price per liter
(¥)](https://image.slidesharecdn.com/mastersdissertationposters2017-170517094532/85/Masters-Dissertation-Posters-2017-1-320.jpg)
![1985 1986 1987 1988 1989 1990 1991 1992 1993 1994 1995 1996 1997 1998 1999 2000 2001 2002 2003 2004 2005 2006 2007 2008 2009 2010 2011 2012 2013 2014 2015 … 2030
Background
• China’s first car was made in 1956 and the
first private car was made in early 1980;
• In 1994, the government started to
encourage people to buy private cars;
• Nowadays the car ownership in China has
reached 290 million With the growth of
27.5 million cars and 33.1 million drivers in
2016 (Xinhua news agency 2017);
• Traffic congestion and environment
problems have been more serious;
• More traffic policies are carried out to
restrict the amount of cars since 2008;
Private Car ownership analysis in several cities in China
Shijun Cheng, M.Sc. Transport Planning & Engineering Supervisor: Zia Wadud Institute of Transport Study
(Traffic congestion in Beijing)
Source: http://chuansong.me/n/981272952969
The proposed scope
• Taking Beijing ,Shanghai ,Tianjin,
Guangzhou and Hangzhou as the examples;
• The time series are divided into three parts:
“1985 - 2008”, “2008 - 2015”, “2015 -
2030”;
• Choose GDP per capita (RMB), population
data (1,000 people) and fuel price (RMB)
as the main valuable factors.
The proposed methodology
• Econometric model:
ln 𝐶𝑡 = 𝐾 +
𝑖=1
𝑚
𝛼𝑖 ln 𝐶𝑡−𝑖 +
𝑗=0
𝑛
𝛽𝑗 ln 𝐺𝐷𝑃𝑡−𝑗
+ 𝑘=0
𝑜
𝛾 𝑘 ln 𝑃𝑡−𝑘 𝑙=0
𝑝
δ𝑙 ln 𝐹𝑡−𝑙 + 𝜀𝑡;
• For the eq., C is the number of vehicles,
GDP is real GDP per capita ,P is population
and F is fuel price, 𝜀𝑡 is the error of the
econometric model, m n o p will be
chosen to fit the error 𝜀𝑡 and α, β, γ, δ, k
are the estimated parameters;
• Intervention analysis will be used in time
series econometrics to estimate the impact
of traffic polices.
Expected conclusions
• GDP per capita and population could be the
main variables of the car ownership model;
• After carrying out traffic policies,
comparing with the actual data, the growth
of the car ownership starts to slow down;
• The growth of the predictive results should
be more slowly.
Aims and Objectives
• By analysing the previous car ownership
data from to get estimated results;
• To find the differences between the actual
data and estimated results;
• Whether the traffic policies have positive
impacts on the restraint of car numbers?
• What is the predicted value of car ownership
in the future (2030)?
Private car ownership in China (per 1000)
GDP
(Population)
(Grass Domestic
Product) per capita
References
Bhat, C.R. and Sen, S. 2006. Transportation Research Part B: Methodological. Household Vehicle Type Holdings and Usage: An Application of the Multiple Discrete-
Continuous Extreme Value (MDCEV) Model. [Online]. 40(1).pp 35-53. [Available from]:
http://www.sciencedirect.com/science/article/pii/S0191261505000093
Dargay, J. et al. 2007. Science Direct: Transportation Research Part A. The effect of prices and income on car travel in the UK. [Online]. 2017(4).pp 949-960. [Available
from]:
http://www.sciencedirect.com/science/article/pii/S0965856407000419
Deng, X. 2007. Private Car Ownership in China: How Important is the effect of Income? [Online]. [Available from]:
https://www.researchgate.net/publication/241654202_Private_Car_Ownership_in_China_How_Important_is_the_effect_of_Income
Huang, X. 2011. Michigan Tech: Dissertations, Master's Theses and Master's Reports. Car ownership modeling and forecasts for China. [Online]. [Available from]:
http://digitalcommons.mtu.edu/etds/444/
Li, J. et al. 2010. Modelling Private Car Ownership in China: Investigation of Urban Form Impact across Megacities. [Online]. [Available from]:
https://trid.trb.org/view.aspx?id=909830
Wadud, Z. 2012. Transportation Research Part A. Transport impacts of an energy-environment policy: The case of CNG conversion of vehicles in Dhaka. [Online].
[Available from]:
www.sciencedirect.com/science/article/pii/S0965856414001128
Wu, T. 2014. Sustainability. Vehicle Ownership Analysis Based on GDP per Capita in China: 1963–2050. [Online]. 2014(6).pp 4877-4899. [Available from]:
https://www.researchgate.net/publication/277673929_Vehicle_Ownership_Analysis_Based_on_GDP_per_Capita_in_China_1963-2050
Xinhua News Agency. 2017. The car ownership in China.[Online].[Accessed 17 April]. Available from : http://www.gov.cn/shuju/2017-01/11/content_5158647.htm
Traffic policies have been taken in 2008
Where will it go in the future?
Fuel price per liter
(¥)](https://image.slidesharecdn.com/mastersdissertationposters2017-170517094532/75/Masters-Dissertation-Posters-2017-1-2048.jpg)
![Evaluating transport governance structures for Metro
Manila using cases on mass transit programmes
Anne Patricia E. Mariano, ts16apem@leeds.ac.uk Supervisor: Dr. Katharine Pangbourne
Second Reader: Professor Greg MarsdenMSc Sustainability in Transport
Potential Cases: Mass Transit Programmes
1. Limited-stop bus services were introduced in 2015 to encourage bus ridership.
These services successfully reduced travel ?me but do not replace exis?ng routes.
2. Studies were conducted in 2014 and 2016 to (a) iden?fy required mass transit
routes by reviewing demand and exis?ng services, and (b) present op?misa?on
plans for 3 routes. These are yet to be implemented in favour of further studies.
3. Infrastructure projects such as a bus rapid transit system between 2 ci?es and a
commuter rail to connect 4 regions were posi?vely received by stakeholders albeit
with concerns on the poli?cal costs of land acquisi?on.
Mode Share of Metro Manila Trips
Based on household interview surveys and a total of 35.5 million trips (JICA, 2014)
Transportation Issues
• Total metro rail lines of only 50km (DOTr, 2015)
• Transit primarily informal, lacking organised
stops, schedules, and services (DOTr, 2015)
• 18% increase in travel 9me on buses from
1996 to 2014 (JICA, 2015)
• Over 2M registered vehicles and some of the
worst conges?on in the world (DOTr, 2015; Waze,
2015)
Es?mates put Metro Manila conges9on costs
at GBP 37.5M every day. (JICA, 2014)
Selected References
• Aberbach, J. and Rockman, B. 2002. Conduc?ng and coding elite interviews. PoliDcal
Science & PoliDcs, 35(04), pp.673-676.
• Creswell, J. 2007. QualitaDve inquiry and research design: Choosing among five
approaches. 2nd edi?on. California: Sage Publica?ons.
• DOTr. 2015. Metro Manila 2015-2030: Approaches to Current Transporta?on Issues for
the Future.
• Japan Interna?onal Coopera?on Agency [JICA]. 2014. Final Report - Main Text. Roadmap
for Transport Infrastructure Development for Metro Manila and Its Surrounding Areas.
• JICA. 2015. MUCEP Progress. The Project for Capacity Development on TransportaDon
Planning and Database Management in the Republic of the Philippines (MUCEP).
• Philippine Sta?s?cs Authority. 2016. Regional Accounts of the Philippines. [Online].
[Accessed 21 April 2017]. Available from h`ps://psa.gov.ph/regional-accounts/grdp/
data-and-charts
• Waze. 2015. Global Driver Sa?sfac?on Index. [Online]. [Accessed 20 April 2017].
Available from h`ps://blog.waze.com/2015/09/global-driver-sa?sfac?on-index.html
The study will focus on the following:
1. What are the formal and informal boundaries of Metro Manila in
terms of transporta?on?
2. Who are the decision-makers for the planning and implementa?on
of transporta?on programmes in Metro Manila?
3. What organisa?onal or mandate issues do these decision-makers
face in planning or implementa?on, in light of a specific programme
to improve mass transit?
4. What policy or organisa?onal changes can address these issues?
Research Questions
Regional Development Council
– Na?onal Capital Region
Metropolitan Manila
Development Authority
Department of
Transporta?on
Department of Public
Works and Highways
Na?onal Economic and
Development Authority
Proposed Methodology
This study will employ qualita?ve research methods (Creswell, 2007). To gain a
deeper understanding of the issues, semi-structured interviews with open-ended
ques?ons will be conducted with stakeholder representa?ves (Aberbach and
Rockman, 2002). These may include the DOTr, the MMDA, 2-3 LGUs depending on
the case study, and, if relevant, public individuals. All data will be anonymised.
Legisla?on, historical and current events, and similar cases will be reviewed prior
to fieldwork. This will aid in formula?ng ques?ons and iden?fying relevant
stakeholders. Due to ?me constraints, all interviews will be scheduled over one
week in June 2017. Coordina?ng with officials will be crucial to data quality.
Collected data will be transcribed and coded to enable analysis.
Review of
literature
On Metro Manila;
metro regions;
qualita?ve research;
and elite interviews
Formula?on of
ques?ons
and
iden?fica?on
of interviewees
Conduct of
face-to-face
interviews
Data analysis
and
formula?on of
conclusions
*Coloured areas on map depict potenDal study areas.
Jeepney, 19%
Tricycle, 16%
Bus, 7%
Train, 4%
Other Public
Modes, 3%
Motorcycle,
8%
Car, 8%
Taxi, 1%
Other Private
Modes, 3%
Walking, 31%
Public
17,335
Private
7,253 Walking
10,913
Overview: Metro Manila Transportation
Area:
636km2, 0.21% of country
Popula?on (2015):
12.88M, 12.75% of country
Economic Output (20151):
GBP 43.3B, 36.5% of country
Public transit op?ons:
3 metro rail lines
82 bus routes
124 u?lity vehicle routes
677 jeepney routes
1Constant 2000 prices
Local Government Units (LGUs):
16 ci9es
1 municipality
Regional Agencies:
MMDA – Metropolitan Manila Development Authority
Na?onal Agencies:
DOTr – Department of Transporta?on
DPWH – Department of Public Works and Highways
NEDA – Na?onal Economic and Development Authority
LGUs are led by elected mayors, while regional and
na?onal agencies are typically led by presiden?al
appointees.](https://image.slidesharecdn.com/mastersdissertationposters2017-170517094532/85/Masters-Dissertation-Posters-2017-11-320.jpg)
![Data Fusion: A Simulation Approach
Aseem Awad
Institute for Transport Studies, Leeds
Objectives
We explore ways of addressing the issue of Verac-
ity and Value in Big Data.
• Apply techniques of Data Fusion to create a
Origin-Destination with high fitness-for-use, to
provide benchmark for the performance of our
models.
• Create Geospatial Microsimulation to visualize
results of the transport model based on our
datasets. Focus on one system.
• Use the hybrid Geospatial Microsimulation to
iteratively improve a simulation model of the
urban system. Compare the results with
analytical approaches.
Introduction
Transport modelling can be conceptualised as mod-
elling of transport demand, transport supply and the
evolving interaction of these two factors. In this dis-
sertation we set out to create and exhibit a demand
model with high fitness-for-use by utilising Data Fu-
sion and an innovative hybrid of Spatial Microsimu-
lation and Agent-Based simulation.
Figure 1: Agent-Based model to simulate changes in the built
environment of East Anglia
Materials
The following materials are required to complete the
research:
• A social media dataset coming from active
individuals. (STRAVA)
• Data of Automatic Traffic Detection readings.
• Data regarding Land-Use and demographics.
• A software suitable for Agent-Based Simulation.
Previous attempts in this direction have been
made using MATsim-T and NetLogo. We intend
to use R and NetLogo.
Methodology
• We apply the ITS Data Fusion techniques
described in [1] to STRAVA and other
demographic datasets.
• We use Geospatial Microsimulation for a separate
process of Data Fusion.
• We iteratively calibrate the simulation model and
the analytical model used for Data Fusion.
• We conclude by an analysis of the relation
between Active Travel, Public Transport and
Land Use/demographic variables.
The Central Research Question
How to fuse data from social media with traditional datasets to create high quality data? What role can
Geospatial Microsimulation and Agent-Based Modelling serve in this process?
Underlying Architecture of Data
Fusion
Figure 2: The typical Architecture of Data Fusion techniques.
[2]
[3] is the first paper that uses Geospatial Microsim-
ulation for the purpose of Data Fusion. The simula-
tion can display the efficacy of a given algorithm.
Application of the Technique
Figure 3: A link existing?
The relation between active travel, public transit
and Land-Use characteristics provides a rich area
for research. We aim to get a detailed picture of the
active travel occurring in our area of choice. We can
use the dataset to infer the relation of active travel
with Land-Use and Public Transit. As a conclusion
we hope to demonstrate the relation between these
elements.
Additional Information
Figure 4: City of Glasgow in motion. Projection of a dataset
acquired by UBDC
This project has established relationships with orga-
nizations that specialize in collecting and curating
data. CDRC in Leeds and Urban Big Data Center
(UBDC) will be involved in the acquisition of data.
References
[1] Nour-Eddin El Faouzi, Henry Leung, and Ajeesh Kurian.
Data fusion in intelligent transportation systems: Progress
and challenges–a survey. Information Fusion, 12(1):4–10,
2011.
[2] David Lee Hall and Sonya AH McMullen. Mathematical
techniques in multisensor data fusion. Artech House,
2004.
[3] Chris Bachmann, Baher Abdulhai, Matthew J Roorda, and
Behzad Moshiri. A comparative assessment of multi-sensor
data fusion techniques for freeway traffic speed estimation
using microsimulation modeling. Transportation Research
Part C: Emerging Technologies, 26:33–48, 2013.
Contact Information
• Email: ts16ara@leeds.ac.uk
• Phone: +44 7435703778](https://image.slidesharecdn.com/mastersdissertationposters2017-170517094532/85/Masters-Dissertation-Posters-2017-12-320.jpg)
![1. Introduction
India ranks high in road traffic fatalities. India has the 2nd largest road network in the World[1]
but lags qualitatively[2]. A report[3] based on in-depth crash data highlights that all fatal crashes
in urban Kolkata (Nov’14 to Nov’15) had at least one infrastructure factor contributing to its
incidence. My research study aims to identify and address such factors in a junction in the city
of Kolkata, India.
4. Location identification
o Identify one location from 516 crashes with GPS locations
• Should have high accident incidence
• Be a typical junction to develop a template for transferability
8. References
[1] www.telegraphtravelteam.carto.com
[2] www.web.worldbank.org
[3]Kolkata City Fatal Accident Study 2016, JP Research India Pvt. Ltd.
6. Intervention development
o Literature review for possible solutions to identified problems
o Develop relevant interventions based on local conditions
• CAD will be used for design, if required
• ARCADY/LinSig to be used for intervention assessment
5. Problem identification
o Registered accidents considered as “case studies” and analysed
for following crash parameters:
• Crash configuration
• Kind of accident
o Additional data to be collected on traffic volume and counts
2. Objectives
o Identify a junction with high crash incidence
o Study crashes to understand the interactions leading to crash occurrence
o Literature review to list possible solutions and develop relevant changes
o Assess the proposed changes using relevant software
o Transferability of changes to other locations
3. Data Source and basic statistics
Fatal crashes data from JP Research India Private Limited (JPRI)
o 719 crashes registered between Nov’14 to Nov’16 (24months)
• 53% of 719 crashes involved pedestrians
• 54% of 706 fatalities were pedestrians
• 20% of accidents involved vehicles moving in the same direction
0% 0%
0%
81%
19%
Human
VehicleInfrastructure
Pedestrian,
384Same
direction
traffic,
140
Pedestrian
Same direction traffic
Leaving carriageway
Opposing traffic
Turning/crossing
Obstacles in carriageway
Other kind
Unknown
DEVELOPMENT OF INFRASTRUCTURE IMPROVEMENTS FOR REDUCING
FATAL ACCIDENTS IN KOLKATA, INDIA
QGIS plot of 516 crashes
516 accidents
Evenly spread
throughout city
QGIS filtering to
locations > 2 crashes
within 100m2 area
12 Locations: 45 accidents
Max: 6 accidents
Includes:
Junctions
Roundabouts
Grade separated junc.
Parking bay entry
2 Locations: 12 accidents
1. Typical 4-arm junction,
lower traffic density
2. Most vulnerable,
includes tram line, grade
separated overhead
bridge, high traffic
density
7. Transferability
o Improved junction design will to be used as base template
• Most locations have ensuing crash configurations in common
(Front-rear, front-side, pedestrian, object)
o Numerical extrapolation of number of accidents prevented
with proposed changes
Kind of Accident
Contributory factors [3]
Bhuvanesh Bharath Alwar M, MSc (Eng) Transport Planning and Engineering
Junction Ped. Acci. Veh. Acci. Fatalities
Raja Dinendra street -
Shri Aurobindo Sarani
2 2 4](https://image.slidesharecdn.com/mastersdissertationposters2017-170517094532/85/Masters-Dissertation-Posters-2017-13-320.jpg)
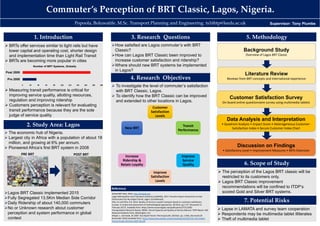
![Commuter’s Perception of BRT Classic, Lagos, Nigeria.
Popoola, Boluwatife. M.Sc. Transport Planning and Engineering. ts16btp@leeds.ac.uk
The economic hub of Nigeria.
Largest city in Africa with a population of about 18
million, and growing at 6% per annum.
Pioneered Africa’s first BRT system in 2008
Lagos BRT Classic implemented 2015
Fully Segregated 13.5Km Median Side Corridor
Daily Ridership of about 140,000 commuters
No or Unknown research about customer
perception and system performance in global
context
To investigate the level of commuter’s satisfaction
with BRT Classic, Lagos.
To identify how the BRT Classic can be improved
and extended to other locations in Lagos.
1. Introduction 3. Research Questions 5. Methodology
The perception of the Lagos BRT classic will be
restricted to its customers only.
Lagos BRT Classic improvement
recommendations will be confined to ITDP‘s
scored Gold and Silver BRT systems.
BRTs offer services similar to light rails but have
lower capital and operating cost, shorter design
and implementation time than Light Rail Transit
BRTs are becoming more popular in cities
0 20 40 60 80 100 120 140 160 180 200
Pre 2000
Post 2000
Number of BRT Systems, Globally
Measuring transit performance is critical for
improving service quality, allotting resources,
regulation and improving ridership
Customers perception is relevant for evaluating
transit performance because they are the sole
judge of service quality
How satisfied are Lagos commuter’s with BRT
Classic?
How can Lagos BRT Classic been improved to
increase customer satisfaction and ridership?
Where should new BRT systems be implemented
in Lagos?
4. Research Objectives
6. Scope of Study
7. Potential Risks
2. Study Area: Lagos
PRE BRT POST BRT
Lapse in LAMATA and survey team cooperation
Respondents may be multimedia tablet illiterates
Theft of multimedia tablet
Supervisor: Tony Plumbe
Background Study
Overview of Lagos BRT Classic
Discussion on Findings
• Satisfactory Level • Improvement Measures • BRTs Extension
Data Analysis and Interpretation
• Quadrant Analysis • Impact Score • Heterogeneous Customer‐
Satisfaction Index • Secure Customer Index Chart
Customer Satisfaction Survey
On‐board online questionnaire survey using multimedia tablets
Literature Review
Reviews from BRT concepts and international experience
Customer
Satisfaction
Levels
Transit
Performance
Improve
Service
Quality
Improve
Satisfaction
Levels
Increase
Ridership &
Retain Loyalty
New BRT
Reference
Global BRT Data. 2016. http://brtdata.org
Lagos Metropolitan Area Transport Authority (LAMATA). 2017. Periodic Impact Assessment on Key
Performance for Bus Rapid Transit. Lagos. (Confidential)
Oña, D.J and Oña, D.R. 2014. Quality of service in public transport based on customer satisfaction
surveys: A review and assessment of methodological approaches. [Online]. pp.1‐47. [Accessed 12
February 2017]. Available from: https://www.researchgate.net/publication/271512605
Transportation Research Board, 2003b. Transit Capacity and Quality of Service Manual. TCRP Report 100.
National Academy Press, Washington, D.C.
Wright, L. and Hook, W. 2007. Bus Rapid Transit: Planning Guide. [Online]. pp. 1‐836. [Accessed 20
November 2016] Available from: https://www.itdp.org/wp‐content/uploads/2014/07/52.‐Bus‐Rapid‐
Transit‐Guide‐PartIntro‐2007‐09.pdf](https://image.slidesharecdn.com/mastersdissertationposters2017-170517094532/85/Masters-Dissertation-Posters-2017-14-320.jpg)
![`
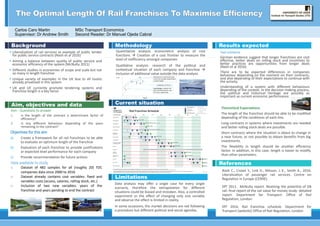
Carlos Caro Martin MSc Transport Economics
Supervisor: Dr Andrew Smith Second Reader: Dr Manuel Ojeda Cabral
Background
1. Is the length of the contract a determinant factor of
efficiency?
2. Is any different behaviour depending of the years
remaining in the contract?
Aim, objectives and data
a) Create a framework for all rail franchises to be able
to evaluate an optimum length of the franchise
b) Evaluation of each franchise to provide justifications
or expected level performance for each company
c) Provide recommendation for future actions
Quantitative analysis: econometric analysis of cost
functions Creation of a cost frontier to measure the
level of inefficiency amongst companies
Qualitative analysis: research of the political and
contextual situation of each company and franchise
Inclusion of additional value outside the data analysis
Methodology
Data analysis may offer a single case for every single
scenario, therefore the extrapolation for different
situations could be biased and mistaken. Also, a controlled
experiment or the effect of changing only one variable
and observe the effect is limited in reality.
In some occasions, the market decisions are not following
a procedure but different political and social agendas.
Liberalization of rail services as example of public tender
for public service contracts (Nash et al 2016)
Aiming a balance between quality of public service and
economic efficiency of the system (McNulty 2011)
Different studies in economies of scope and scale but not
so many in length franchise
Unique variety of examples in the UK due to all routes
already privatised in this system
UK and UE currently promote tendering systems and
franchise length is a key factor
Limitations
German evidence suggest that longer franchises are cost
effective, better deals on rolling stock and incentives to
better practices are opportunities from longer deals
(Nash et al 2016).
There are to be expected differences in companies
behaviour depending on the moment on their contracts,
and also depending of their expectations to continue with
the activity.
Understanding of a system with different behaviours
depending of the context. In the decision making process,
the political and historical heritage are possibly as
important as current economic performance.
Results expected
The length of the franchise should be able to be modified
depending of the conditions of each line.
Long contracts in systems where investments are needed
and better rolling stock deals are possible.
Short contracts where the situation is about to change in
a near future, or not possible to obtain benefits from big
investments.
The flexibility in length should be another efficiency
factor. In addition, in this case, length is easier to modify
than other parameters.
Nash C., Crozet Y., Link H., Nilsson, J.-E., Smith A., 2016.
Liberalisation of passenger rail services. Centre on
Regulation in Europe (CERRE).
DfT 2011. McNulty report. Realising the potential of GB
rail: final report of the rail value for money study: detailed
report. Department for Transport: Office of Rail
Regulation, London.
DfT 2016. Rail franchise schedule. Department for
Transport [website] Office of Rail Regulation, London
References
Current situation
Cost frontier: establish the
level of inefficiency for each
firm at an output level
A’
Inefficiency of firm A
o Dataset of 482 samples for all (roughly 20) TOC
companies data since 2000 to 2016
o Dataset already contains cost variables: fixed and
variables costs (access, salaries, rolling stock, etc.)
o Inclusion of two new variables: years of the
franchise and years pending to end the contract
Movements in cost frontier due
to dummy variables depending of
contract length](https://image.slidesharecdn.com/mastersdissertationposters2017-170517094532/85/Masters-Dissertation-Posters-2017-16-320.jpg)
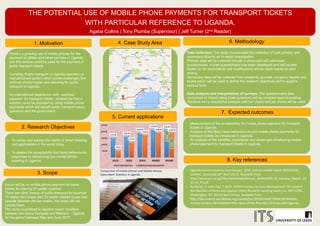
![Data collection: The study incorporates the collection of both primary and
secondary data for an in-depth investigation.
Primary data will be collected though a structured self-administer
questionnaire. A draft questionnaire has been developed and will be pilot
tested on 30 respondents and modifications will be made based on pilot
testing.
Secondary data will be collected from academic journals, company reports and
books which will be used to define the research objectives and to explore
various facts.
Data analysis and interpretation of surveys: The questionnaire data
composed of closed rating scale questions will be compare against existing
literature and a descriptive analysis with bar charts and pie charts will be used.
THE POTENTIAL USE OF MOBILE PHONE PAYMENTS FOR TRANSPORT TICKETS
WITH PARTICULAR REFERENCE TO UGANDA.
Agaba Collins | Tony Plumbe (Supervisor) | Jeff Turner (2nd Reader)
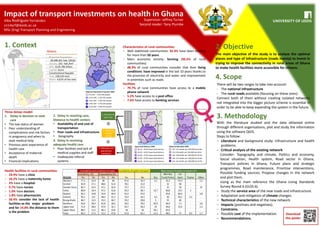
1. Motivation
There’s a growing use of mobile phones for the
payment of utilities and other services in Uganda
and this service could be used for the payment of
public transport tickets.
Currently, Public transport in Uganda operates on
manual based system which poses challenges like
retrieval of information and planning for public
transport in Uganda.
My international experience with cashless
payment for transport tickets showed me that a
solution could be provided by using mobile phone
payments which will benefit public transport users,
operators and the government.
2. Research Objectives
• To review and access the merits of smart ticketing
and applications in the world today.
• To assess the acceptability and likely behavioural
responses to introducing bus mobile phone
ticketing in Uganda.
4. Case Study Area
3. Scope
6. Methodology
Focus will be on mobile phone payment for travel
tickets for intercity 67 seater coaches.
There are other means of public transport for example
14 seater mini buses and 32 seater coaster buses that
operate between the two towns, this study will not
include them.
The study is confined to daytime coach travellers
between two towns Kampala and Mbarara – Uganda
for the period between May and June 2017.
5. Current applications
7. Expected outcomes
• Measurement of the acceptability for mobile phone payment for transport
tickets in Uganda.
• Analysis of the likely travel behaviour should mobile phone payments for
transport tickets be introduced in Uganda.
• An analysis of the benefits, importance and challenges of adopting mobile
phone payment for transport tickets in Uganda.
8. Key references
• Uganda communications commission. 2016. Annual market report 2015/2016.
[online]. [Accessed 26th April 2017]. Available from:
http://www.ucc.co.ug/files/downloads/Annual_Market%20_&_Industry_Report_20
15-16_FY.pdf
• Gutierrez, E. and Choi, T. 2014. Mobile money services development: the cases of
the Republic of Korea and Uganda. Policy Research working paper; no. WPS 6786.
Washington, DC: World Bank Group. Available from:
http://documents.worldbank.org/curated/en/503961468174904206/Mobile-
money-services-development-the-cases-of-the-Republic-of-Korea-and-Uganda
Comparison of mobile phones and Mobile Money
Subscribers’ Statistics in Uganda.](https://image.slidesharecdn.com/mastersdissertationposters2017-170517094532/85/Masters-Dissertation-Posters-2017-18-320.jpg)
![Background
Aims and Objectives
GPS Tracking Data Filter by Stata
GPS Tracking Data Visualisation by
GPS Visualizer
Methodology and Scope
5 Current Progress
Next Steps
Process the whole data for visualisation, speed calculation
and analysis on other road links in different areas to
evaluate the shopping impact on congestion.
Quantify impact level by the multiple linear regression
model.
𝑣 = 𝛽0 +
𝑖=1
7
𝛽𝑖 𝐿𝑖 𝛿𝑖 𝐿𝑖: Distance from Gravity Centre
of Zone i to centre of certain road-
link
𝛿𝑖: 0 and 1 variable, 0 variable:
shops close; 1 variable: shops open
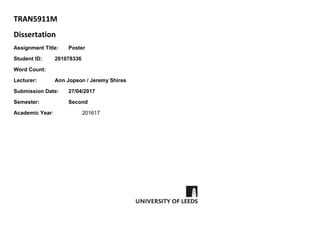
Congestion Attributed to Shopping using GPS Tracking Data
-- Dhaka Case StudyChen, Danlei MSc Transport Planning ts16dc@leeds.ac.uk
Supervisor: Zia Wadud; 2nd Reader: Ian Philips
𝑣: average speed for road-links
𝛽0 ⋯ 𝛽𝑖: Regression Coefficients
References
One Road Sample Test
Data Filter: All vehicles GPS tracking data on New
Elephant Road between 3:00 pm to 7:00 pm in from
March to December.
Shops Close on Full Tuesday and Half Wednesday
Data base: 5444347 GPS tracking data for 70 vehicles in 2010
in Dhaka provided by Dr Zia Wadud.
In many developing countries, shopping is one of the
main reasons for traffic congestion, due to the lack of
parking restrictions around the shopping centre.
While it is widely accepted that shopping can contribute
significantly to the congestion (Kumaat et al, 2015), there
is often no evidence of quantification of the impact.
Weekly holidays of shopping centres at different parts in
Dhaka helps to analyse the changes in traffic speed and
congestion.
Visualise GPS tracking data to understand the changes
of congestion.
Quantify the impact of shopping on traffic speed change
in road-links.
Determine the congestion costs attributable to shopping.
Results p < 0.005,
there is evidence
of a change in the
underlying mean
speed.
Shop
Open
Shop
Close
Number 607 351
Mean 8.6024 14.1973
Median 3.9309 8.9282
Variance 107.543 206.584
Minimum 0.0000 0.0000
Maximum 49.0586 84.5174
To optimize
Speed Distribution
Curve,
make the logarithm
of speed and set
the speed of 0 to
0.1.
In this figure, there
is difference in two
scenarios.
Speed Analysis
3.Hypothesis Testing
Using a 5% significance level, test whether there has been a
change in mean speed as a result of the shops closure and
opening.
2.Speed Distribution Analysis
Using MATLAB to fit speed and output the Speed Distribution and
Statistic Description.
Comparing GPS tracking data in Shop Closure(above) and
Opening(below), there are more data appear on Opening scenario.
1.Speed Calculation
𝑠𝑝𝑒𝑒𝑑 =
𝐷𝑖𝑠𝑡𝑎𝑛𝑐𝑒 𝑏𝑒𝑡𝑤𝑒𝑒𝑛 𝑡𝑤𝑜 𝑎𝑑𝑗𝑎𝑐𝑒𝑛𝑡 𝑐𝑜𝑜𝑟𝑑𝑖𝑛𝑎𝑡𝑒𝑠
30𝑠
Shops close on Tuesday and Wednesday
Shops open on Monday and Thursday
Two-sample t-statistic
Shops: Open;
Office: Open
Speed
Analysis
GPS
tracking
data
Compare
Speed and
Statistics
for
congestion
analysis
Shopping
effects
on
congestion
Kumaat, M., Mulyono, A.T., Sjafruddin, A., Setiadji, B.H., 2015. Congestion as a
result of school and shopping centre activity, International Journal of Science and
Engineering, 9(2), 106-112.
The Daily Star, 2010. Businesses to stay shut alternately. [Online]. [Accessed 24th
Feb 2017]. Available from: http://www.thedailystar.net/news-detail-124484
Speed
Analysis
GPS
tracking
data
Shops: Close;
Office: Open](https://image.slidesharecdn.com/mastersdissertationposters2017-170517094532/85/Masters-Dissertation-Posters-2017-20-320.jpg)
![Va Vb Vd VeVc
Assessing Driver Behaviour to Improve Safety on Roundabouts
using Speed Profile Data of Naturalistic Study
Introduction
The application of roundabout junctions have been mushrooming around the
world.
The main aim of roundabout design is to induce driver behavioural response that
might lead to speed reduction and homogenous speed profile (Silva and Seco,
2005).
To understand driver’s behaviour changes dealing with roundabouts is important
to ensure the effectiveness of roundabout design, especially its correlation with
safety driving.
Speed determines the possibility or the risk for an accident to happen and
contributes to the severity of crash (Elvik et al., 2004).
Naturalistic Driving Study provides wider opportunity answering several questions
in driving behaviour and safety analysis such as the relationship between driver,
vehicle, road and other traffic participants in ordinary situations, in conflict
situations and, more rarely, in some actual crashes (Barnard et al., 2015).
The current study optimises data from a naturalistic study namely UDRIVE that
gathers a large scale of data on everyday driving and riding (day-to-day basis).
Edward # 201082791 ✉ ts16ed@leeds.ac.uk Supervisor: Dr Daryl Hibberd
Institute for Transport Studies
Research Questions
UDRIVE Project
Acronym:
eUropean naturalistic Driving and Riding for
Infrastructure & Vehicle safety and
Environment.
Source: Barnard, 2015.
Source: http://www.udrive.eu
UDRIVE is the first large-scale European
Naturalistic Driving Study on cars, trucks and
powered two-wheelers.
Impression of UDRIVE video data in draft version of analysis tool.
The camera views collected for trucks, cars and scooters
Observed Behavioural Factors
Observed Speed Locations
𝑆𝐷85 =
1
𝑛 − 1
(𝑣85,𝑖 − 𝑣85)2
𝑛
𝑖=1
𝑀𝑒𝑎𝑛85 =
𝑣85,𝑖
𝑛
𝑖=1
𝑛
𝐼𝑛𝑡𝑒𝑟𝑞𝑢𝑎𝑟𝑡𝑖𝑙𝑒85 = 𝑄3 𝑣85 − 𝑄1(𝑣85)
Naturalistic Driving Study
(NDS) is a method to
approach real-life driving
conditions by minimising
biases that are caused by
data collection devices
and experiment
instructions.
References:
Barnard, et al., 2015. The study design of UDRIVE: the naturalistic driving study across Europe for cars, trucks
and scooters. [Online]. [Accessed 24 February 2017]. Available from:
https://link.springer.com/article/10.1007%2Fs12544-016-0202-z
European Naturalistic Driving Study (UDRIVE). 2017. Overview. [Online]. [Accessed 24 February 2017].
Available from: http://www.udrive.eu/index.php/about-udrive/overview
Silva, B.A., Seco, A. 2005. Trajectory Deflection Influence on The Performance Of Roundabouts. [Online].
[Accessed 20 April 2017]. Available from: abstracts.aetransport.org/paper /download/id/2247
Roundabout design aims:
a. To reduce the speed
b. To achieve homogeneity
Methodology (cont.)
Methodology
Comparison Example of Speed Profiles at Crossbuck and Stop Sign Equipped Crossings
by Age Group
Source: FRA, 2014.
A = Approaching Point (Va)
B = Entry Point (Vb)
C = Circulating Point (Vc)
D = Exit Point (Vd)
E = Leaving Point (Ve)
Speed Profile Analysis
Qualitative and comparative analysis using some statistical measures: speed variation, the
mean of the 85th percentile speed, the interquartile range of the 85th percentile speed,
average speed values, and variance of the sample.
Limitations and Assumptions:
1. Observe two-lane roundabouts and free flowing cars that
take the second exit only.
2. All drivers are assumed driving in normal driving situation
(undistracted).
3. Engineering (geometric) details, pavement surface quality,
on-site safety measures, weather, and land use around the
roundabouts are ignored.
• Focus on roundabouts in
the UK, urban and rural
samples.
• Because of the data
collected from vehicles that
ran freely, the roundabouts
are selected in which the
sample size is high.
Expected Outcomes/ the use of the study:
1. Effectiveness of the roundabouts regarding speed reduction and homogeneity.
2. Provide more inputs for engineering design process (e.g. by comparing the study results
with built-geometric details).
3. Possibly informs the needs of safety measures implementation at roundabouts.
1. How does every type of road user perform their behavioural changes
influenced by roundabouts? Does each type of road users perform different
speed patterns on roundabouts? Has the homogeneity been achieved?
2. Does each roundabout have different performance level to induce driver
behavioural response that leads to driving speed reduction? How much the
differences?](https://image.slidesharecdn.com/mastersdissertationposters2017-170517094532/85/Masters-Dissertation-Posters-2017-23-320.jpg)
![Understanding Passengers’ Effective Use of Travel Time
Evelio Robles Alejo | MSc(Eng) Transport Planning and Engineering | ts16era@leeds.ac.uk
Supervisor | Manuel Ojeda Cabral Second Reader | Thijs Dekker
Background
1
Objectives
2
Scope
3
Methodology
4
Data collection
5
References
6
There is not much evidence on showing how travellers perceive the time
as effective when travelling. The effective use of travel time may also vary
upon the travel mode, as different stages arise at each mode.
Previous research: based on the productivity of travel time (studies
frrom Hensher, Batley).
- Mostly centred on the trade-offs on time savings, rather than in the
effective use of travel time due to particular trip conditions.
- ‘Journey time savings in rail trips led to increased productive time for
business travellers, but also to a reallocation of time use’ (DfT, 2009)
Further elements such as saved time, as well as access and egress times,
among others, may influence the effective use of time across all modes. As
the mentioned elements have not been directly assessed before, these will
be included in this study.
The aim of this project will be based on a cross model comparison, in order
to gain a better understanding of travellers’ modal choice decisions on
medium and long range trips within the UK.
(I)
(II)
Determine which mode provides the most
effective use of travel time in the different bands
Identify what elements influence the time
effectiveness for each of the modes under study.
Centred on trips made within mainland UK
(Great Britain), where air, car and rail modes
can directly compete.
Edinburgh
Leeds
London
Two scenarios: medium and
long range trips
‘Medium’: e.g. London-Leeds
‘Long’: e.g. London-Edinburgh
Medium range scenario
Travel time bands for each mode
1h30min - 2h30min
2h30min - 4h30min
Long range scenario
Travel time bands for each mode
>2h30min
1h - 1h30min
SURVEYS
(I). How travellers used their time during the trip
- Categories covering potential answers
(II). How useful time was, as perceived by travellers
- In competing modes, compared to not travelling,
then determining a common reference level.
(III). How useful each trip stage was
Based on interactive surveys, obtained through the interception of intercity
travellers at the targeted corridors.
Due to the reduced number of commuters at the chosen corridors, only
business (dark grey) and non-work (light grey) trips will be considered.
Medium range Long range
100
100
100
100
100
100
100
100
Comfort Reliability Speed
Connectivity
Schedule
flexibility
Access and
egress time
Abrantes, P.A.L. and Wardman, M.R. 2011. Meta-analysis of UK values of travel time: An
update. Transportation Research Part A. 45, pp.1-17
Batley, R. 2015. The Hensher equation: derivation, interpretation and implications for
practical implementation. Transportation. 42 (2), pp.257-275
Department for Transport. 2009. Productive use of rail travel time and the valuation of
travel time savings for rail business travellers. [Online]. [Accessed 24 February 2017].
Accessible from:
https://www.gov.uk/government/publications/productive-use-of-rail-travel-time-and-the-
valuation-of-travel-time-savings-for-business-travellers-final-report
Kirby, H., Carreno, M. and Smyth, A. 2006. Exploring the relative costs of travelling by train
and car. Final report to Virgin Trains and Fishburn Hedges.
The input values will be the passengers perception of the use of travel time,being
this split into time blocks (different stages of the trip,varying across all modes) and
assessing to what extent each of these time blocks would be useful, in reference
to a common established level (not travelling scenario).
The output values will be how effective the travel time would be for the whole
trip in both scenarios under comparison, as compared to not travelling case. As
well, how passengers used their time will be cleared with the data collection.
(III)
Contrast how much time is perceived as useful
time across the different modes.](https://image.slidesharecdn.com/mastersdissertationposters2017-170517094532/85/Masters-Dissertation-Posters-2017-26-320.jpg)
![C
Background
Research Questions
Route Map(Partial)
Methodology
Objectives
References
Preliminary Comparison
Delivered Schemes
(Note: Boxes in white: data in 2015; Boxes in blue: data in 2016; Boxes
in yellow: Downward trend in running time)
➢Bus Lane Widening (5): Re-align road marking to accommodate widening of bus lane
➢Yellow Box Marking (3): Criss-cross yellow lines painted on the road
➢Keep Clear Marking (2): Do not block that part of the carriageway indicated.
➢Review Parking (1): Part-time parking is potentially obstructing the bus route during peak hours
➢Centerline (3): Moving the road centerline to assist traffic pass bus stops or curbside obstructions.
➢Signage and Enforcement (1): Install signage to prevent general traffic entering, enforce bus lane
facility.
➢Signage and Line Marking (1): Move the locations of part-time on-street loading bays to allow space
for vehicles to maneuver around safely.
➢Signal Modification- SCOOT (1): Converting existing signal system to Split Cycle Offset Optimizing
Technique (SCOOT).
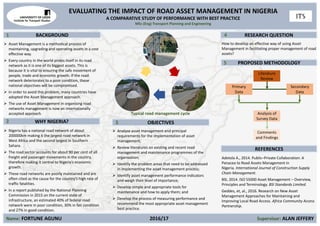
• To quantify the benefits of all 17 bus priority interventions implemented on London
bus Route 3 and compare them with their predicted values.
• To assess the reliability of London bus Route 3 after the bus priority interventions
implemented.
• To compare cost of schemes with effectiveness and carry out an Cost-Benefit
Analysis (CBA).
• To identify potential problems and reasons lead to the difference between predicted
and actual benefits, propose measures and explore more efficiency schemes.
In 2015, based on a review of the existing evidence, a guide to the effectiveness of
26 different types of bus priority interventions produced by TfL. TfL applied this
guide to forecast the effectiveness of various schemes at pinch-points on the
network of London, in terms of the savings in expected journey times, variety and
delays. A majority of bus priority schemes have completed since December 2016,
and actual monitoring data collected by Tfl is available now.
The target route is London Bus Route 3. According to the bus service usage
report published by TfL, the usage of Route 3 has experienced declining for three
consecutive years since 2013, it is significant to take measures to make Route 3
more attractive. Since 2015, 17 bus priority schemes have been implemented
along side the bus route to improve effectiveness and reliability.
Social influence, how many
passengers and inhabitants can
benefit from these schemes?
How much?
Will the increased/improved
reliability of Route 3 be realized
by passengers? How could
Route 3 attract passengers who
gave it up previously?
What types of factors could influence
the service reliability? How to estimate
the effects of different factors on
service reliability?
Data Analysis and Assess the Scheme Benefits
Running Time Analysis-Individual trip times, scheduled VS observed averages,
daily averages in March in 2015 and 2016 respectively
Evidence of declining bus market
Implement timescale and cost of each scheme
Background factors (such as accidents, events, activities and road works)
Identify Indicators and Evaluate the Reliability of Route 3
➢ Punctuality Index Based on Route (PIR):
𝑃𝐼𝑅 𝐿 = 𝑃 𝑡 𝑅𝑢𝑛 ∈ [𝑡 𝑠𝑐ℎ + 𝛿1, 𝑡 𝑠𝑐ℎ + 𝛿2] = 𝑃{𝑡 𝑅𝑢𝑛 − 𝑡 𝑠𝑐ℎ ∈ [𝛿1, 𝛿2]}
➢ Deviation Index Based on Stops (DIS):
𝐷𝐼𝑆𝑠 = 𝑃 𝐻𝑠 − 𝐻0 ∈ 𝜃1, 𝜃2
Cost-Benefit Analysis (CBA) of Bus Priority Schemes
An Assessment of 17 Bus Priority Schemes Implemented on London Bus Route 3,
What Lessons Can Be Learned?
Feiyang Zhang MSc-Transport Planning & Engineering ts16fz@leeds.ac.uk Supervisor: Jeremy Shires Second Reader: Dan Johnson
The cost of all the schemes VS the
benefit obtained from schemes, will
the desired results be achieved? Will
the change attract more passengers
and bring more profits?
Chen, X., Yu. L., Zhang, Y. and Guo, J. 2009. Analyzing Urban Bus Service Reliability at the Stop, Route, and Network Levels. Transportation Research Part A. 43
(2009), pp.722-734.
Lin, J., Wang, P. and Barnum. D. 2008. A Quality Control Framework for Bus Schedule Reliability. Transportation Research Part E. 44 (2008), pp.1086-1098.
Qu, X., Oh, E., Weng, J. and Jin, S. 2013. Bus Travel Time Reliability Analysis: A Case Study. Transport. 167 (TR3), pp.178-184.
Sorratini, J., Liu, R. and Sinha, S. 2008. Assessing Bus Transport Reliability Using Micro-Simulation. Transportation Planning and Technology. 31 (3), pp.303-324.
Transportation Benefit-Cost Analysis. 2017. Public Transport Case Studies. [Online]. [Accessed April 2017]. Available from:
https://sites.google.com/site/benefitcostanalysis/case-studies/public-transport
Benefits, Magnitude and Value:Total time cost saving, Operating cost
saving, Bus device saving, Emissions-related saving
Cost: The cost of implementing the schemes, Maintenance and
operation cost
Analysis and Criterions: Benefits / Cost Ratio
Passenger Survey
Collect feedback, experience and opinions from passengers, how do they
response to the improvement](https://image.slidesharecdn.com/mastersdissertationposters2017-170517094532/85/Masters-Dissertation-Posters-2017-28-320.jpg)
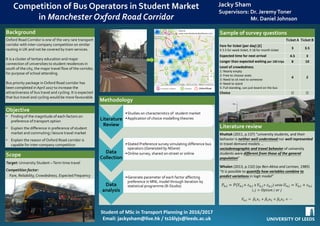
![Competition of Bus Operators in Student Market
in Manchester Oxford Road Corridor
Jacky Sham
Supervisors: Dr. JeremyToner
Mr. Daniel Johnson
Background
Oxford Road Corridor is one of the very rare transport
corridor with inter-company competition on similar
routing in UK and not be covered by tram services.
It is a cluster of tertiary education and major
connection of universities to student residences in
south of the city, the major travel flow of the corridor,
for purpose of school attending.
Bus priority package in Oxford Road corridor has
been completed in April 2017 to increase the
attractiveness of bus travel and cycling. It is expected
that bus travel and cycling would be more favourable.
Literature review
Khattak (2011, p.137) “university students, and their
behavior is neither well understood nor well represented
in travel demand models …
sociodemographic and travel behavior of university
students were different from those of the general
population”
Whalen (2013, p.132) (qv Ben-Akiva and Lerman, 1985)
“It is possible to quantify how variables combine to
predict variations in logit model”
𝑃𝑛,𝑖 = 𝑃(𝑉𝑛,𝑖+ 𝜀 𝑛,𝑖 ≥ 𝑉𝑛,𝑗+ 𝜀 𝑛,𝑗) while 𝑈 𝑛,𝑖 = 𝑉𝑛,𝑖 + 𝜀 𝑛,𝑖
𝑖, 𝑗 = 𝑂𝑝𝑡𝑖𝑜𝑛 𝑖 𝑜𝑟 𝑗
𝑉𝑛,𝑖 = 𝛽1 𝑥1 + 𝛽2 𝑥2 + 𝛽3 𝑥3 + ⋯
Methodology
Scope
Target: University Student –Term time travel
Competition factor:
Fare, Reliability, Crowdedness, Expected Frequency
Objective
• Finding of the magnitude of each factors on
preference of transport option
• Explain the difference in preference of student
market and commuting / leisure travel market
• Explain the reason of Oxford Road corridor is
capable for inter-company competition
Oxford Road
Source:
www.manchesterstudenthome.com
Literature
Review
•Studies on characteristics of student market
•Application of choice modelling theories
Data
Collection
•Stated Preference survey simulating difference bus
operators (Generated by NGene)
•Online survey, shared on-street or online
Data
analysis
•Generate parameter of each factor affecting
preference in MNL model through iteration by
statistical programme (R-Studio)
Sample of survey questions
Student of MSc in Transport Planning in 2016/2017
Email: jackysham@live.hk / ts16lyjs@leeds.ac.uk
Ticket A Ticket B
Fare for ticket (per day) [£]
X 3.5 for week ticket, X 18 for month ticket
3 3.5
Expected time for next arrival 4.5 3
Longer than expected waiting per 100 trips 8 10
Level of crowdedness
1: Nearly empty
2: Free to choose seats
3: Need to sit next to someone
4: Need to stand
5: Full standing, can just board on the bus
4 2
Choice O O](https://image.slidesharecdn.com/mastersdissertationposters2017-170517094532/85/Masters-Dissertation-Posters-2017-33-320.jpg)
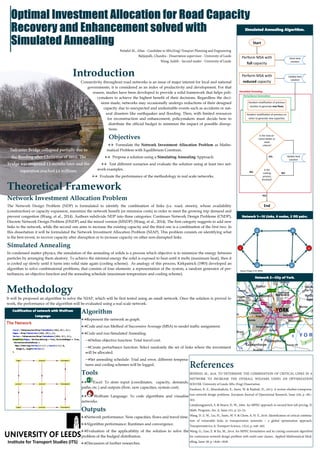
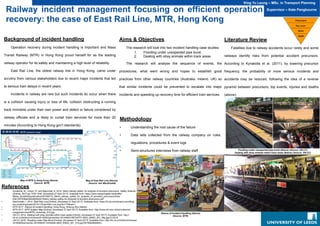
![King Yu Leung – MSc. in Transport Planning
Railway incident management focusing on efficient operation
recovery: the case of East Rail Line, MTR, Hong Kong
Aims & Objectives
The research will look into two incident handling case studies:
1. Flooding under unexpected pipe burst
2. Dealing with stray animals within track areas
The research will analyse the sequence of events, the
procedures, what went wrong and hopes to establish good
practices from other railway countries (Australia, Ireland, UK) so
that similar incidents could be prevented to escalate into major
incidents and speeding up recovery time for efficient train services.
Supervisor – Kate Pangbourne
Methodology
• Understanding the root cause of the failure
• Data sets collected from the railway company on rules,
regulations, procedures & event logs
• Semi-structured interviews from railway staff
Literature Review
Fatalities due to railway accidents occur rarely and some
railways identify risks from potential accident precursors.
According to Kyriakidis et al, (2011), by lowering precursor
frequency, the probability of more serious incidents and
accidents may be reduced, following the idea of a reverse
pyramid between precursors, top events, injuries and deaths
(above).
Background of incident handling
Operation recovery during incident handling is important and Mass
Transit Railway (MTR) in Hong Kong proud herself for as the leading
railway operator for its safety and maintaining a high level of reliability.
East Rail Line, the oldest railway line in Hong Kong, came under
scrutiny from various stakeholders due to recent major incidents that led
to serious train delays in recent years.
Incidents in railway are rare but such incidents do occur when there
is a collision causing injury or loss of life, collision obstructing a running
track immobile under their own power and defect or failure considered by
railway officials and is likely to curtail train services for more than 20
minutes (According to Hong Kong gov’t standards).
References
• Kyriakidis, M., Hirsch, R. and Majumdar, A. 2012. Metro railway safety: An analysis of accident precursors. Safety Science.
[Online]. 50(7),pp.1535-1548. [Accessed 27 April 2017]. Available from: https://www.researchgate.net/profile/
Miltos_Kyriakidis/publication/257356112_Metro_railway_safety_An_analysis_of_accident_precursors/links/
55b12d7208ae092e964fe461/Metro-railway-safety-An-analysis-of-accident-precursors.pdf.
• MacDonald, I. 2014. East Rail Line [Online]. [Accessed 27 April 2017]. Available from: https://i0.wp.com/ijmacd.com/blog/
wp-content/uploads/2014/11/East-Rail-Line.png?w=770&ssl=1.
• MTR 2017. Glance of incident handling. Hong Kong: Sheung Shui Station.
• MTR 2017. MTR System Map [Online]. [Accessed 27 April 2017]. Available from: http://www.mtr.com.hk/en/customer/
images/services/MTR_routemap_510.jpg.
• ON.CC 2014. Dealing with stray animals within track areas [Online]. [Accessed 27 April 2017]. Available from: http://
hk.on.cc/hk/bkn/cnt/news/20140823/photo/bkn-20140823190746701-0823_00822_001_06p.jpg?212210.
• ON.CC 2016. Flooding under Pipe Burst [Online]. [Accessed 27 April 2017]. Available from: http://hk.on.cc/hk/bkn/cnt/news/
20160825/photo/bkn-20160825112225464-0825_00822_001_01b.jpg?20160826060051.
Map of MTR in Hong Kong (Above)
(Source: MTR)
Glance of Incident Handling (Above)
(Source: MTR)
Map of East Rail Line (Above)
(Source: Iain MacDonald)
Flooding under unexpected pipe burst (Above) (Source: ON.CC)
Dealing with stray animals within track areas (Below) (Source: ON.CC)](https://image.slidesharecdn.com/mastersdissertationposters2017-170517094532/85/Masters-Dissertation-Posters-2017-36-320.jpg)
![LEEDS
Establish Objectives
Leeds Network Modelling
(SATURN)
Traffic Analysis of base
case scenario
Current pollutant
emissions
Re-assignment of trips in
the network after
modelling the CAZ user
charges (SATURN)
Do Something pollutant
emissions
Traffic Analysis of Do
Something scenario
Analysis of findings
(overall change of
emission levels)
Health Impact Assessment
on school trips
Calculation of pollutant uptake
during school trips on car
routes for both scenarios Calculation of uptake on green
school routes under different
scenarios (e.g. Walking school
bus scheme)
Conclusion
Literature review
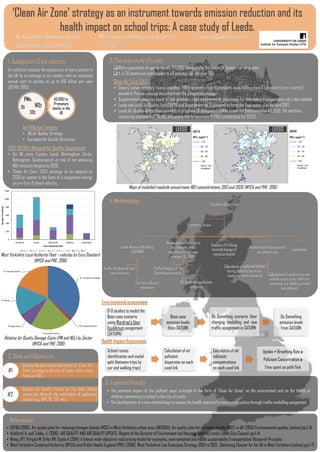
Clean Air Zone (CAZ)
✓ Class C action category: buses/coaches /HGVs to meet a Euro 6 standard, taxis/LGVs a Euro 6 (diesel) or Euro 4 (petrol)
standard. Private vehicles excluded from the congestion charge.
✓ Supplemental measures (park ’n’ ride schemes, road improvements, provisions for alternative transportation etc.) also needed.
✓ Leeds and Joint Air Quality Unit (DEFRA and Department for Transport) to form the final action plan by April 2017.
✓ Leeds Air Quality Action Plan currently in progress (6 designated AQMAs under the Environmental Act 1995, 10 real time
monitoring stations and 70 NO2 diffusion tubes to ascertain DEFRA’s predictions for 2020).
1. Background & Introduction
2015: DEFRA’s National Air Quality Assessment
• Six UK cities (London Leeds, Birmingham, Derby,
Nottingham, Southampton) at risk of not achieving
NO2 emission targets by 2020.
• ‘Clean Air Zone’ (CAZ) strategy to be adopted by
2020 or sooner in the form of a congestion charge
on pre-Euro 6 diesel vehicles.
2. Aims and Objectives
References
• DEFRA (2015). Air quality plan for reducing nitrogen dioxide (NO2) in West Yorkshire urban area (UK0004). Air quality plan for nitrogen dioxide (NO2) in UK (2015) Environmental quality. [online] pp.1-51
• Hickford, A. and Tubby, J. (2016). AIR QUALITY AND AIR QUALITY UPDATE. Report of the Director of Environment and Housing. [online] Leeds: Leeds City Council, pp.1-14
• Wang JYT; Ehrgott M; Dirks KN; Gupta A (2014) A bilevel multi-objective road pricing model for economic, environmental and health sustainability Transportation Research Procedia
• West Yorkshire Combined Authority (WYCA) and Public Health England (PHE) (2016). West Yorkshire Low Emissions Strategy 2016 to 2021, Delivering Cleaner Air for All in West Yorkshire [online] pp.1-71.
‘Clean Air Zone’ strategy as an instrument towards emission reduction and its
health impact on school trips: A case study of Leeds.
By: Konstantina Athanasia Kouroupi MSc Transport Planning and Engineering e-mail: ts16kak@leeds.ac.uk
Supervised by Dr. Judith Wang Year 2016/17
3. The case study of Leeds
Air pollution reduces life expectancy of every person in
the UK by an average of six months, with an estimated
annual cost to society of up to £16 billion per year
(DEFRA, 2015).
40.000/yr
Premature
deaths in the
UKSO2
NO2
PMn
O3
West Yorkshire Local Authority Fleet – vehicles by Euro Standard
(WYCA and PHE, 2016)
Relative Air Quality Damage Costs (PM and NOx) by Sector
(WYCA and PHE, 2016)
Maps of modelled roadside annual mean NO2 concentrations 2013 and 2020 (WYCA and PHE, 2016)
5. Expected Results
• The potential impact of the ‘polluter pays’ principle in the form of ‘Clean Air Zones’ on the environment and on the health of
children commuting to school in the city of Leeds.
• The development of a new methodology to assess the health impact of a road pricing policy through traffic modelling assignment.
Air Pollution Targets
• UK Air Quality Strategy
• European Air Quality Directives
LEEDS LEEDS
O-D studies to model the
Base case scenario
using Wardrop’s User
Equilibrium assignment
(SATURN)
Base case
emission levels
from SATURN
Do Something scenario: User
charging modelling and new
traffic assignment in SATURN
Do Something
emission levels
from SATURN
Health Impact Assessment
Environmental assessment
School routes
identification and modal
split (between trips by
car and walking trips)
Calculation of air
pollutant
dispersion on each
used link
Calculation of air
pollutant
concentrations
on each used link
Uptake = Breathing Rate x
Pollutant Concentration x
Time spent on path/linkAssess the environmental impact of ‘Clean Air
Zone’ strategy in the city of Leeds, with a main
focus on N02.
Assess the health impact on the daily school
commutes through the estimation of pollutants
uptake (e.g. UFP, BC, CO, etc).
#1
#2
With a population of approximately 774,000, Leeds is the 3rd worst UK hotspot for air quality.
1 in 20 deaths are attributable to air pollution for the over 30s.
4. Methodology](https://image.slidesharecdn.com/mastersdissertationposters2017-170517094532/85/Masters-Dissertation-Posters-2017-37-320.jpg)
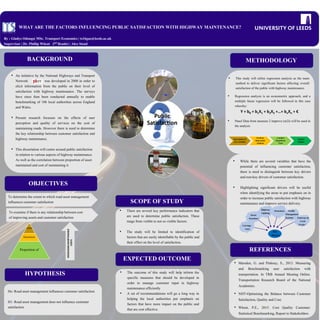
![Does Traffic Noise have a Negative Impact
upon Satisfaction with Public Spaces?
Background
• Previous literature has mainly focused on
residential satisfaction with noise, with relatively
little focus given to similar comparisons
between noise and satisfaction with public
space.
Research Aim
• To investigate to what extent traffic noise
impacts upon satisfaction with public spaces by
combining questionnaires with noise
measurements.
Methodology
• Initial noise measurements (Table 1).
• A combination of questionnaires of public space
users and objective noise measurements from a
fully calibrated, industry-standard noise meter
(Figure 1; Norsonic, 2017) set up on a tripod.
• Questionnaires will be conducted near-
simultaneously with noise measurements,
ensuring data is as reliable as possible.
• Data collection will take place over 9 days, with 3
locations at each site (Table 1).
• Data will be analysed to investigate to what
extent there exists an association between noise
and satisfaction with public spaces.Key Literature
• Residential satisfaction/quality of life are
negatively affected by traffic noise (Botteldooren
et al., 2011; Urban & Máca, 2013).
• Green space can offset dissatisfaction with noisy
residential areas (Reidel et al. 2013, Lakes et al.,
2013). This suggests if green spaces are also
noisy, annoyance could be exacerbated.
• Pervasive background noise negatively affects
the overall soundscape of a public square (Yang
& Kang, 2005a)
• Perceptions of noise in public squares differ
depending on the type of noise being heard
(birds singing is seen as positive, traffic noise
negative (Yang & Kang, 2005b).
Student: Luke Summers (200900221)
Supervisor: Dr Eva Heinen
Second Marker: Dr John Nellthorp
INITIAL SCOPING NOISE MEASUREMENTS (3MINS)
Location Average
(Min, Max)
Woodhouse Moor Queen Victoria Statue
(Fig 2)
60 (40, 74)
Woodhouse Moor West (Hyde Park Rd.) 56 (29, 72)
Woodhouse Moor Centre (Fig 3) 52 (44, 72)
Park Square NE Corner (Fig 4) 58 (40, 68)
Park Square Centre 56 (41, 70)
Park Square SW Corner 55 (32, 66)
Roundhay Park Path nr. Car Park (Fig 5) 66 (39, 84)
Roundhay Park Bowling Green 61 (30, 75)
Roundhay Park Steps nr. Cricket Pitch
(Fig 6)
48 (35, 67)
References
Botteldooren, D., Dekoninck, L. & Gillis, D. 2011. The Influence of Traffic Noise on Appreciation of the Living Quality of a Neighbourhood. International Journal of Environmental Research and Public Health. 8(1), pp. 777-798.
Howley, P., Scott, M. & Redmond, D. 2009. Sustainability Versus Liveability: An Investigation of Neighbourhood Satisfaction. Journal of Environmental Planning and Management. 52(6), pp. 847-864.
Norsonic. 2017. Sound Analyser Nor140 – New Version 4.0. [Online] [Accessed 24/02/2017]. Available from: http://www.norsonic.com/en/products/sound_level_meters/sound_analyser_nor140/Sound+Analyser+Nor140+-+New+version+4.0.9UFRjQYk.ips
Riedel, N., Scheiner, J., Müller, G. & Köckler, H. 2013b. Assessing the Relationship between Objective and Subjective Indicators of Residential Exposure to Road Traffic Noise in the Context of Environmental Justice. Journal of Environmental Planning and Management. 57(8), pp. 1398-1421.
Urban, J. & Máca, V. 2013. Linking Traffic Noise, Noise Annoyance and Life Satisfaction: A Case Study. International Journal of Environmental Research and Public Health. 10(5), pp. 1895-1915.
Yang, W. & Kang, J. 2005a. Acoustic Comfort Evaluation in Urban Open Public Spaces. Applied Acoustics. 66(2), pp. 211-229.
Yang, W. & Kang, J. 2005b. Soundscape and Sound Preferences in Urban Squares: A Case Study in Sheffield. Journal of Urban Design. 10(1), pp. 61-80.
Figure 1 (Norsonic, 2017) Figure 2: WM Statue Path Figure 3: WM Centre
Figure 4: PS NE Corner Figure 5: RP Car Park Path Figure 6: RP Steps
Table 1: Noise measurement locations and results from smartphone
measurements. Methodological Risks
• Weather: Wind and heavy rain can negatively
impact the study due to their high noise level, and
lead to fewer public space users. Weather
forecasts will be consulted for suitability prior to
data collection days.
• Other noise sources: e.g. roadworks, loud music
etc. can influence noise measurements. An
element of flexibility will be applied to location
should this be an issue.
• Noise Meter: Participants may recognise the noise
meter which could influence responses.
Equipment will be hidden to prevent this.](https://image.slidesharecdn.com/mastersdissertationposters2017-170517094532/85/Masters-Dissertation-Posters-2017-41-320.jpg)
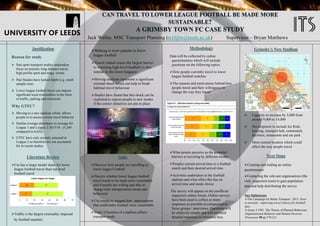
![Factors and Formulation of Optimal Fares of an Airport Rail
Link in Thailand: A case Study of Airport Rail Link Extension
Don Mueang-Bang Sue Project
Mananya Srisaeng, MSc Transport Economics
Supervisor: Daniel Johnson
Background
• Airport Rail Link (ARL) system has started to run the service since August 23rd 2010. The system includ-
ed the service of Airport City Line and Airport Express Line system. However, the express line system
was stopped in 2014 due to low numbers of ridership (State Railway of Thailand, 2015).
• Suvarnabhumi Airport Rail Link with City Air Terminal Project (Phaya Thai-Bang Sue-DonMueang) is an
extended project from the existing ARL network (Phaya Thai-MakKa San- Suvarnabhumi), undertak-
en by State Railway of Thailand (SRT). The project will be a double track rail network from Phaya Thai to
Don Mueang with total distances of 22 km including 14 km of Bangsue-Don Mueang route in order to
enhance the rail network in bangkok and metropolis areas connecting to two main airports of Thailand
(State Railway of Thailand, 2015).
• Congestion problem
• Don Mueang airport – Suvarnabhumi airport (47.5 km): Taxi/car (1 - 2 hrs) with approximate price
of £10, bus/van (1 - 2 hrs) with approximate price of £2, free shuttle provided by the airport (1 - 2
hrs)
• Don Mueang airport – Central Bangkok (23 km): Taxi/car (1-2 hrs) with approximate price of £6,
bus/van (1-2 hrs) with approximate price of £2, Taxi+Metro train (45 mins - 1 hr) with approximate
price of £3 - £4
Objectives
• To define what factors do influence rail transport fares and how those factors might be reflected in
the fares of travel to indicate the optimal fares for ARL in order to increase demand of ARL.
• To recommend measures to determine the optimal fares for rail system in Thailand.
• To maximise social welfare by an aforementioned project of the case study.
KeyQuestions
• How do fares of ARL impact demand function?
• How to develop the rail fare model to apply the pricing methods (First-best pricing/ Second –best
pricing) in the case study?
Methodology
• Aggregate Model: The aggregate models represent dependent variables correlated with independent
variables which are applied to rail demand studies (Warman, 2005);
• Exogenous variables (GDP, demographic, car ownership, employment status)
• Fare
• Rail service quality (travel time, frequency, number of interchange)
• Substitutive services (taxi, bus)
• Generating demand function to consider how correlative variables impact the demand of ARL.
• Initial Demand Model:
Note that F, T and C are fare of rail, travel time by car and cost of car between station i and j respectively.
GJT is generalised journey time. G, P and H denote GDP, population and an proportion of households that
have cars. μ is constant variable. The other parameters are elasticities (Wardman, 2006).
Appraisal
• To consider a range of scenarios and linking the demand model results to define the net benefits be-
tween those scenarios for the best outcome.
• Total social costs: marginal infrastructure usage, air pollution, noise, climate change, congestion,
accident cost
• Total Revenue
• To find diversion factors to estimate the new share of transport modes for the new ARL project for cal-
culating a number of impacts outlined in the appraisal framework.
DataRequirements
• Regarding the demand model above, all data of those variables should be required. This poster pro-
vides some data generally.
• Socio-Economic data in Bangkok
References
• National Statistical Office (NSO), 2015. NI, QGDP, GPP . [Online]. [Accessed 8 April 2017]. Available from: http://service.nso.go.th/nso/web/statseries/statseries15.html
• Office of the National Economic and Social Development Board (NESDB), 2015. Gross Regional and Provincial Product (GPP). [Online]. [Accessed 8 April 2017]. Available from: http://www.nesdb.go.th/nesdb_en/more_news.
php?cid=156filename=index
• State Railway of Thailand. 2015. Draft Final Report Airport Rail Link Extension Don Mueang-Bang Sue. Unpublished.
• Wardman, M. 2006. Demand for rail travel and the effects of external factors. Transportation Research Part E: Logistics and Transportation Review, 42(3), pp.129-148.
• Warman, E. 2005. Development of Rail Fare Model. Dissertation. University of Leeds.
(NESDB,2015;NSO,2015)
• PreviousstudyofdailydemandforecastofARL(passenger/year)
Year GDP (£million)
Number of
Population
Income Per Capita
(£)
2014 94,453.14 8,581,548.85 8,796.27
2015 100,850.11 8,643,230.14 N/A
2016 N/A N/A N/A
Route 2022 2032 2042
Suvarnabhumi Airport-Phaya Thai 321,500 589,400 651,000
Bangsue-Don Mueang Airport
(City Line)
420,300 725,600 801,300
Bangsue-Don Mueang Airport
(Express Line)
43,800 69,500 76,700
(StateRailwayofThailand,2015)
Figure 1: Map of the case study project (State Railway of Thailand, 2015)
Figure2:DemandforecastsforDonMueangairportandSuvarnabhumiairport(AirportofThailand2015,citedinStateRailwayofThailand,2015)](https://image.slidesharecdn.com/mastersdissertationposters2017-170517094532/85/Masters-Dissertation-Posters-2017-42-320.jpg)

![Research Questions
• How much do pedestrians rely on technology?
• Technology over instinct?
• What matters most?
Assessing the impacts of GPS applications on pedestrian
route choice in terms of comfort, efficiency and safety.
Collecting Data through Q Methodology
- Q studies explore correlations between persons or whole aspects
of persons.
- Q methodology combines qualitative and quantitative methods
to investigate the subjective views of those directly involved in a
particular topic.
(Coogan, J., Herrington, N. 2011)
Establish a
research
question
1 Statements that
represent
various points
of view
2
Sort into categories
and sub-categories
to identify duplicates
3
Run pilot study
to ensure that
the statements are
clear enough
4
Each user sorts
statements
according to the
Q-grid
5
AgreeDisagree
Neutral
0-1-2-3 +1 +2 +3
6
Run factor analysis
to identify similarities
between participants.
Sample Q-Sort that reflects the
most common responses of
participants
Part A
Understanding how pedestrians act?
Part C
200980017 - Miguel Plata Carreon
MSc Transport Planning and the Environment
Supervisor: Professor Samantha Jamson
Second Reader: Dr. Oliver Carsten
Interviews
Existing research
The analysis will focus on young adult pedestrians and the
importance that they give to the selected factors:
Comfort, Efficiency, Safety
Users will be selected when meeting the following criteria:
- They are currently students
- The majority of their trips are made by walking
- They have used an existing GPS app previously
Scope
Using the sample Q-sort, suggestions will be made on
how to improve the availability of routes on GPS
applications.
Typically GPS apps show available routes based on
distance and time of arrival
Research Objectives
• Understanding route choice based on importance
given to three factors:
Comfort – Is the route enjoyable?
Efficiency – Is the route fast and accessible enough?
Safety – Is the route safe enough?
• Find out how GPS apps can improve route selection
based on user experience in the three mentioned areas.
Interpreting and Suggesting
Part B
Steps for Q Methodology
Comfort
Incorporating user experience can be help develop a
better way of presenting routes for users, taking into
account other factors such as the ones studied.
Safety
Time
Distance
Time
Distance
At night, I’d rather take
a better lit route, even
if it takes longer.
If in a hurry, I don’t really
mind the route that gets
me there in time
I walk as little as
possible, I don’t
mind the route
I would rather go
through the park than
through a busy road
Statement Examples
References:
Coogan, J. Herrington, N. 2011. Q methodology: an overview. University of East London. Research in secondary education. Vol 1. 2 pp. 22-48
Watts, S. Stenner, P. 2005. Doing Q methodology: theory,method and interpretation. Qualitative Research in Psychology. 2. pp. 67-91
Google Maps 2016. City of Leeds. [Accessed 22 April 2017]. Available from: https://www.google.co.uk/maps/@53.8077453,-1.5584167,15.75z?hl=es
Institute for Transport Studies](https://image.slidesharecdn.com/mastersdissertationposters2017-170517094532/85/Masters-Dissertation-Posters-2017-45-320.jpg)
![Define Measure Analyse Improve Control
DMAIC Cycle for Railway Capacity Utilisation Research
• “Measure”, as the fundemental process, is the key study
scope in this dissertation.
Railway travel demand has increased rapidly since 1994.
Railway capacity challenge. The conflict between
enormous growth in rail travel demand and limited infrastructure.
• The limitation of current measure of railway capacity
utilization (CUI Method) caused capacity waste.
• Capacity Utilisation measure has significant
effects on all processes of railway operating.
• The CUI Method is no longer suitable, which
requires uniform speed and single type train,
with limited information provided.
Capacity
Waste
Outdated
Method
Significant
effects
● Locate the limitation of current measure - CUI Method.
3. RESEARCH SCOPE
Study focus:
4. CASE STUDY
South West Mainline: London - Southampton Central
• Major commuter and congested route towards London.
• Predict demand in this section would be over capacity in 2030.
• Capacity utilisation waste is occuring on this train line: lowest
CU= 30.10% in some stops, average CU= 59.51%.
• Data source: National Rail Data Feeds; South Western Rail.
• Data: i.e. Station layout, headway time, speed, timetale.
5. METHODOLOGY
2. PROBLEMS OBEJECTIVES
Problems:
Ø Objectives:
Main Scope of Study:
1. BACKGROUND
UK Government Proposals on railways
• In 2000, railway system revitalization.
• From 2007, High Speed Rail Projects were carried out.
Integrated methodology = analytical method + optimization
Start
Input:
1. Build up Infrastructure
2. Build up Timetable Graphs
3. Divide rail line into sections
4. Timetable Graphs Compression
Optimisation:
Timetable
compacted
method algorithm
Output:
3.Compressed trains paths
4.Graphic numerical output
2. Using idle capacity for more trians
Step1
Step2
End
Input:
1. Compressed total timetable
(Output from Step1)
Plan of operating capacity as actual consumption
An integrated enhanced measurement for CU
References:
[1] Abril, M., Barber, F., Ingolotti, L., Salido, M.A., Tormos, P. and Lova, A., 2008. An assessment of railway capacity. Transportation Research Part E: Logistics and Transportation Review, 44(5), pp.774-806.
[2] Confessore, G., Liotta, G., Cicini, P., Rondinone, F. and De Luca, P., 2009, December. A simulation-based approach for estimating the commercial capacity of railways. In Simulation Conference (WSC),
Proceedings of the 2009 Winter (pp. 2542-2552). IEEE.
[3] Landex, A., Schittenhelm, B., Kaas, A.H. and Schneider-Tilli, J., 2008, January. Capacity measurement with the UIC 406 capacity method. In Proceedings of the 11th International Conference on Computers
in Railways (p. 55).
[4] Leaflet, U.I.C., 406-Capacity. International Union of Railways (UIC). Paris, 2004. ISBN 2-7461-0802-X.
[5] Sameni, M.K., 2012. Railway Track Capacity: Measuring and Managing.
[6] Office of Rail and Road, 2016, Passenger Rail Usage 2015-16 Annual Report.
[7] South Western Mainline, 2016, London Waterloo, Southampton, Bournemouth, Poole and Weymouth Railway Network Map.
Min Fu - MSc Transport Planning | Supervisor - Dr Ronghui Liu | Co-Supervisor - Dr Anthony Whiteing
Sustainability
environment
Higher
fuel costs
Privatisation
Road
Congestion
CU measure affects all procedures in railway system,
including market, line, timetable and rolling stock.
Key focus: Evaluated by the effects on line planning
operating and timetabling.
Key concern: Providing decision-supporting for Tactical
planning (meduim term), i.e. timatabling, fares,
infrastructures and vehicles numbers.
Output:
5.Compressed total timetable
6.Minimum headway time
7.Measured capacity consumption
[6]
[5]
[7]
[6]
[5]
[5]
[1]
[5]
[7]
[2]
[2]
[3]
[4]
[3]](https://image.slidesharecdn.com/mastersdissertationposters2017-170517094532/85/Masters-Dissertation-Posters-2017-46-320.jpg)
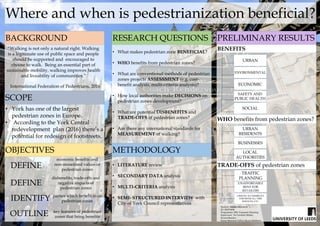
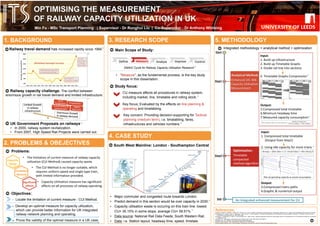
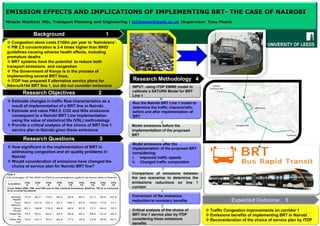
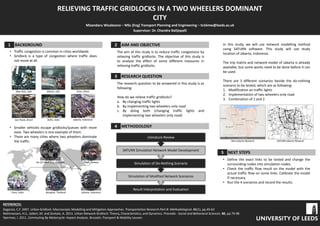
![Methodology
-
Secondary analysis
of Better Points
data from the
‘Better Travel’
programme funded by
‘Transition Cities’.
Users downloaded the app
and tracked all sustainable
travel activities.
• Majority of gamification research has involved meta-
analysis of multiple apps.
• Lack of detailed analysis into individual apps.
• Samples skewed towards younger people who are
less likely to drive or make independent travel
decisions.
Gamification
‘The use of game design elements in non-game
contexts’ (Deterding et al., 2011, p.2)
Objective
To examine the potential of gamification, through
_ the app ‘Better Points’, in inducing modal shift to
walking.
The efficacy of gamification to encourage walking: a study of Better Points
Olivia Hockney, MSc Transport Planning Supervisor: Frances Hodgson 2nd Reader: Susan Grant-Muller
Research Questions
• To what extent does gamification combat the cost
of walking?
• How long does the impact of gamification last?
• For which groups of people does gamification work best
(age, gender, accommodation type, ethnicity, family,
occupation)?
• How does incentivising walking with gamification compare
with other modes?
• How do the impacts of gamification on known car users
compare with other groups?
Theory of Planned behaviourIntroduction
• It is asserted that people today are generally
more sedentary due to an aging population,
unplanned urbanisation and globalisation
(WHO, 2010).
Gamification
Elements
Leader
Boards
Levels
Digital
Rewards
Real-world
Prizes
Competitions
Social/Peer
Pressure
• In England, between 1975-2003 total walking distance per
person reduced by approximately 25% resulting in health
and environmental implications (Butland et al., 2007)
• It is becoming increasingly important for authorities to
encourage modal shift to active travel.
Literature Review
• Little research so far specifically examining
gamification, especially in regard to apps
• Existing literature has not provided a definitive
conclusion as to whether this method is
successful.
Subjective norm
e.g. Leaderboards, tracking
friends or social media link
Attitude toward the behaviour
e.g. Financial reward
Perceived Behavioural Control
e.g. Route advice
Intention Behaviour
Gamification apps have the potential to influence at several
stages of this model.
The Incentive
The Better Points app allows
users to track sustainable
travel journeys: walking,
cycling, public transport and
car sharing.
Earn two points per
minute for up to 150
minutes per week
These points can be spent on
shopping vouchers or donated
to national charities and
community causes.
The Study
• Data was collected from
May-September 2016.
• Users were split into two
groups:
• Transition Cities
(regular car
drivers)
• Better Travel
(control group)
Lister et al. (2014)
Azjen (1991: p. 182)
Better Points Interface (Better Points, 2017)
Better Points (2017)
References
Ajzen, I. 1991. The Theory of Planned Behaviour. Organisational Behaviour
and Human Decision Processes. [Online]. 50, pp. 179-211. [Accessed 23
October 2016]. Available from: https://tinyurl.com/nx895nr
Better Points. 2017. Better Points Resource Space. [Accessed 25 April
2017]. Available from: https://tinyurl.com/nxztxpx
Butland, B., Jebb, S., Kopelman, P., McPherson, K., Thomas, S., Mardell, J.
and Parry, V. 2007. FORESIGHT: Tackling Obesities: Future Choices – Project
Report 2nd Edition. [Online]. London: Government Office for Science.
[Accessed 30 October 2016]. Available from: https://tinyurl.com/o9bq9fu
Deterding, S., Khaled, R., Nacke, L.E. and Dixon, D. 2011. Gamification:
Toward a Definition. https://tinyurl.com/ly6xwbo
Lister, C., West, J., Cannon, B., Sax, T. and Brodegard, D. 2014. Just a Fad?
Gamification in Health and Fitness Apps. Journal of Medical Internet
Research. [Online]. 2(2), pp. [Accessed 20 October 2016]. Available from:
http://games.jmir.org/2014/2/e9/
World Health Organisation. 2010. Global Recommendations on Physical
Activity for Health. [Online]. Geneva: World Health Organisation. [Accessed
22 October 2016]. Available from:
https://tinyurl.com/mkaln8n
Participants Female Male Average Age
Transition Cities 61 22 18 36.03
Better Travel 63 18 12 38.15](https://image.slidesharecdn.com/mastersdissertationposters2017-170517094532/85/Masters-Dissertation-Posters-2017-52-320.jpg)
![The
Future
of
Online
Shopping
Presented
by:
Pengyu
Wu,
MSc
Transport
Planning
and
the
Environment
Supervisor:
Greg
Marsden,
Second
reader:
Zia
Wadud
Objectives
Research
Questions
Scope
of
the
research
Methodology
References
With the development of the internet, the shopping style has been
changed gradually since the first shopping online order happened several
decades ago. Online shopping is a type of electronic business which helps
consumers to directly buy goods or services from a seller over the Internet
using a web browser. Consumers can find a product of interest when they
are visiting the shopping websites, which provide various goods from
different online retailers (Liu, 2017).
Advantages of online shopping: information and reviews; convenience;
price and selection.
There has been a strong growth in on-‐line shopping in the past decade in
many countries. Figure 1 is a typical example about China with an
increasing online shopper population.
Some popular goods people often buy online such as clothing, cosmetics,
home appliances, books and food (see Figure 2).
Figure 3 shows the percentage of different takeaways in the UK.
How
do
consumers
usually
shop
online?
What
do
they
most
commonly
buy
online?
How
often
do
they
shop
online?
How
much
do
they
usually
spend
on
online
shopping
in
a
month?
Why
do
they
prefer
to
shop
online
rather
than
shop
in
the
physical
store?
How
often
do
they
take
away
food
and
what
kind
of
food
would
they
like
to
take
away?
What
might
this
mean
for
transport?
Might
it
have
an
influence
on
the
environment
as
the
rise
of
takeaway
food?
How
is
it
going
to
influence
the
transport?
This study will mostly focus on consumers behaviour, especially the
behaviour of students who is studying in University of Leeds. Consumers
might have different motivations and depending on how they combine
with each other they might lead to a different behaviour (Pappas et al.,
2016). Students are supposed to be the group of people who have
strong learning skills and innovative minds. Also, the online
questionnaire will be much easier to carry out when the respondents
are university students.
The online shopping item will be focused on food including meals,
snacks and drinks.
This study will also research take away food from different restaurants in
Leeds. There has been a growth in take away sales in the UK recently.
Britain will spend almost £8bn a year on takeaways by the end of the
decade because the time-‐pressed households cooking fewer meals
boosts the country’s predilection for takeaway food (Ruddick, 2015).
Literature
review
Online
questionnaire
and
data
collection
The online questionnaire will work with the help of tweets to get
more respondents involved to reduce the sample biases and
collect the representative data from students (e.g. international or
UK students).
Data
analysis
and
discussion
The
data
is
going
to
be
analysed
by
Excel
or
SPSS.
Conclusion
To study the consumers behaviour about online shopping.
To study the online shops or physical shops which provide the
delivery service.
To study consumers’ thoughts about the differences between
online shops and physical shops especially when it comes to
food sector.
To study the environmental consequences caused by takeaway
food.
To guess or predict the online shopping trend in the future by
analysing and comparing the past and current online shopping.
Background
Pappas, I.O., Kourouthanassis,P.E., Giannakos,M.N. and Lekakos,G. 2016.Telematics
and Informatics The interplay of online shopping motivations and experiential
factors on personalized e-‐commerce: A complexity theory approach. Telematics
and Informatics. [Online]. Available from:
http://dx.doi.org/10.1016/j.tele.2016.08.021.
Liu, C., Hsieh, A., Lo, S. and Hwang, Y. 2017. Computers in Human Behavior What
consumers see when time is running out : Consumers ’ browsing behaviors on
online shopping websites when under time pressure. Computers in Human
Behavior. [Online]. 70,pp.391–397. Available from:
http://dx.doi.org/10.1016/j.chb.2016.12.065.
Tsang, A. 2014. E-‐tailing in China: a strategic overview, HKTDC Research, viewed 5
April 2017.
Ruddick, G. 2015. Food takeaway sales forecast to hit £8bn with smartphone boost.
The Guardian. [Accessed 23 April 2017].
Mccan, J. 2013. Takeaway UK: Average Brit is now spending £1,320 a year on fast
food buying 12 meals every month. Daily Mail, viewed 23 April 2017.
Figure
1:
Growth
in
online
shopper
population
of
China
(Tsang,
2014)
Figure
2:
Products
purchased
by
online
shoppers
in
China
2012
(Tsang,
2014)
Figure
3:
British
favorite
takeaways
(Mccann,
2013)](https://image.slidesharecdn.com/mastersdissertationposters2017-170517094532/85/Masters-Dissertation-Posters-2017-53-320.jpg)
![CONTEXTUAL BACKGROUND
In 2015, the World Health Organisation (WHO) estimated the road
deaths in India at 207,531, at 16.6 road deaths per 100,000
population (Global Status Report on Road Safety 2015, 2015).
Midway through the United Nations Decade of Action for Road Safety
2011-2020 in 2015, India signed the Brasilia Declaration through
which it has committed to halve road accident fatalities by 2020.
Following a public interest litigation (PIL) in 2014, the Supreme Court
(SC) of India constituted a Committee on Road Safety to monitor and
measure implementation of road safety laws. Also, the SC has since
made several ‘landmark’ judgements including directives on good
Samaritan laws, prohibition of alcohol shops within 500 metres of
National Highways, etc. However, pedestrian road safety (Table 1)
which is a major social, economic and public health issue doesn’t
appear to have any elicited specific attention yet.
Table 1: Discrepancies in data from different sources - Estimates of pedestrian share of
road fatalities in India
THEORETICAL BACKGROUND
Political system, policy design and characteristics of the target
population affect the implementation context and this (along with
the distinctness of pedestrian road safety involving the central
government (legislation), local government (municipal corporation)
and state government (traffic police and urban transport
department)) necessitates a case study of these specific context to
model the policy implementation (Meyers Nielsen, 2012) (Figure
1). An understanding of both the legal provisions and power relations
– both legal and real, hierarchically both vertically and horizontally -
between stakeholders in the specific context of pedestrian road
safety in metropolitan cities is essential to formulate any informed
approach to address the evidence-to-action gap in this regard.
RESEARCH OBJECTIVE
To study the legal, institutional and discretionary dynamics of the
‘policy implementation context’ for pedestrian road safety in Indian
metropolitan cities with an aim to formulate a theoretical and
context-specific policy implementation framework to help inform
research and policy.
Prashanth D. Udayakumar | 201058088 | ts16pdu@leeds.ac.uk | MSc Transport Planning 2016-17
TRAN5911M Transport Dissertation, Institute for Transport Studies, Faculty of Environment
Supervisor: Louise Reardon | Second Reader: Gregory Marsden | Module Leader: Jeremy Shires
Pedestrian Road Safety: Towards a Policy Implementation Framework for
Metropolitan Cities in India
India Overall WHO/MoRTH (2015) ~9%
Hsiao et al. (2013) 37%
Mohan et al. (2015) 33%
Mumbai [2008-12] Mohan et al. (2015) 58%
Delhi [2013] Mohan et al. (2015) 47%
Figure 1: Skeletal Flow Diagram of Variables involved in Implementation Process (Sabatier, 1986)
METHODOLOGY AND DATA COLLECTION (Figure 2)
Applying Sabatier’s (1986) and Matland’s (1995) synthesis frameworks for
policy implementation on the central legislations concerning pedestrian safety
and Brasilia Declaration target in the example of southern Indian metropolitan
cities Bengaluru (~725 pedestrian deaths in 2014) and Chennai (~1050
pedestrian deaths in 2014), we use interviews and secondary data research to
study the “relationship between the politics of the legislative processes and
the administration of the resulting laws” (Meyers Nielsen, 2012, p.305) and
the “incentive and contractual structures that align the interests of
implementing agents with policy-making principals” (p.305) to formulate a
policy implementation framework and frame recommendations.
Potential challenges for the study could be (i) balance between detail (given
time constraints) and robustness of two-case embedded design, (ii) availability
of sufficient number of interviewees.
REFERENCES
Hyder, A.A., Allen, K.A., Pietro, G.D., Adriazola, C.A., Sobel, R., Larson, K. and Peden, M. 2012. Addressing the Implementation Gap in Global Road Safety: Exploring
Features of an Effective Response and Introducing a 10-Country Program. American Journal of Public Health. 102(6), pp.1061-1067. | Lipsky, M., 1983. Street-Level
Bureaucracy: The Dilemmas of the Individual in Public Service. New York: Russell Sage Foundation. https://muse.jhu.edu/ (accessed April 5, 2017) | Meyers, M. K.
Nielsen, V. L., 2012. Street-Level Bureaucrats and the Implementation of Public Policy. In: B. G. Peters J. Pierre, eds. The SAGE Handbook of Public Adminisration. New
Delhi: SAGE Publications Limited, pp. 305-318. | Sabatier, P. A., 1986. Top-Down and Bottom-Up Approaches to Implementation Research: A Critical Analysis and
Suggested Synthesis. Journal of Public Policy, 6(1), pp. 21-48. | Tetali, S. et al., 2013. Qualitative study to explore stakeholder perceptions related to road safety in
Hyderabad, India. Injury: International Journal of the Care of the Injured, 44(4), p. S17–S23.
Stages (Dependent Variables) in the Implementation Process
Tractability of the Problem
1. Availability of valid technical theory and technology
2. Diversity of target-group behaviour
3. Target group as a percentage of the population
4. Extent of behavioural change required
Ability of Statute to Structure
Implementation
1. Clear and consistent objectives
2. Incorporation of adequate causal theory
3. Financial resources
4. Hierarchical integration with and among
implementing institutions
5. Decision-rules of implementing agencies
6. Recruitment of implementing officials
7. Formal access by outsiders
Non-statutory Variables affecting
Implementation
1. Socioeconomic conditions and
technology
2. Media attention to the problem
3. Public support
4. Attitudes and resources of
constituency groups
5. Support from sovereigns
6. Commitment and leadership skill of
implementing officials.
Policy Outputs of
Implementing Agencies
Compliance with
policy outputs by
target groups
Actual impacts of
policy outputs
Perceived
impacts of policy
outputs
Major revision in
statute
Figure 2: Methodology, Data Collection and Case Study Design
Expected
Results
Develop
Theory
Select
Cases
Design Data
Collection
Protocol
Bengaluru
Chennai
Individual
case report
Individual
case report
Write cross-case
report
Develop policy
implications
Modify theory
Make cross-case
conclusions
Case Study Design Methodology (Yin, 2009): (i) Exploratory case study; (ii) Analytic generalisation from
case study to theory; (iii) Construct validity, Internal validity, External validity Reliability; (iv) Literal
versus theoretical replication; (v) Multiple-case embedded design, (vi) Mixed methods research
Syntheses of top-down and bottom-up policy implementation approaches (Sabatier, 1986; Lipsky, 1980;
Meyers and Nielsen, 2012); Advocacy-Coalition Ambiguity-Conflict Models (Matland, 1995)
EVIDENCE-TO-ACTION
GAP
Semi-structured telephonic interviews (10*2)
Secondary data research and analysis
Snowball sampling
Supreme Court Committee (2014); Supreme Court Judgements
Brasilia Declaration (2015); Indian Penal Code (1860), Motor
Vehicles Act (1988), Rules of the Road Regulation (1989) and
National Urban Transport Policy (2006)
Guidelines for Road Safety Audit, Guidelines for Planning and
Implementation of Pedestrian Infrastructure and Comprehensive
Traffic Transportation Plan for Bengaluru (2007)
Define and Design Prepare, Collect Analyse
Analyse
Conclude
Research
Design
Data
Collection
Data Sources
News Media NGO Literature
Interviews with legal policy
experts, government officials at
central city levels, traffic police,
NGOs, users
Legislations and Policies
Pedestrian accident
statistics; Data on
Pedestrian Infrastructure
NGOs
Central, state
and local
governments
Judiciary
Pedestrians
Meaning of Successful Implementation (Matland, 1995)
Theory
RS-10 Study Results: Hyder et al.
(2012), Tetali et al. (2013)
Moderate policy ambiguity low
policy conflict: Administrative/
Experimental implementation
Policy
evolution
AccidentStatistics
Two-case
embedded
case study
design
Case Study
Method
(Yin, 2003)
Biswarup Ganguly [GFDL (http://www.gnu.org/copyleft/fdl.html) or CC BY 3.0 (http://creativecommons.org/licenses/by/3.0)], via Wikimedia CommonsBy Ville Miettinen from Helsinki, Finland (Laxmi street) [CC BY 2.0 (http://creativecommons.org/licenses/by/2.0)], via Wikimedia Commons© vbel71 / Adobe Stock© Philophoto / Adobe Stock© Игор Чусь / Adobe Stock © TheFinalMiracle / Adobe Stock © suman / Adobe Stock](https://image.slidesharecdn.com/mastersdissertationposters2017-170517094532/85/Masters-Dissertation-Posters-2017-54-320.jpg)
![BACKGROUND
Pavement evaluation is generally divided into structural and
functional properties. Functional aspect covers pavement quality to
provide good riding (Evdorides, 2013)
Road surface smoothness can be judged subjectively depending on
visual inspection or evaluator experience (Ibrahim, 1997) or be judged
objectively through empirical measurement.
Indonesia Integrated Road Management System (IIRMS) merely cover
Road Network Inventory, Road Condition Survey, Traffic Survey and
IRI (International Roughness Index)
There is a gap on assessing complete functional properties, i.e Skid
Resistance aspect
North Coast Line (Jalur Pantai Utara-Pantura) in Java Island Indonesia
has significant role in land transport since it accommodates 20,000-
70,000 vehicles per day.
OBJECTIVES
Objectively assess road functional performance with the support
of IRI and Surface Distress Index (SDI)
Determine appropriate action in preserving road condition
Assessing the absence of Skid Resistance aspect and its
implication on road user’s safety
REFERENCES
Andriejauskas, et. al, 2014. Evaluation of Skid Resistance Characteristics and Measurement Methods. [Online]. Vilnius, Lithuania. [Accessed 01 March 2017]. Available from:
http://leidykla.vgtu.lt/conferences/ENVIRO_2014/Articles/4/141_Andriejauskas.pdf
Departement for Transport. 2002. Design Manual for Roads and Bridges (DMRB) Volume 7 Pavement Design and Maintenance. [Online]. London, UK. [Accessed 22 February 2017]. Available from:
http://www.standardsforhighways.co.uk/ha/standards/dmrb/vol-7/index.htm
Highways Agency. 2009. Network Management Manual. [Online]. Manchester, UK. [Accessed 22 February 2017]. Available from: http://www.standardsforhighways.co.uk/ha/standards/nmm_rwsc/index.htm
Pearson, D. 2012. Deterioration and Maintenance of Pavement. London, UK : ICE Publishing.
UK Road Liaison Group. 2016. Well-managed Highway Infrastructure: A Code of Practice. [Online]. London, UK. [Accessed 22 February 2017]. Available from: http://www.ukroadsliaisongroup.org/en/codes/
METHODOLOGY
FUNCTIONAL PERFORMANCE ASSESSMENT ON NATIONAL ROAD NETWORK IN INDONESIA
Case for Change of Practice
Hapsari, PW • 201079327• MSc (Eng)Transport Planning and Engineering
Supervisor : David Rockliff • 2nd Reader : Chandra Balijepalli
LITERATURE REVIEW
Functional performance include roughness and skid resistance
(Pavement Design Guide, 2011)
Pavement roughness affects driving comfort, vehicle operating cost,
and safety (Smith AndTighe, 2004)
Skid resistance determines friction between road surface and vehicle
tire (Andriejauskas et. al, 2014) and affect its safety
Pavement Roughness in Indonesia is mostly conducted by NAASRA
method (SNI 03-3426-1994). Alternative methods are Rolling Straight
Edge, Slope Profilometer, CHLOE Profilometer, and Roughometer
(Yoder andWitczak, 1975)
STUDY AREA
National Road segment in North Coast Line of Central Java
Province, Indonesia starting from Semarang until Brebes for
approximately 180 kms length segmented per 10 kms with
mostly roads are constructed with flexible pavement.
Muson, Tropical and Sea Climate are three climates affecting
Indonesia’s seasons become dry and rain only which more or less
affecting pavement surface quality.
Assess pavement performance based on IRI
Determine appropriate action
Discuss Skid Resistance aspect and its implication
Data Collection
RESEARCH QUESTIONS
How is the functional performance of national road in Indonesia
assessed?
What can be evaluated from current practice on functional
performance assessment ?
How to improve existing practice to gain maximum result in an
effective way?
PROGRESS MADE
Some supporting data available recently are IRI, SDI and AADT
FURTHER PLAN
Obtain friction data from similar assessed location.
Comprehend European countries assessment on Skid Resistance
as a literature and comparison](https://image.slidesharecdn.com/mastersdissertationposters2017-170517094532/85/Masters-Dissertation-Posters-2017-55-320.jpg)
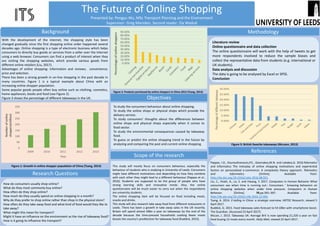
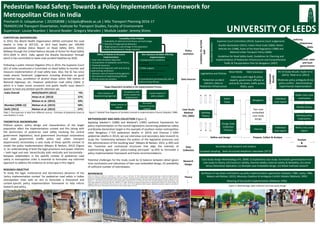
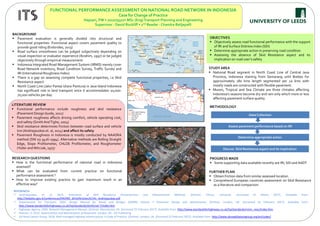

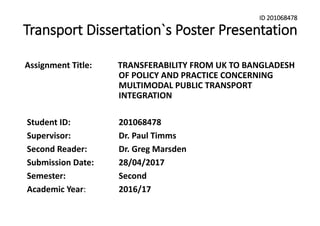
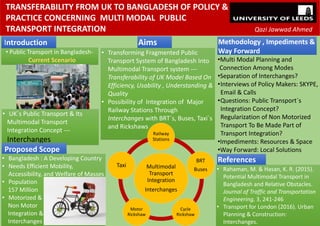
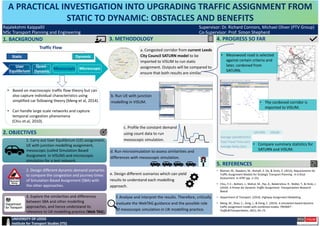
![MODELLING CITY EVOLUTION
Student: Stefano Masci
ts16sm@leeds.ac.uk
MSc Transport Planning and Engineering, ITS
1. BACKGROUND
The urban economics field analyses issues that
can affect the spatial distribution of population
within an urban area. (e.g. income, rent,
transportation, employment, etc …)
The Monocentric City (MC) models a city as
circularly distributed around its central
business district (CBD), namely the main
attractive business pole of the city
The so called Linear Monocentric City (LMC) is
used for transport purposes to represents “a
traffic corridor problem with two congested
modes, a continuum of entry points and a
single exit point” (Jehiel 1993, p.17)
Supervisor: Richard Connors
Second Reader: Judith Wang
The main aim of the project is to examine the
potential for the LMC to model location choice. The
objectives are:
• Determine urban density profiles from real city
data and scientific literature
• Examine how non-uniform distribution of
population affect the system performance of the
LMC
• Extend the LMC model formulation to include
location choice
• Devise a solution algorithm to compute the
equilibrium flows and population distribution for
the extended LMC model, and verify and validate
the algorithm
• Use the extended LMC model to test different
scenarios under the hypothesis of population
growth
2. OBJECTIVES 4. METHODOLOGY: Two Different Approaches
Investigation of Different Density
Profiles: The city density profile will be
derived from real cities through review
of cases of study and from
Governmental websites
Identification of New Parameters: A
sensible set of parameters will be
selected to make the model better
representative of reality
Population Density Comparisons:
Density profiles will be compared to
investigate the impact of different
distributions on congestion, air quality
and health impact.
CALIBRATION
• Fixed length of the city
• Continuous and uniform density
distribution of commuters
• Common destination (CBD)
• Two congested modes, a continuum of
access points for car and a discrete
distribution of stations for train
Novel characteristics:
• Modal split is achieved through a bi-modal
three-objective user equilibrium (TUE)
problem
• Stochasticity of road travel times is
congestion-dependent
• It is implemented to assess land use and air
quality of the system, and the health
impact by individual
• It explicitly models active access modes to
the station
3. FEATURES OF THE MODEL
Transport Supply
+ Monetary Budget
Level of Emissions
NEW INPUTS
EXTENSION
Individual’s satisfaction: To know whether
individuals are satisfied about their current
location or if they wish to move somewhere else
to maximise their happiness/benefits. Three
criteria have been identified so far:
1. Travel Cost
2. Rent Unit [£/sqm]
3. Level of Pollution
The new algorithm: Location choice will be
modelled as a three objective user equilibrium
(TUE). The algorithm will lead to a condition of
equilibrium by simulating the individuals’ trade
off when choosing their location.
Exploratory Tests: Various test and scenarios will
be designed and deployed to test the correctness
and robustness of the new code
TO DEVELOP AN ALMOST
SELF-CONSISTENT MODEL
Realistic population density
distribution based on
location choice
NEW OUTPUT
References:
Jehiel, P. 1993. Equilibrium on a Traffic Corridor with Several
Congested Modes. Transportation Science. 27,pp.16–24.
Wang, J.Y.T. and Connors, R.D. 2015. An integrated land use,
transport planning , air quality and health impact assessment model
for a linear monocentric city. Transportation Research Procedia. 0.
COMPONENTS OF THE MODEL
EXAMPLE OF POPULATION DENSITY DISTRIBUTIONS
BIMODAL vs NON-UNIFORM DISTRIBUTION
Which one will maximise individual satisfaction?
1 Source of the picture (left) and of the chart (above): Wang and Connors, 2015
1
1
Knowing how people would spread across the city can be helpful to policy makers and urban planners to
rethink land use, in order to select the more suitable typology and location of residential areas, to
incentivate the use of greener modes of transport and to improve accessibility to transport infrastructures.](https://image.slidesharecdn.com/mastersdissertationposters2017-170517094532/85/Masters-Dissertation-Posters-2017-64-320.jpg)
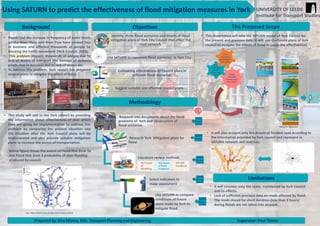
![Analyzing regional variation in accident risk:
A spatial and statistical analysis of
road traffic accidents
Source: Department for Transport, 2016
Introduction and Background
Objectives of the study
Methodology
References
VASILIKI AGATHANGELOU, MSc Mathematical Modelling for Transport
email: ts16va@leeds.ac.uk
Institute for Transport Studies
FACULTY OF ENVIRONMENT
Anon, 2010, Met police has twelve traffic accidents EVERY DAY - killing five
pedestrians and a cyclist in last three years, Daily Mail, [Online], 30 September.
Anon, 2014, Casualties on London’s roads at lowest level ever, Transport for
London, [Online], 11 June.
Anon, 2015, Road deaths up by 16% in Scotland, BBC, [Online], 17 June.
Anon, 2014, Shocking accident rate near Leeds schools, Yorkshire Evening
Post, [Online], 28 November.
B. Hurst, 2015, Revealed: Birmingham's most dangerous roads for cyclists,
Birmingham Mail, [Online], 24 June.
Department for Transport, Reported road casualties Great Britain: 2015 annual
report (2016), Factors affecting reported road casualties.
Smeed, R. J. (1949). Some statistical aspects of road safety research. Journal
of the Royal Statistical Society. Series A (General), 112(1), 1-34.
World Health Organization. Violence, Injury Prevention, World Health
Organization. (2013). Global status report on road safety 2013: supporting a
decade of action.
Road deaths up by
16% in Scotland
Source: BBC,2015
Casualties on London’s
roads at lowest level
ever
Source: TfL, 2014
MET police has twelve traffic
accidents EVERY DAY
Source: Dailymail, 2010
London
Shocking accident rate near
Leeds schools
Source: Yorkshire evening post,
2014
Revealed: Birmingham’s
most dangerous roads for
cyclists
Source: Birmingham MAIL, 2015
Leeds
Birmingham
Where is it safer to drive in the UK??
Investigate the application of Smeed’s law at a regional or city
level, while the parameters of the model are changing with the
spatial scale and with geographical location.
Apply Smeed’s model for different cities or regions in the UK in order to create
comparable results.
Expand Smeed’s formula in order to allow its implementation for different road
types and/or junction types.
Plot the road accidents for different cities in the UK by different road and/or
junction type in a year by year basis.
Identify the accident rate per city
Inform policy makers about road safety
Road safety constitutes a major problem in
many countries all over the world.
1.25 million road traffic deaths were
registered globally in 2013 (WHO,2013).
Factors like population, driving licenses,
motor vehicles affect indirectly the road
accidents.
Great Britain’s population has shown an
increase of 15%, while the road fatalities
have decreased by 68%, over the last 30
years
Deaths from road traffic
collisions increased by 7 to
62 in West Yorkshire
Source: UK government, Annual
Report 2014
𝑫
𝑵
= 𝟎. 𝟎𝟎𝟎𝟑 ∗
𝑵
𝑷
−𝟎.𝟔𝟕
In 1948 R. J. Smeed came up with a formula
which is worldwide used and estimates the
annual traffic fatalities according the
population and the registered vehicles.
D: number of deaths
N: motor vehicles
P: population
1
• Collection of the required data
(STATS19) and the necessary analysis.
2
• Fit the Smeed model to the data (for a
selection of different regions/cities) and
compare parameters and model fit for
different subsets of data.
3
• Investigation of extensions of the
Smeed model to account for other
potentially influential factors, like traffic
volume (number of vehicle kilometres).
4
• Use of statistics tests for the improved
models in order to determine the relative
goodness of fit of Smeed’s law/model at
different levels of spatial aggregation.
5
• Writing code to extract and analyse the
necessary data for the different
regions/cities
6
• Import of the traffic accident data to
QGIS through PSQL
7
• Make comparison of accident rates in
cities/regions and comment on the
applicability of Smeed’s formula
Supervisor : Dr Richard Connors
Second supervisor : Professor Simon Shepherd](https://image.slidesharecdn.com/mastersdissertationposters2017-170517094532/85/Masters-Dissertation-Posters-2017-68-320.jpg)
![• Past research focus on using single user class in
assignment model. The average value of the
generalized cost can simplify the assignment
process.
• The multiple user classes allows research to
explore how detail the user react in the travel
choices.
• Public not only concern the equity of road
pricing but also its effectiveness. It is believed
that the road charging will increase the
efficiency of the network.
• The multi-user classes assignment can be used
to test whether the road charging is effective or
not. Further results can be used for policy
decision making.
The implications of multiple user classes
for equilibrium assignment modelling solutions
Wei Hao Huang | Transport Planning and Engineering | Supervisor: Dr. David Milne | 2nd Reader: Dr. David Watling
01 BACKGROUND
02 OBJECTIVES
Investigate and analyse different road pricing
scheme between the network in UK.
Discuss the effect on different user classes.
Policy implication.
03 SCOPE
• The traveler in the concerned area will be
distributed into several user classes under
theoretical assumption.
• Related modes: automobiles, trucks .
• Area: urban in Leeds and Cambridge in UK.
Step 1: Build Networks on SATURN
(OD demand, road networks data,..)
Step 2: Develop Road Pricing Scheme
(Distance- and Cordon-based charging)
Step 3: Sensitivity Test
(explore how differences of generalised
cost coefficients set in the user classes)
Step 4: Analyze network impact users’ behaviour
(discuss implications of road pricing)
Step 5: Conclusion and Policy Implication
•Travel demand models
Trip generation
Distribution
Modal split
Assignment
Network
data
Trip
matrices
Route selection
and Loading
[1]Milne, D. 2017. How much spatial road network detail is desirable for planning purposes? UTSG. [2]Rajabi, M.M. 2015. Implications of multiple user classes for
equilibrium assignment modelling solutions. Master thesis, University of Leeds.[3]IS Learning Team. 2005. Measures To Reduce Congestion And The Demand To Travel:
Road-User Charging. [Online]. [Accessed 24 April 2017]. Available from: https://www.nottingham.ac.uk/transportissues/cong_roadcharging.shtml
MINICAM network
(source: Milne, 2017)
Simplified Leeds network
(source: Rajabi, 2015)
04 LITERATURE REVIEW
• Assignment modelling
•Multiple user classes in assignment modelling
(Rajabi, 2015)
-Demand variability
-Unless huge differences in sensitivities to the travel cost
between users, there is no implication to the overall model
results.
-User classes variability
-The higher No. of user classes, the closer outcome to the 2-
user classes condition.
-Income distribution
-User class with lower VOT affects model results severely than
others (choose shortest path causing congestion).
•Road user charging scheme (IS Learning Team, 2005)
-Cordon/zone charging
-Distance-based charging
05 METHODOLOGY
06 CONCLUSION
• The study aims to provide concrete suggestion on the assignment process and the policy decision.
• The outline of this study is the extension of the previous research. Rajabi (2015) explored several implication
with the multiple user classes.
• Past research use average value of road user neglecting the differences between different road users. This
study wants to discuss the implication (road charging) of multiple user classes on the assignment modelling.
• The results will be carried out with SATURN. Through the sensitivity analysis to prove that road charging can
increase the efficiency of the transport network.
07 REFERENCE](https://image.slidesharecdn.com/mastersdissertationposters2017-170517094532/85/Masters-Dissertation-Posters-2017-70-320.jpg)
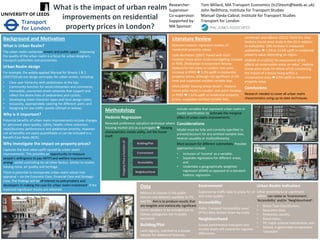
![Initial assessment of ‘lively’impact of a PR scheme
using SATURN and logit model
1. Background
Park and Ride (PR)
the system of leaving the private car in a park and ride
area and taking public transport to the city center.
The binary Logit model
Predicts the proportion of a population
choosing one of two mutually exclusive option.
Model split
describes the proportion of people use
alternative forms of transportation.
4. Methodology
Where
South of Beverley town
Why
Looking to encourage mode shift
from private cars to buses.
3. Structure
CONCLUSION
ANALYSIS
ASSUMPTION
REVIEW
2. Objectives
How is the demand of PR varying ?
To investigate the effectiveness
of a PR scheme variation in its
certain features for reducing car
traffic from the city centre
5. Potential risk
Logit model
Impedance function
SATURNJourney
time
Different
Wi,Ci
Variables
Town center parking fare
PR cost (ticket fare)
PR journey time/ frequency
PR
assumption
Operation time
frequency
Value of time
▪ Specific different
pair of O-D
• Only using AM period
• Not considering the different of time period
• Not considering the different travel purpose
• No analysis of the BCR( benefit cost ratio)
6. Next step
• Analysis the journey time of car base
on SATURN network modelling
• Some basic PR assumption of
operating time, frequency and fare
Yang Yang (ts16yy@leeds.ac.uk) MSc Transport Planning Engineering
Supervisor : Chris Wiles
Second reader: Jeremy Shires
Reference
ITS;, Van Vliet, D. and atkins;. 2015. simulation and assignment of traffic in urban road networks. [Manuscript]. At: http://www.saturnsoftware.co.uk/saturnmanual/index.html
Hensher, D.A. and Button, K.J. 2000. Handbook of transport modelling. Oxford: Pergamon.
. Great Britain. Department of the Environment for Northern, I., Great Britain. Department of, T., Great Britain. Scottish Office.Industry, D. and Great Britain. Welsh, O. 1996. Design manual for roads
and bridges: Vol.12,Section 1,Part 1, Traffic appraisal of roads schemes.Traffic appraisal manual.Application of traffic appraisal to trunk road schemes. London: Dept. of Transport; Scottish Office
Industry Dept.; Welsh Office; Dept. of the Environment for Northern Ireland.](https://image.slidesharecdn.com/mastersdissertationposters2017-170517094532/85/Masters-Dissertation-Posters-2017-72-320.jpg)
![Po
- B B : B B D B CA
E AA CA B : B AEAB
GL TYR HSLZ B3 PYR C]LY [Z]_ WLYYTYR LYO 5YRTYPP]TYR B [P]aT Z]0 2]dLY L__SPb (YO ]PLOP]0 4] 4L]dW 8TMMP]O
INTRODUCTION
Ø
• B L]_ _TNVP_TYR T LY LW_P]YL_TaP _Z _SP NZYaPY_TZYLW
[L[P] Z] NL]OMZL]O _TNVP_ TYNW OTYR _SP P Z
L]_ NL]O NZY_LN_WP OPMT_ LYO N]POT_ NL]O LYO
ZMTWP OPaTNP
Ø
• CSP]P L]P N ]]PY_Wd - L]_NL]O TY P TY
B L]_ 3T_TP L]_YP] ST[ B3 NT_TP 4 C LYO :ZYP
( ,
• CSP D f MTR + M Z[P]L_Z] SLaP LYYZ YNPO
_SPd bTWW M]TYR NZY_LN_WP _]LaPW _Z PaP]d M TY
2]T_LTY Md ((( 4 C LYO :ZYP ( ,
Ø -
• B L]_ _TNVP_TYR NLY PYNZ ]LRP Z]P _]LaPW Md
[ MWTN _]LY [Z]_ bT_S L ZNTL_PO MPYP T_ M _ _SP]P
L]P _TWW Z P [Z_PY_TLW ]T V _SL_ NLYYZ_ MP
TRYZ]PO
n AT V Z NL]O NWL S
n AT V Z d _P LTW ]P
n AT V Z []TaLNd LYO PN ]T_d
n 3Z _ Z d _P T [WP PY_L_TZY LYO LTY_PYLYNP
Ø _Z OPaPWZ[ L MP__P] P]# ]TPYOWd LYO LNNP TMWP
M _TNVP_TYR d _P T_LMWP Z] PPO LYO
_]LY P]LMWP _Z Z_SP] NT_TP
Ø B D A
• CZ TYO VPd LN_Z] TY W PYNTYR _SP d _P
• CZ OP_P] TYP _SP P_SZO _Z PaLW L_P _SP d _P
• CZ RTaP RRP _TZY Z] PYSLYNTYR _SP d _P
AIM AND OBJECTIVES
PREVIOUS RESEARH
METHODOLOGY
NEXT STAGES
REFERENCE
Ø 4P[L]_ PY_ Z] C]LY [Z]_ (/ B L]_ LYO 9Y_PR]L_PO CTNVP_TYR B_]L_PRd I YWTYPJ I1 P PO .
1[]TW ( -J 1aLTWLMWP ]Z 0
S__[0%%bPML]NSTaP YL_TZYLWL]NSTaP RZa V% %S__[0%bbb O _ RZa V%[R]%]PRTZYLW% L]_#
TY_PR]L_PO#_TNVP_TYR%
Ø SP 5OPW LYY LYO APTNSPYMLNS AP_]TPaPO ( 9Y_PR]L_PO ]MLY P#_TNVP_TYR Z]
[ MWTN _]LY [Z]_ LYO _Z ]T _TN T_P I YWTYPJ BNTPYNP LYO CPNSYZWZRd [_TZY 1 P PY_
BC 1 I1 P PO + 6PM] L]d ( -J 1aLTWLMWP ]Z 0
S__[0%%bbb P ]Z[L]W P ]Z[L P %APR4L_L%P_ OP %P_ OP %UZTY%( %+ )++ %9 #
: 9 K5C ( + )++ K5 [O (% %( ,
Ø b3 ( + B L]_P] ZaP 0 7]Zb_S TY [ MWTN _]LY [Z]_ TY L OTRT_LW P]L I YWTYPJ I1NNP PO .
1[]TW ( -J 1aLTWLMWP ]Z 0 S__[0%%bbb [bN NZ V%TYO _]TP %RZaP]Y PY_#[ MWTN#
PN_Z]%_]LY [Z]_%TY TRS_ % L]_P]# ZaP #R]Zb_S#TY#[ MWTN#_]LY [Z]_#TY#L#OTRT_LW#P]L S_ W
Ø FPWOP ( B L]_ NL]O _TNVP_TYR TY C]ZYOSPT OPWTaP] M _LY_TLW MPYP T_ _Z ZNTP_d
I YWTYPJ I1 P PO . 1[]TW ( -J 1aLTWLMWP ]Z 0
S__[0%%LM _]LN_ LP_]LY [Z]_ Z]R%NZY P]PYNP%TYOPc%TO% ,
Ø d _P] NL]O LYO
3ZY_LN_WP NL]O
Ø ZYOZY D
Ø 961A5 _PNSYZWZRd
Ø ) TWWTZY P] TY ( (
Ø9Y_PR]L_PO0 GP
ØBLaPO (#) PNZYO [P]
MZL]OTYR
Ø N_Z[ NL]O
Ø8ZYR ZYR 3STYL
Ø6PWT3L _PNSYZWZRd
Ø TWWTZY P] TY (-
Ø9Y_PR]L_PO0 GP
ØBL_T LN_TZY WPaPW Z /-
ØCZ NS C]LaPW
Ø7P] LYd
Ø 63 _PNSYZWZRd
ØWP _SLY P]
Ø9Y_PR]L_PO0 GP
Ø5YOPO ZY ) _S 4PN ( ,
Ø 7P_ OL_L ]Z 6T] _ 7]Z [ LYO ]Z ZM P]aL_TZY
]aPd _Z OZ _SP NZ _#MPYP T_ LYLWd T 321 0
• CSP P_ ]P PY_ ELW P E
!# = ' + )
*+ − -+
(1 + 0)+
2
+3'
• CSP MPYP T_ NZ _ ]L_TZ 23A
*-4 =
*
-
Ø3ZYO N_ ]aPd LMZ _ _SP []P P]PYNP LYO
[P]NP[_TZY L ZYR
• _SP PcT _TYR LYO [Z_PY_TLW P]
• _SP O]TaP] LYO Z[P]L_Z]
❇ B B A
• BZ P LN_Z] NLYYZ_ MP ZYP_TePO Z] 321
• CSP L [WP TeP LYO YT_ Ld L PN_ _SP ]P W_
AP Z ]NP0 S__[0%%T[[] Z]R%]PLO%_]LY [Z]_# Z]#_SP#YZ]_S#L#MW P[]TY_# Z]#OPaZWaTYR#LYO#TY_PR]L_TYR#_]LY [Z]_#
[ZbP] #TY#PYRWLYO TY_]ZO N_TZY
AP Z ]NP0 S__[0%%bbb ]LTWbLd[]Z NZ %b[%TY_PR]L_PO#_TNVP_TYR# Z]# L]_#NT_TP %
AP Z ]NP0 S__[0%%bbb ZN_Z[ NZ SV%RP_#dZ ]#ZN_Z[ %PY%TYOPc S_ W
AP Z ]NP0 S__[ 0%%bbb SPT P OP%YPb _TNVP]% PWO YR%CTNVP_OTPY _#CZ NS#C]LaPW# _T]M_#TY#bPYTRPY#
FZNSPY#)) ,, S_ W
•4P TRY P _TZYYLT]P ML PO ZY _SP Pc[PN_PO ]P W_
•3ZYO N_ _SP ]aPd
•1YLWd P _SP OL_L ]Z ]aPd LYO 6T] _ 7]Z [
•5aLW L_P _SP M _TNVP_TYR d _P
•1 M _TNVP_TYR d _P bTWW MP T []ZaPO bT_S _SP
SPW[ Z _SP ]P W_ ]Z PaLW L_TZY](https://image.slidesharecdn.com/mastersdissertationposters2017-170517094532/85/Masters-Dissertation-Posters-2017-73-320.jpg)
![ThispapermainlyinviewoftripgenerationofAMweekdaymorningpeak
(08:00-09:00)incurrentstatusofBeverley,toconductatargetedresearch,and
planning.Comparedwithwholedaysituation,itwasuncomprehensiveandmay
impacttheresearchresult.
Reference:
Beverly,2017.VisitBeverly.[Online].[Accessed20thApril2017].Avail-
ablefrom:http://www.visithullandeastyorkshire.com/beverley/
PlanningServiceandDepartmentofRegionalDevelopment,2006.Guide-
linesforDevelopmentProposalsinNorthernIreland.[Online].[accessed
18March2017].Availablefrom:http://www.planningni.gov.uk/index/poli-
cy/supplementary_guid-
ance/spg_other/transport/transport_preparing/transport_stage1/transport_t
ravel/transport_triprate.htm
SATURNSoftware.2015.ManualUserGuide.Version11.3.12.[Online].
[Accessed09February2017].Availablefrom:http://www.saturnsoftware.-
co.uk/saturnmanual/pdfs/SATURN%20v11.3.12%20Manual%20(Main).pdf
TRICSConsortiumLimited.2017.TRICSWebsite.[Online].[Accessed16
March2017].Availablefrom:http://www.trics.org/
VanVliet,D.1982.SATURN-amodernassignmentmodel.TrafficEngi-
neering+Control.23(12),pp.578-581.](https://image.slidesharecdn.com/mastersdissertationposters2017-170517094532/85/Masters-Dissertation-Posters-2017-74-320.jpg)
![Optimization of Manchester Metrolink Timetable
By: Yifan Huang ml15y4h@leeds.ac.uk Supervisor: Dr. Ronghui LiuMSc Transport Planning
Background
Ø Manchester light rail system, Metrolink, opened in 1992. It
connected Bury and Altrincham and expanded to Eccles in
2002(Knowles, 1996).
Ø The Department for Transport (DfT) planned to improve more
trams in the fleet and increased capacity in the centre of city
(West and Cushing, 2015).
Ø Now, 11 Metrolink lines are in use. Containing both street
running and underground running.
Ø The aim of this research is to coordinate energy consumption
and improve the service in different times of the day.
Objectives
Ø To improve the timetable and considering the whole driving
cycle and including traction and brake.
Ø To reduce run time unreliability between the tram stations,
considering the influence of other surface traffic.
Methodology
Introduction
Problem
1. Excessive energy consumption
2. Highly unreliable run time between the tram stations
in the whole network
Expected Outcome
1.The optimized frequency and headway can be calculated.
2.Minimize Energy can be calculated and will be compared
with the energy data before.
References:
1.Knowles, R.D., 1996. Transport impacts of Greater
Manchester's Metrolink light rail system. Journal of Transport
Geography, 4(1), pp.1-14.
2. West, L. and Cushing, P., 2015. Expanding and Enhancing
Manchester Metrolink. In European Transport Conference 2015.
Step2
Step2
Ø Use suitable algorithm to solve this optimal
problem
•Eg. Genetic algorithm(GA)
•Particle Swarm Optimization and Simulated
Annealing (PSO-SA)
Step3
Ø Data analysis
•Traffic OD data
•Traffic flow of peak hours and off-peak hours
in Metrolink system
•Energy consumption data for the network
Ø Objective function-minimize energy consumption
Energy of acceleration time one tram in whole stations
𝐸 = 2%M(a * 𝑡
,
,
)2 ∗ N
Energy of deceleration time one tram in whole stations
𝐸0 = 2%M(a * 𝑡0
,
,
)2 ∗ N
Energy of the time to travel at maximum speed one tram in
whole stations-
𝐸1 = {𝑇4546 − [(* 𝑡
,
,
+ * 𝑡0
,
,
) : 𝑁 + 𝑡 : 𝑁 − 2 ]} : 𝐹 : 𝑉A1
So 𝑬 = ∑ ∑ 𝒇 𝒒
𝒒
𝟏 (𝑬 𝒂 + 𝑬 𝒃 + 𝑬 𝒙)𝒎
𝟏
Ø Constraints
• Train operation constraints
• Safety headway constraints
• Dwelling time constraints --(𝑡
KL
)AK,≤ 𝑡
KL
≤ (𝑡
KL
)A1
• Integer Constraints -- 𝑞, 𝑥 ∈ 𝑍S
Step 1
Ø Assumptions
• Uniform headways
• No accident
• Fixed time at each station
Second Marker:Hongbo Ye
t
v
𝑡
𝑡0
𝑉A1
𝑡1
𝑡
𝑡1
T
𝑡
T
𝑡0
T
The accelerating and braking time diagram
𝑡
,-The acceleration time from the nth station
𝑡0
,
-The deceleration time of the nth station
𝑡1
,-The time to travel at maximum speed of the nth station
𝑡-Dwelling time of train i at station n in line l
𝑉A1- Maximum speed of the tram](https://image.slidesharecdn.com/mastersdissertationposters2017-170517094532/85/Masters-Dissertation-Posters-2017-75-320.jpg)
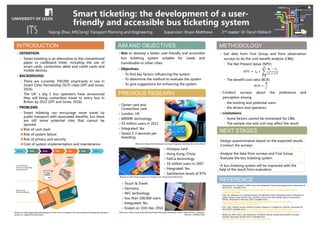

The document discusses the growth of private car ownership in China from 1985 to 2030, highlighting significant increases in vehicle numbers and the resulting traffic congestion and environmental issues. It proposes an econometric model to analyze the impact of GDP per capita, population, and fuel prices on car ownership, as well as the effectiveness of traffic policies implemented since 2008. The study aims to predict future car ownership trends and assess whether traffic policies are effectively restraining car growth.


![11.[1 4]adaptive cruise control a categorical imperative to the new world in ...](https://cdn.slidesharecdn.com/ss_thumbnails/11-1-4adaptivecruisecontrolacategoricalimperativetothenewworldin21stcentury-120512235324-phpapp01-thumbnail.jpg?width=640&height=640&fit=bounds)


