Download as PDF, PPTX
![The Origins of the PDFH
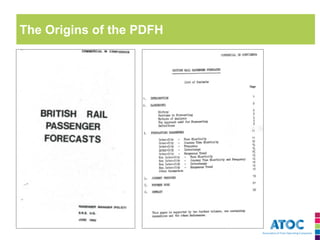
•PDFH came about in June 1986 (Bitish Rail [BR] Policy Unit)
•Replaced British Rail Passenger Forecasts (June 1982)
•The central aim was to provide a consistent and solid basis for investment appraisal
•Also pricing and service planning across BR
•Supporting well founded investment proposals at Dept for Transport
•Contained 55 references and similar to current structure](https://image.slidesharecdn.com/railpassengerdemandforecastingaviewfromtheindustry-141120053309-conversion-gate02/85/Rail-Passenger-Demand-Forecasting-a-view-from-the-industry-14-320.jpg)
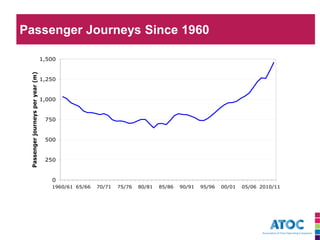

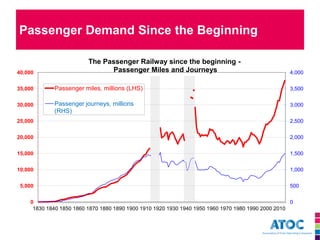
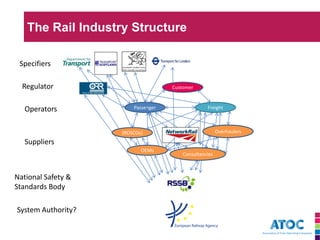
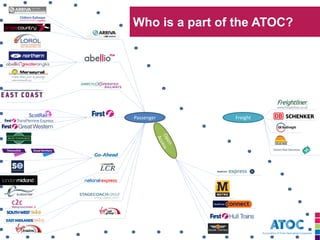
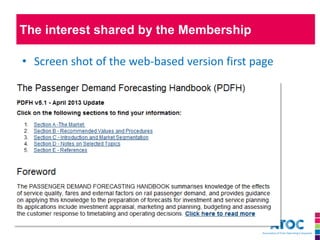
The document discusses rail passenger demand forecasting from the perspective of the rail industry. It provides background on passenger demand trends over time. It describes the structure of the UK rail industry and the roles of key organizations like ATOC and the Passenger Demand Forecasting Council. The PDF Handbook developed by this group provides a standard approach to forecasting that is used across the industry. The summary discusses areas for potential improvement to the forecasting approach.


