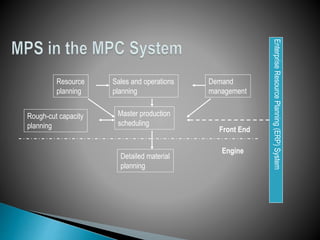
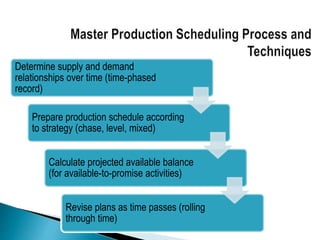
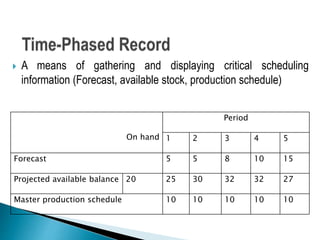
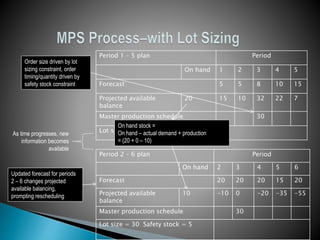
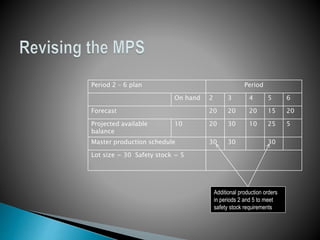
MASTER PRODUCTION
SCHEDULE (MPS)
 An effective Master Production Schedule (MPS)
provides the basis for making good use of
manufacturing resources, making customer delivery
promises, resolving trade-offs between sales and
manufacturing, and attaining the firm’s strategic
objectives, as reflected in the Sales and Operations
Plan.
What is Master Production Scheduling?
MPS and the Business Environment
MPS Techniques
Available-To-Promise
MPS in Assemble-To-Order Environments
MPS Stability
Managing the MPS
 The MPS is a statement of the specific products that make up
manufacturing output
 The MPS is a translation of the sales and operations plan into
producible products with their timing and quantities determined
 The MPS shows when products will be available in the future
 The MPS is a statement of production, not of demand
 The MPS is not a forecast
 The MPS considers factors such as capacity constraints, costs
of production, resource limitations, and the sales and
operations plan
 The MPS is stated in terms of product specifications–usually
part numbers which have specific bills of materials (BOM)
 In assemble-to-order environments, the MPS may be stated in
terms of an “average” final product
 In a make-to-stock company, the MPS is a statement of how
much of each end item to be produced and when it will be
available
 In a make-to-order (or engineer-to-order) firm, the MPS is
usually defined as the specific end item(s) that make up an
actual customer order
 In an assemble-to-order firm, the large number of possible
product combinations is represented with a planning bill of
materials
Resource
planning
Sales and operations
planning
Demand
management
Master production
scheduling
Detailed material
planning
Enterprise
Resource
Planning
(ERP)
System
Front End
Engine
Rough-cut capacity
planning
 The MPS is the driver of all detailed manufacturing activities
need to meet output objectives
 The MPS is the basis for key inter-functional trade-offs
◦ Production and sales
 Financial budgets should be integrated with MPS activities
Determine supply and demand
relationships over time (time-phased
record)
Prepare production schedule according
to strategy (chase, level, mixed)
Calculate projected available balance
(for available-to-promise activities)
Revise plans as time passes (rolling
through time)
 A means of gathering and displaying critical scheduling
information (Forecast, available stock, production schedule)
On hand
Period
1 2 3 4 5
Forecast 5 5 8 10 15
Projected available balance 20 25 30 32 32 27
Master production schedule 10 10 10 10 10
Period 1 – 5 plan Period
On hand 1 2 3 4 5
Forecast 5 5 8 10 15
Projected available
balance
20 15 10 32 22 7
Master production schedule 30
Lot size = 30 Safety stock = 5
Period 2 – 6 plan Period
On hand 2 3 4 5 6
Forecast 20 20 20 15 20
Projected available
balance
10 -10 0 -20 -35 -55
Master production schedule 30
Lot size = 30 Safety stock = 5
Order size driven by lot
sizing constraint, order
timing/quantity driven by
safety stock constraint
As time progresses, new
information becomes
available
On hand stock =
On hand – actual demand + production
= (20 + 0 – 10)
Updated forecast for periods
2 – 6 changes projected
available balancing,
prompting rescheduling
Period 2 – 6 plan Period
On hand 2 3 4 5 6
Forecast 20 20 20 15 20
Projected available
balance
10 20 30 10 25 5
Master production schedule 30 30 30
Lot size = 30 Safety stock = 5
Additional production orders
in periods 2 and 5 to meet
safety stock requirements
 When immediate delivery is not expected (or is not possible
due to stockouts), a promised delivery date must be
established
 The order promising task is to determine when the
shipment can be made
 Available-to-promise (ATP) procedures coordinate order
promising with production schedules
 Discrete ATP treats each period independently
Period
On hand 1 2 3 4 5
Forecast 5 5 8 10 15
Orders 5 3 2 0 0
Projected available balance 20 15 10 32 22 7
Available-to-promise 12 28
Master production schedule 30
Lot size = 30 Safety stock = 5
Period 1: Total customer
demand before next
production = 8 units
Period 1: ATP = available
balance – customer
orders = 20 -8
Period 1: Projected available =
Previous available + MPS –
MAX(Forecast, Orders)
Period 3: ATP = MPS –
customer orders = 30 -2
Period 3: Total customer
demand before next
production = 2 units
 Cumulative ATP carries ATP units forward
Period
On hand 1 2 3 4 5
Forecast 5 5 8 10 15
Orders 5 3 2 0 0
Projected available balance 20 15 10 32 22 7
Available-to-promise 12 40
Master production schedule 30
Lot size = 30 Safety stock = 5
Period 1: Total
customer demand
before next
production = 8
units
Period 1: ATP1 =
available balance –
customer orders =
20 - 8
Period 1: Projected
available = Previous
available + MPS –
MAX(Forecast, Orders)
Period 3: ATP3 =
ATP1 + MPS –
customer orders =
12+ 30 - 2
Period 3: Total
customer demand
before next
production = 2
units
 In the ATP calculation, demand is considered to be the
maximum of forecast and actual customer orders
◦ This is a conservative approach
◦ Assumes that we will eventually sell at least the forecast quantity
◦ Adjusts for periods where demand exceeds the forecast
 In an assemble-to-order (ATO) environment, the possible
combinations of end items can be huge
 Specific end item bills of materials (BOM) are replaced with a
planning bill of materials, which represents the potential product
combinations
 One type of planning BOM is the super bill, which describes the
usage of options and components that make up the average
product
Parts used in all
configurations
are listed with
usage probability
of 1.0
Mutually exclusive option
sets are listed together,
with a usage probability for
each option
Common Parts
Available?
Gear Available?
Taylor Available?
Book order
Try 1 period later
No
No
No
Yes
Yes
Yes
Are the common
parts on the BOM
available?
Is the requested
gear option
available?
Is the requested
Taylor option
available?
 When a planning BOM is used, a final assembly schedule
(FAS) is often used
◦ States the set of end products to be built over a time period
 Two-level MPS coordinates component production and the
FAS
 Component production is controlled by aggregate production
plan in the FAS
 Final assembly is controlled by the FAS
 Either discrete or cumulative ATP logic can apply
4-Horsepower Tillers (Aggregate) Period
On hand 1 2 3 4 5
Production Plan 100 100 100 100 100
Orders 100 72 54 0 0
Projected available balance 0 0 0 0 0 0
Available-to-promise 0 28 46 100 100
Master production schedule 100 100 100 100 100
Safety stock = 0
Taylor Brand 4-HP Tillers (FAS) Period
On hand 1 2 3 4 5
Forecast for model (40% of total) 40 40 40 40 40
Orders 42 37 23 0 0
Projected available balance 10 48 88 48 88 48
Available-to-promise 48 20 80
Master production schedule 80 80 80
Lot size = 80 Safety stock = 10
Normal ATP logic
applies to FAS items
For planning BOM items
projected available balance is
always zero because the item
doesn’t actually exist
Planning BOM orders
are the sum of FAS
orders
 A stable MPS translates to stable component schedules
◦ Stability allows improved plant performance
 Excessive MPS changes can lead to reduced productivity
 Failure to change the MPS can lead to reduced customer
service and increased inventory (failure to react)
Inside the frozen horizon
no order changes are
allowed
Demand Time
Fence
Planning Time
Fence
Only occasional changes Minor changes
Most changes
 To be controlled, the MPS must be realistic
 People should only be held accountable for attainable
performance levels
 Stability and buffering are important
 The MPS must not be overstated
◦ Sum of the MPS should equal the production plan
 The MPS unit should reflect the business environment and the
company’s chosen approach.
 If a common ERP database is implemented, the MPS function
should use that data.
 Regardless of the firm’s environment, effective scheduling is
facilitated by common systems, time-phased processing, and
MPS techniques.
 Customer order processing should be closely linked to MPS.
 ATP information should be derived from the MPS and
provided to the sales department.
 An FAS should be used to convert the anticipated build
schedule into the final build schedule.
 The master production scheduler should ensure that the sum
of the parts (the MPS) is equal to the whole (the operations
plan).

MASTER PRODUCTION SCHEDULE (MPS).pptx

  • 1.
  • 2.
     An effectiveMaster Production Schedule (MPS) provides the basis for making good use of manufacturing resources, making customer delivery promises, resolving trade-offs between sales and manufacturing, and attaining the firm’s strategic objectives, as reflected in the Sales and Operations Plan.
  • 3.
    What is MasterProduction Scheduling? MPS and the Business Environment MPS Techniques Available-To-Promise MPS in Assemble-To-Order Environments MPS Stability Managing the MPS
  • 4.
     The MPSis a statement of the specific products that make up manufacturing output  The MPS is a translation of the sales and operations plan into producible products with their timing and quantities determined  The MPS shows when products will be available in the future
  • 5.
     The MPSis a statement of production, not of demand  The MPS is not a forecast  The MPS considers factors such as capacity constraints, costs of production, resource limitations, and the sales and operations plan  The MPS is stated in terms of product specifications–usually part numbers which have specific bills of materials (BOM)  In assemble-to-order environments, the MPS may be stated in terms of an “average” final product
  • 6.
     In amake-to-stock company, the MPS is a statement of how much of each end item to be produced and when it will be available  In a make-to-order (or engineer-to-order) firm, the MPS is usually defined as the specific end item(s) that make up an actual customer order  In an assemble-to-order firm, the large number of possible product combinations is represented with a planning bill of materials
  • 7.
    Resource planning Sales and operations planning Demand management Masterproduction scheduling Detailed material planning Enterprise Resource Planning (ERP) System Front End Engine Rough-cut capacity planning
  • 8.
     The MPSis the driver of all detailed manufacturing activities need to meet output objectives  The MPS is the basis for key inter-functional trade-offs ◦ Production and sales  Financial budgets should be integrated with MPS activities
  • 9.
    Determine supply anddemand relationships over time (time-phased record) Prepare production schedule according to strategy (chase, level, mixed) Calculate projected available balance (for available-to-promise activities) Revise plans as time passes (rolling through time)
  • 10.
     A meansof gathering and displaying critical scheduling information (Forecast, available stock, production schedule) On hand Period 1 2 3 4 5 Forecast 5 5 8 10 15 Projected available balance 20 25 30 32 32 27 Master production schedule 10 10 10 10 10
  • 11.
    Period 1 –5 plan Period On hand 1 2 3 4 5 Forecast 5 5 8 10 15 Projected available balance 20 15 10 32 22 7 Master production schedule 30 Lot size = 30 Safety stock = 5 Period 2 – 6 plan Period On hand 2 3 4 5 6 Forecast 20 20 20 15 20 Projected available balance 10 -10 0 -20 -35 -55 Master production schedule 30 Lot size = 30 Safety stock = 5 Order size driven by lot sizing constraint, order timing/quantity driven by safety stock constraint As time progresses, new information becomes available On hand stock = On hand – actual demand + production = (20 + 0 – 10) Updated forecast for periods 2 – 6 changes projected available balancing, prompting rescheduling
  • 12.
    Period 2 –6 plan Period On hand 2 3 4 5 6 Forecast 20 20 20 15 20 Projected available balance 10 20 30 10 25 5 Master production schedule 30 30 30 Lot size = 30 Safety stock = 5 Additional production orders in periods 2 and 5 to meet safety stock requirements
  • 13.
     When immediatedelivery is not expected (or is not possible due to stockouts), a promised delivery date must be established  The order promising task is to determine when the shipment can be made  Available-to-promise (ATP) procedures coordinate order promising with production schedules
  • 14.
     Discrete ATPtreats each period independently Period On hand 1 2 3 4 5 Forecast 5 5 8 10 15 Orders 5 3 2 0 0 Projected available balance 20 15 10 32 22 7 Available-to-promise 12 28 Master production schedule 30 Lot size = 30 Safety stock = 5 Period 1: Total customer demand before next production = 8 units Period 1: ATP = available balance – customer orders = 20 -8 Period 1: Projected available = Previous available + MPS – MAX(Forecast, Orders) Period 3: ATP = MPS – customer orders = 30 -2 Period 3: Total customer demand before next production = 2 units
  • 15.
     Cumulative ATPcarries ATP units forward Period On hand 1 2 3 4 5 Forecast 5 5 8 10 15 Orders 5 3 2 0 0 Projected available balance 20 15 10 32 22 7 Available-to-promise 12 40 Master production schedule 30 Lot size = 30 Safety stock = 5 Period 1: Total customer demand before next production = 8 units Period 1: ATP1 = available balance – customer orders = 20 - 8 Period 1: Projected available = Previous available + MPS – MAX(Forecast, Orders) Period 3: ATP3 = ATP1 + MPS – customer orders = 12+ 30 - 2 Period 3: Total customer demand before next production = 2 units
  • 16.
     In theATP calculation, demand is considered to be the maximum of forecast and actual customer orders ◦ This is a conservative approach ◦ Assumes that we will eventually sell at least the forecast quantity ◦ Adjusts for periods where demand exceeds the forecast
  • 17.
     In anassemble-to-order (ATO) environment, the possible combinations of end items can be huge  Specific end item bills of materials (BOM) are replaced with a planning bill of materials, which represents the potential product combinations  One type of planning BOM is the super bill, which describes the usage of options and components that make up the average product
  • 18.
    Parts used inall configurations are listed with usage probability of 1.0 Mutually exclusive option sets are listed together, with a usage probability for each option
  • 19.
    Common Parts Available? Gear Available? TaylorAvailable? Book order Try 1 period later No No No Yes Yes Yes Are the common parts on the BOM available? Is the requested gear option available? Is the requested Taylor option available?
  • 20.
     When aplanning BOM is used, a final assembly schedule (FAS) is often used ◦ States the set of end products to be built over a time period  Two-level MPS coordinates component production and the FAS  Component production is controlled by aggregate production plan in the FAS  Final assembly is controlled by the FAS  Either discrete or cumulative ATP logic can apply
  • 21.
    4-Horsepower Tillers (Aggregate)Period On hand 1 2 3 4 5 Production Plan 100 100 100 100 100 Orders 100 72 54 0 0 Projected available balance 0 0 0 0 0 0 Available-to-promise 0 28 46 100 100 Master production schedule 100 100 100 100 100 Safety stock = 0 Taylor Brand 4-HP Tillers (FAS) Period On hand 1 2 3 4 5 Forecast for model (40% of total) 40 40 40 40 40 Orders 42 37 23 0 0 Projected available balance 10 48 88 48 88 48 Available-to-promise 48 20 80 Master production schedule 80 80 80 Lot size = 80 Safety stock = 10 Normal ATP logic applies to FAS items For planning BOM items projected available balance is always zero because the item doesn’t actually exist Planning BOM orders are the sum of FAS orders
  • 22.
     A stableMPS translates to stable component schedules ◦ Stability allows improved plant performance  Excessive MPS changes can lead to reduced productivity  Failure to change the MPS can lead to reduced customer service and increased inventory (failure to react)
  • 23.
    Inside the frozenhorizon no order changes are allowed Demand Time Fence Planning Time Fence Only occasional changes Minor changes Most changes
  • 24.
     To becontrolled, the MPS must be realistic  People should only be held accountable for attainable performance levels  Stability and buffering are important  The MPS must not be overstated ◦ Sum of the MPS should equal the production plan
  • 25.
     The MPSunit should reflect the business environment and the company’s chosen approach.  If a common ERP database is implemented, the MPS function should use that data.  Regardless of the firm’s environment, effective scheduling is facilitated by common systems, time-phased processing, and MPS techniques.  Customer order processing should be closely linked to MPS.
  • 26.
     ATP informationshould be derived from the MPS and provided to the sales department.  An FAS should be used to convert the anticipated build schedule into the final build schedule.  The master production scheduler should ensure that the sum of the parts (the MPS) is equal to the whole (the operations plan).