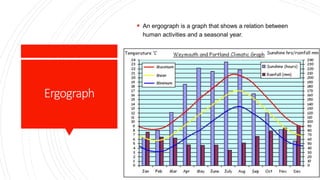
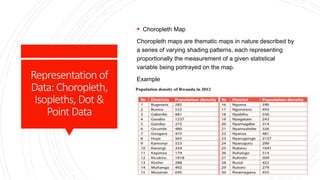
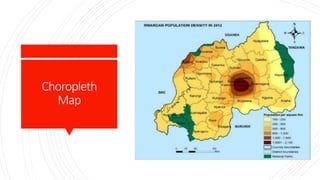
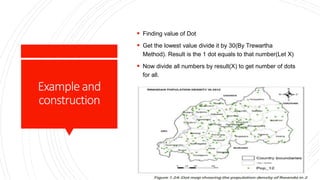
Cartography
BSC Geography 2nd Semester
BY:
Jackxs Lee
Bibliography
 Image credit- google.com & oldamu.ac
 References- oldamu.ac.in study materials compilation.
Syllabus
1. Concept of Thematic Cartography: Importance of
Thematic Maps.
2. Diagrammatic Data Presentation - Line graph- Simple,
Polygraph, Combined Line12Graph. Band Graph.
Climograph, Hythergraph, Erograph".
3. Representation of Data: Choropleth, Isopleths, Dot &
Point Data
4. Prismatic Compass Survey: Open and Closed
Practical Record: A Thematic Atlas should be prepared on a
specific theme with five plates of any state in India.
1.Conceptof
Thematic
Cartography:
What is Cartography
Cartography can be defined as a branch geography that
studies the art, science and techniques of map and chart
making.
What is Thematic Map
Thematic Map is a type of map specially designed to show a
particular theme or purpose. It can portray physical, social,
political, cultural, economic, sociological, or any other
aspects of a city, state, region, country, continent, or the
entire globe.
Importanceof
ThematicMaps
 Thematic Map is based on a specific theme or a particular subject.
It provides specific information about particular locations.
 It shows single information (e.g. weather, rail route, air route, road
route, population density etc.) in a map. While the general map
shows a variety of features (multiple information) in a single map.
 Thematic maps can be used to compare patterns on two or more
maps (e.g. income distribution of a region in two time period). In other
words, we can say that the Thematic maps are useful in studying the
relationship between two or more variables in a region.
 The geographical, social, physical, political, cultural and economic
aspects of a region can be analyzed with the help of thematic map.
 Thematic Maps can be used for spatial data analysis, formulating
hypotheses, synthesizing spatial data by revealing patterns and
relationships, and data presentation.
Examples
Examples
Examples
2.Diagrammatic
DataPresentation
 Line graph- Simple, Polygraph, Compound Line Graph or
Band Graph, Climograph, Hythergraph, Erograph.
Linegraph-
Simple
 A simple line graph is a kind of graph that is plotted with
only a single line.
Polygraph
 Polygraphs are also known as multiple line/curve graphs.
This form of statistical method is used to portray more
than one dependent variable
CompoundLine
GraphorBand
Graph
 A compound line graph is also known as a cumulative line
graph. It is the type of graph where a variety of variables
are presented as subsequent lines, lines are
superimposed above each other.
Compound Line
Graph orBand
Graph
Example
Climograph
 It is made by Griffith Taylor in first-half of 20th century.
Koeppen used this graph to show the variations in the world
climate. In the graph, the wet-bulb temperature (degree F) is
plotted on Y-axis and the relative humidity as monthly
average on X- axis. Twelve points, for each month are
plotted in graph with respect to the temperature and relative
humidity. These points are then joined to obtain a 12-sided
figure, which is called the climograph of a particular place.
 Terms used in climograph
 ➢ RAW – denotes wet-bulb temperature below 40 degree F
and relative humidity over 70%
 ➢ MUGGY – temperature over 60 degree F and RH over
70% ➢ SCORCHING – temperature over 60 degree F and
RH less than 40% ➢ KEEN- temperature below 40% F and
RH less than 40%
Climograph
Example
Hythergraph
 Also introduced by Griffith Taylor to show the relationship
between temperature and rainfall. Monthly temperature is
plotted on Y-axis and rainfall along X- axis
Ergograph
 An ergograph is a graph that shows a relation between
human activities and a seasonal year.
Representation of
Data: Choropleth,
Isopleths, Dot&
Point Data
 Choropleth Map
Choropleth maps are thematic maps in nature described by
a series of varying shading patterns, each representing
proportionally the measurement of a given statistical
variable being portrayed on the map.
Example
Choropleth
Map
IsoplethMap
 An isoline or isopleth map is a map with continuous lines
joining points of the same value. For instance, the lines
joining equal altitude (contour lines), temperature
(isotherms), barometric pressure (isobars), wind speed
(isotachs) and wind direction (isogon), etc.
DotMap
 A dot map is a map type that uses a dot symbol to show
the presence of a feature or phenomenon found within the
boundaries of a geographic area.
Exampleand
construction
 Finding value of Dot
 Get the lowest value divide it by 30(By Trewartha
Method). Result is the 1 dot equals to that number(Let X)
 Now divide all numbers by result(X) to get number of dots
for all.
Thank You
gm2766@myamu.ac.in

Thematic Cartography.pptx

  • 1.
    Cartography BSC Geography 2ndSemester BY: Jackxs Lee
  • 2.
    Bibliography  Image credit-google.com & oldamu.ac  References- oldamu.ac.in study materials compilation.
  • 3.
    Syllabus 1. Concept ofThematic Cartography: Importance of Thematic Maps. 2. Diagrammatic Data Presentation - Line graph- Simple, Polygraph, Combined Line12Graph. Band Graph. Climograph, Hythergraph, Erograph". 3. Representation of Data: Choropleth, Isopleths, Dot & Point Data 4. Prismatic Compass Survey: Open and Closed Practical Record: A Thematic Atlas should be prepared on a specific theme with five plates of any state in India.
  • 4.
    1.Conceptof Thematic Cartography: What is Cartography Cartographycan be defined as a branch geography that studies the art, science and techniques of map and chart making. What is Thematic Map Thematic Map is a type of map specially designed to show a particular theme or purpose. It can portray physical, social, political, cultural, economic, sociological, or any other aspects of a city, state, region, country, continent, or the entire globe.
  • 5.
    Importanceof ThematicMaps  Thematic Mapis based on a specific theme or a particular subject. It provides specific information about particular locations.  It shows single information (e.g. weather, rail route, air route, road route, population density etc.) in a map. While the general map shows a variety of features (multiple information) in a single map.  Thematic maps can be used to compare patterns on two or more maps (e.g. income distribution of a region in two time period). In other words, we can say that the Thematic maps are useful in studying the relationship between two or more variables in a region.  The geographical, social, physical, political, cultural and economic aspects of a region can be analyzed with the help of thematic map.  Thematic Maps can be used for spatial data analysis, formulating hypotheses, synthesizing spatial data by revealing patterns and relationships, and data presentation.
  • 6.
  • 7.
  • 8.
  • 9.
    2.Diagrammatic DataPresentation  Line graph-Simple, Polygraph, Compound Line Graph or Band Graph, Climograph, Hythergraph, Erograph.
  • 10.
    Linegraph- Simple  A simpleline graph is a kind of graph that is plotted with only a single line.
  • 11.
    Polygraph  Polygraphs arealso known as multiple line/curve graphs. This form of statistical method is used to portray more than one dependent variable
  • 12.
    CompoundLine GraphorBand Graph  A compoundline graph is also known as a cumulative line graph. It is the type of graph where a variety of variables are presented as subsequent lines, lines are superimposed above each other.
  • 13.
  • 14.
    Climograph  It ismade by Griffith Taylor in first-half of 20th century. Koeppen used this graph to show the variations in the world climate. In the graph, the wet-bulb temperature (degree F) is plotted on Y-axis and the relative humidity as monthly average on X- axis. Twelve points, for each month are plotted in graph with respect to the temperature and relative humidity. These points are then joined to obtain a 12-sided figure, which is called the climograph of a particular place.  Terms used in climograph  ➢ RAW – denotes wet-bulb temperature below 40 degree F and relative humidity over 70%  ➢ MUGGY – temperature over 60 degree F and RH over 70% ➢ SCORCHING – temperature over 60 degree F and RH less than 40% ➢ KEEN- temperature below 40% F and RH less than 40%
  • 15.
  • 16.
    Hythergraph  Also introducedby Griffith Taylor to show the relationship between temperature and rainfall. Monthly temperature is plotted on Y-axis and rainfall along X- axis
  • 17.
    Ergograph  An ergographis a graph that shows a relation between human activities and a seasonal year.
  • 18.
    Representation of Data: Choropleth, Isopleths,Dot& Point Data  Choropleth Map Choropleth maps are thematic maps in nature described by a series of varying shading patterns, each representing proportionally the measurement of a given statistical variable being portrayed on the map. Example
  • 19.
  • 20.
    IsoplethMap  An isolineor isopleth map is a map with continuous lines joining points of the same value. For instance, the lines joining equal altitude (contour lines), temperature (isotherms), barometric pressure (isobars), wind speed (isotachs) and wind direction (isogon), etc.
  • 21.
    DotMap  A dotmap is a map type that uses a dot symbol to show the presence of a feature or phenomenon found within the boundaries of a geographic area.
  • 22.
    Exampleand construction  Finding valueof Dot  Get the lowest value divide it by 30(By Trewartha Method). Result is the 1 dot equals to that number(Let X)  Now divide all numbers by result(X) to get number of dots for all.
  • 23.