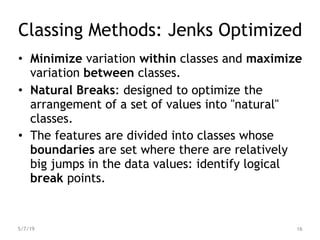
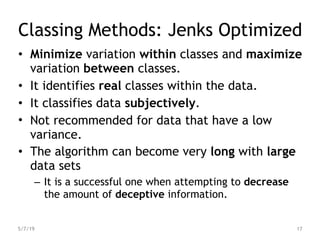
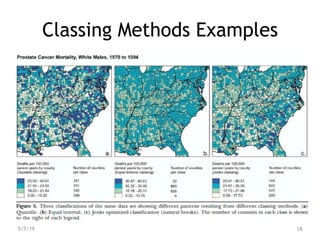
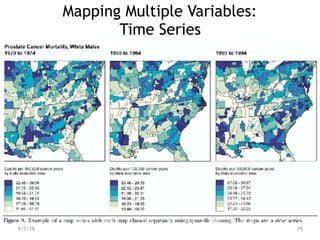
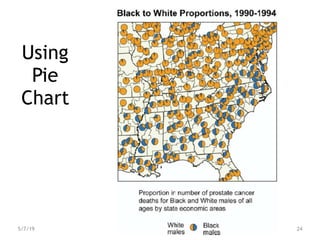
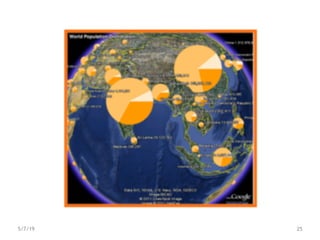
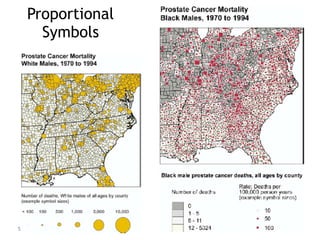
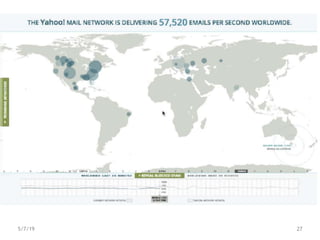
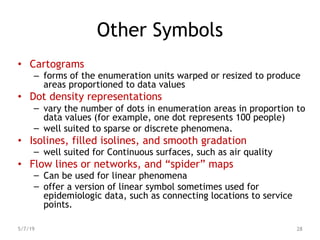
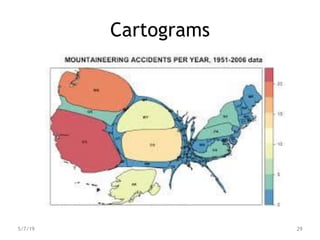
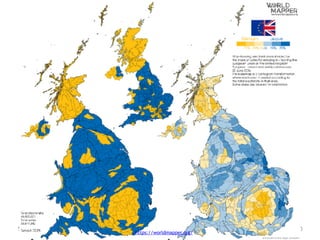
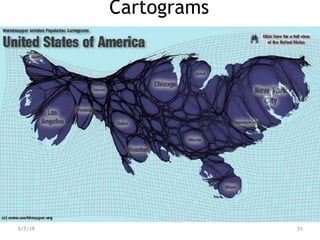
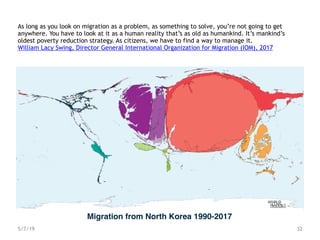
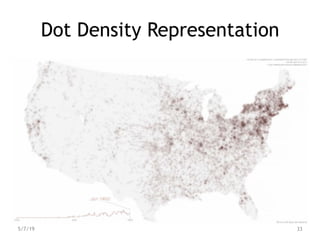
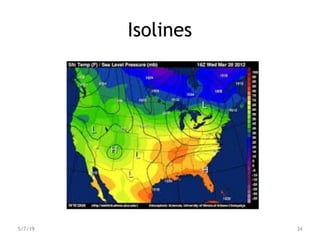
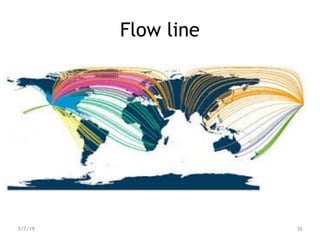
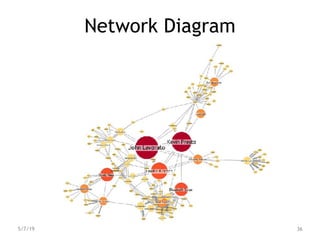
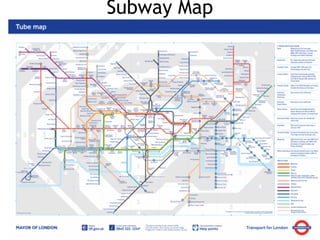
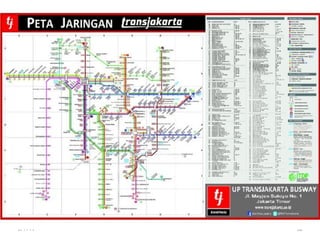
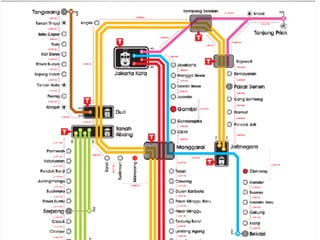
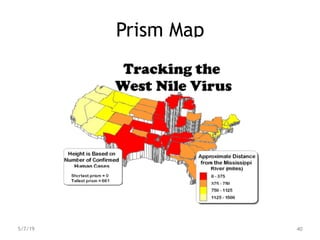
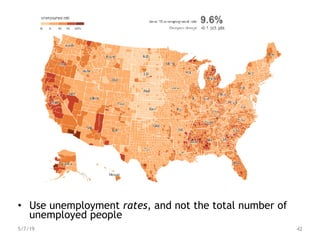
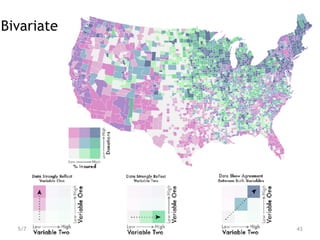
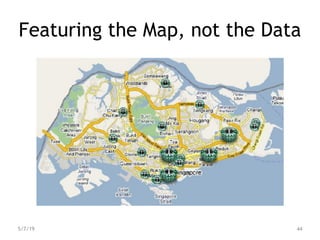
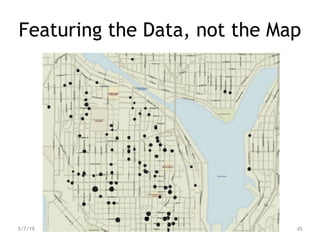
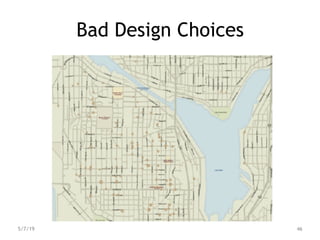
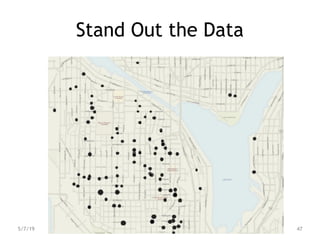
Data and Information Visualization:
Map Visualization
Semester 2 2018/2019
References
• Few Stephen, Introduction to Geographical
Data Visualization, Perceptual Edge Visual
Business Intelligence Newsletter, March/April
2009.
• Brewer, Cynthia A., Basic Mapping Principles
for Visualizing Cancer Data Using Geographic
Information Systems (GIS)
• Peterson, Gretchen N., GIS Cartography: A
Guide to Effective Map Design, CRC Press,
2009.
2
5/7/19
Contents
• Methods for Encoding Quantitative Data
on a Map
• Classing
• Mapping Multiple Variables
3
5/7/19
Which One is Cartographic Viz
or Map Viz?
5/7/19 4
Different maps, but same domain
• Applying cartographic
principles to visualization of
non-geographic information
(Skupin, 2000)
• Visualization methods for
interacting with geographic
information
(MacEachren, 1998)
5/7/19 5
Why Cartographic/Map Viz?
• Dynamic and interactive visualization of
geospatial information
– Focus and Context
– Linked highlighting
– Fluid navigation
• Spatial visualization of non-geospatial
data
– Cartographic principles
5/7/19 6
Two approaches best displaying
quantitative information on maps
1. Color Symbols:
– Variations in color intensity
2. Proportional Symbols:
– Variations in size
or combination both
7
5/7/19
Color Symbols
• The main goal is to order lightness (choropleth map)
– so it parallels ordering in the data.
• Use light-to-dark color for low-to-high values with a
constant hue
• A lightness sequence combined with a progression through
adjacent hues
– yellow–green–blue are adjacent in the ordering of hues through
the spectrum
• Spectral (rainbow) schemes are not well suited to
sequential data because lightness varies through the
spectrum
– Spectral schemes can be adjusted to better order lightness
– the light yellow hue can be used to emphasize critical values
within a data range.
5/7/19 8
Color Theory
• In painting, the word COLOR is the general term for
everything we see.
• Hue, Tint, Tone and Shade are the four categories
of color.
• However, the word HUE refers to the brightest 6 - 12
pure, unmixed pigment families on the Color Wheel.
• a TINT any Hue with White added. The color remains
the same only lighter.
• a TONE is any pure Hue with Neutral Gray added. The
color remains the same only less vibrant. The Values
can range from very light to very dark.
• a SHADE is any pure Hue with Black added. The color
remains the same only darker.
5/7/19 9
https://color-wheel-artist.com/hue/
Color Symbols
5/7/19 10
Sequential Schema: Available Tool
5/7/19 11
ColorBrewer.org
Diverging Schema
5/7/19 12
Classing Methods
1. Quantiles
– Assigns the same number of enumeration units to each class
(it is a generalized form of percentiles).
– Four quantiles (quartiles) allocate one quarter of the data
values to each class with the median at the middle break
2. Equal intervals
– Equal interval classing breaks the data range into equal
segments for predictable and equal class ranges
3. Jenks optimized method (natural breaks)
– Minimize variation within classes and maximize variation
between classes.
5/7/19 13
Classing Methods: Quantiles
• Assigns the same number of enumeration units to
each class (it is a generalized form of percentiles).
• Four quantiles (quartiles) allocate one quarter of
the data values to each class with the median at
the middle break
• Each class is equally represented on the map and the
classes are easy to compute.
• When using quantile classification gaps can occur
between the attribute values: lead to an over-
weighting of the outlier in that class division.
• If the number of classes is not correctly created, two
areas with the same value can end up in different
groups.
5/7/19 14
Classing Methods: Equal Intervals
• Equal interval classing breaks the data range into
equal segments for predictable and equal class
ranges
• The intervals can easily be computed
• The legend limits contain no missing values or
gaps
• The projections are easily interpreted
• It fails to consider how data are distributed along
the number line.
5/7/19 15
Classing Methods: Jenks Optimized
• Minimize variation within classes and maximize
variation between classes.
• Natural Breaks: designed to optimize the
arrangement of a set of values into "natural"
classes.
• The features are divided into classes whose
boundaries are set where there are relatively
big jumps in the data values: identify logical
break points.
5/7/19 16
Classing Methods: Jenks Optimized
• Minimize variation within classes and maximize
variation between classes.
• It identifies real classes within the data.
• It classifies data subjectively.
• Not recommended for data that have a low
variance.
• The algorithm can become very long with large
data sets
– It is a successful one when attempting to decrease
the amount of deceptive information.
5/7/19 17
Classing Methods Examples
5/7/19 18
Mapping Multiple Variables:
Time Series
5/7/19 19
Mapping Multiple Variables :
Class Breaks
5/7/19 20
• Be careful not to lie for your interest
• Most of it is bad maps intentionally created to distort or hide data.
5/7/19 21
Proportional Symbols
• Symbols such as circles and squares are usually
scaled in proportion to the square root of each
data value
• A symbol scaled by area, such as a square, is
more compact and easier to associate with the
location for which it represents data
– Sizes of linearly scaled symbols, such as bars, are
more accurately interpreted by map readers, but they
become impractical with large data ranges.
• The order of symbols:
– the smaller symbols appear above larger ones to aid
map reading.
5/7/19 22
Using Bar Graph
• Problems:
– The sets of bars don’t
share a common
baseline
– There wouldn’t be
enough room to place
bar charts everywhere
they’re needed
without overlapping
them
23
5/7/19
Using
Pie
Chart
24
5/7/19
5/7/19 25
Proportional
Symbols
5/7/19 26
5/7/19 27
Other Symbols
• Cartograms
– forms of the enumeration units warped or resized to produce
areas proportioned to data values
• Dot density representations
– vary the number of dots in enumeration areas in proportion to
data values (for example, one dot represents 100 people)
– well suited to sparse or discrete phenomena.
• Isolines, filled isolines, and smooth gradation
– well suited for Continuous surfaces, such as air quality
• Flow lines or networks, and “spider” maps
– Can be used for linear phenomena
– offer a version of linear symbol sometimes used for
epidemiologic data, such as connecting locations to service
points.
5/7/19 28
Cartograms
5/7/19 29
5/7/19 30
https://worldmapper.org/
Cartograms
5/7/19 31
As long as you look on migration as a problem, as something to solve, you’re not going to get
anywhere. You have to look at it as a human reality that’s as old as humankind. It’s mankind’s
oldest poverty reduction strategy. As citizens, we have to find a way to manage it.
William Lacy Swing, Director General International Organization for Migration (IOM), 2017
5/7/19 32
Migration from North Korea 1990-2017
Dot Density Representation
5/7/19 33
Isolines
5/7/19 34
Flow line
5/7/19 35
Network Diagram
5/7/19 36
Subway Map
5/7/19 37
5/7/19 38
5/7/19 39
Prism Map
5/7/19 40
Other Aspects
• Normalize, normalize, normalize
• Featuring the data
– Stand out the data
• Good uses of geographical data displays
• Collaboration between Maps and other
Visual Displays
5/7/19 41
• Use unemployment rates, and not the total number of
unemployed people
5/7/19 42
Bivariate
5/7/19 43
Featuring the Map, not the Data
44
5/7/19
Featuring the Data, not the Map
45
5/7/19
Bad Design Choices
46
5/7/19
Stand Out the Data
47
5/7/19
Good Uses of Geographical Data
Displays
• Just because we can
display data on a
map doesn’t mean
we should.
• When to use map:
– location is an
important part of the
meaning you’re
trying to discover or
the story you’re
trying to tell
48
5/7/19
Less effective than a simple table or bar
graph
Regional label : “West”, “North Central”,
“South Central” and “East.”
Good Uses of Geographical Data
Displays
49
5/7/19
Good Uses of Geographical Data
Displays
50
5/7/19
Collaboration between Maps and other Visual
Displays
51
5/7/19
Example
5/7/19 52
5/7/19
Example
53
5/7/19 54
5/7/19 55
5/7/19 56
In this 1881 map, the Canadian Pacific Railway tried to make western lands seem more inviting for
settlement by suggesting that it was adequately serviced by rail. The map draws the viewer's
attention to a completed transcontinental rail line, but the lack of station stops west of Swift Current
suggests otherwise. The map also shows branch railways feeding into the main CPR line that were not
opened until years later.
(Library and Archives Canada, NMC 11868)
5/7/19 57

12. Map Visualization .pdf

  • 1.
    Data and InformationVisualization: Map Visualization Semester 2 2018/2019
  • 2.
    References • Few Stephen,Introduction to Geographical Data Visualization, Perceptual Edge Visual Business Intelligence Newsletter, March/April 2009. • Brewer, Cynthia A., Basic Mapping Principles for Visualizing Cancer Data Using Geographic Information Systems (GIS) • Peterson, Gretchen N., GIS Cartography: A Guide to Effective Map Design, CRC Press, 2009. 2 5/7/19
  • 3.
    Contents • Methods forEncoding Quantitative Data on a Map • Classing • Mapping Multiple Variables 3 5/7/19
  • 4.
    Which One isCartographic Viz or Map Viz? 5/7/19 4
  • 5.
    Different maps, butsame domain • Applying cartographic principles to visualization of non-geographic information (Skupin, 2000) • Visualization methods for interacting with geographic information (MacEachren, 1998) 5/7/19 5
  • 6.
    Why Cartographic/Map Viz? •Dynamic and interactive visualization of geospatial information – Focus and Context – Linked highlighting – Fluid navigation • Spatial visualization of non-geospatial data – Cartographic principles 5/7/19 6
  • 7.
    Two approaches bestdisplaying quantitative information on maps 1. Color Symbols: – Variations in color intensity 2. Proportional Symbols: – Variations in size or combination both 7 5/7/19
  • 8.
    Color Symbols • Themain goal is to order lightness (choropleth map) – so it parallels ordering in the data. • Use light-to-dark color for low-to-high values with a constant hue • A lightness sequence combined with a progression through adjacent hues – yellow–green–blue are adjacent in the ordering of hues through the spectrum • Spectral (rainbow) schemes are not well suited to sequential data because lightness varies through the spectrum – Spectral schemes can be adjusted to better order lightness – the light yellow hue can be used to emphasize critical values within a data range. 5/7/19 8
  • 9.
    Color Theory • Inpainting, the word COLOR is the general term for everything we see. • Hue, Tint, Tone and Shade are the four categories of color. • However, the word HUE refers to the brightest 6 - 12 pure, unmixed pigment families on the Color Wheel. • a TINT any Hue with White added. The color remains the same only lighter. • a TONE is any pure Hue with Neutral Gray added. The color remains the same only less vibrant. The Values can range from very light to very dark. • a SHADE is any pure Hue with Black added. The color remains the same only darker. 5/7/19 9 https://color-wheel-artist.com/hue/
  • 10.
  • 11.
    Sequential Schema: AvailableTool 5/7/19 11 ColorBrewer.org
  • 12.
  • 13.
    Classing Methods 1. Quantiles –Assigns the same number of enumeration units to each class (it is a generalized form of percentiles). – Four quantiles (quartiles) allocate one quarter of the data values to each class with the median at the middle break 2. Equal intervals – Equal interval classing breaks the data range into equal segments for predictable and equal class ranges 3. Jenks optimized method (natural breaks) – Minimize variation within classes and maximize variation between classes. 5/7/19 13
  • 14.
    Classing Methods: Quantiles •Assigns the same number of enumeration units to each class (it is a generalized form of percentiles). • Four quantiles (quartiles) allocate one quarter of the data values to each class with the median at the middle break • Each class is equally represented on the map and the classes are easy to compute. • When using quantile classification gaps can occur between the attribute values: lead to an over- weighting of the outlier in that class division. • If the number of classes is not correctly created, two areas with the same value can end up in different groups. 5/7/19 14
  • 15.
    Classing Methods: EqualIntervals • Equal interval classing breaks the data range into equal segments for predictable and equal class ranges • The intervals can easily be computed • The legend limits contain no missing values or gaps • The projections are easily interpreted • It fails to consider how data are distributed along the number line. 5/7/19 15
  • 16.
    Classing Methods: JenksOptimized • Minimize variation within classes and maximize variation between classes. • Natural Breaks: designed to optimize the arrangement of a set of values into "natural" classes. • The features are divided into classes whose boundaries are set where there are relatively big jumps in the data values: identify logical break points. 5/7/19 16
  • 17.
    Classing Methods: JenksOptimized • Minimize variation within classes and maximize variation between classes. • It identifies real classes within the data. • It classifies data subjectively. • Not recommended for data that have a low variance. • The algorithm can become very long with large data sets – It is a successful one when attempting to decrease the amount of deceptive information. 5/7/19 17
  • 18.
  • 19.
  • 20.
    Mapping Multiple Variables: Class Breaks 5/7/19 20
  • 21.
    • Be carefulnot to lie for your interest • Most of it is bad maps intentionally created to distort or hide data. 5/7/19 21
  • 22.
    Proportional Symbols • Symbolssuch as circles and squares are usually scaled in proportion to the square root of each data value • A symbol scaled by area, such as a square, is more compact and easier to associate with the location for which it represents data – Sizes of linearly scaled symbols, such as bars, are more accurately interpreted by map readers, but they become impractical with large data ranges. • The order of symbols: – the smaller symbols appear above larger ones to aid map reading. 5/7/19 22
  • 23.
    Using Bar Graph •Problems: – The sets of bars don’t share a common baseline – There wouldn’t be enough room to place bar charts everywhere they’re needed without overlapping them 23 5/7/19
  • 24.
  • 25.
  • 26.
  • 27.
  • 28.
    Other Symbols • Cartograms –forms of the enumeration units warped or resized to produce areas proportioned to data values • Dot density representations – vary the number of dots in enumeration areas in proportion to data values (for example, one dot represents 100 people) – well suited to sparse or discrete phenomena. • Isolines, filled isolines, and smooth gradation – well suited for Continuous surfaces, such as air quality • Flow lines or networks, and “spider” maps – Can be used for linear phenomena – offer a version of linear symbol sometimes used for epidemiologic data, such as connecting locations to service points. 5/7/19 28
  • 29.
  • 30.
  • 31.
  • 32.
    As long asyou look on migration as a problem, as something to solve, you’re not going to get anywhere. You have to look at it as a human reality that’s as old as humankind. It’s mankind’s oldest poverty reduction strategy. As citizens, we have to find a way to manage it. William Lacy Swing, Director General International Organization for Migration (IOM), 2017 5/7/19 32 Migration from North Korea 1990-2017
  • 33.
  • 34.
  • 35.
  • 36.
  • 37.
  • 38.
  • 39.
  • 40.
  • 41.
    Other Aspects • Normalize,normalize, normalize • Featuring the data – Stand out the data • Good uses of geographical data displays • Collaboration between Maps and other Visual Displays 5/7/19 41
  • 42.
    • Use unemploymentrates, and not the total number of unemployed people 5/7/19 42
  • 43.
  • 44.
    Featuring the Map,not the Data 44 5/7/19
  • 45.
    Featuring the Data,not the Map 45 5/7/19
  • 46.
  • 47.
    Stand Out theData 47 5/7/19
  • 48.
    Good Uses ofGeographical Data Displays • Just because we can display data on a map doesn’t mean we should. • When to use map: – location is an important part of the meaning you’re trying to discover or the story you’re trying to tell 48 5/7/19 Less effective than a simple table or bar graph Regional label : “West”, “North Central”, “South Central” and “East.”
  • 49.
    Good Uses ofGeographical Data Displays 49 5/7/19
  • 50.
    Good Uses ofGeographical Data Displays 50 5/7/19
  • 51.
    Collaboration between Mapsand other Visual Displays 51 5/7/19
  • 52.
  • 53.
  • 54.
  • 55.
  • 56.
    5/7/19 56 In this1881 map, the Canadian Pacific Railway tried to make western lands seem more inviting for settlement by suggesting that it was adequately serviced by rail. The map draws the viewer's attention to a completed transcontinental rail line, but the lack of station stops west of Swift Current suggests otherwise. The map also shows branch railways feeding into the main CPR line that were not opened until years later. (Library and Archives Canada, NMC 11868)
  • 57.