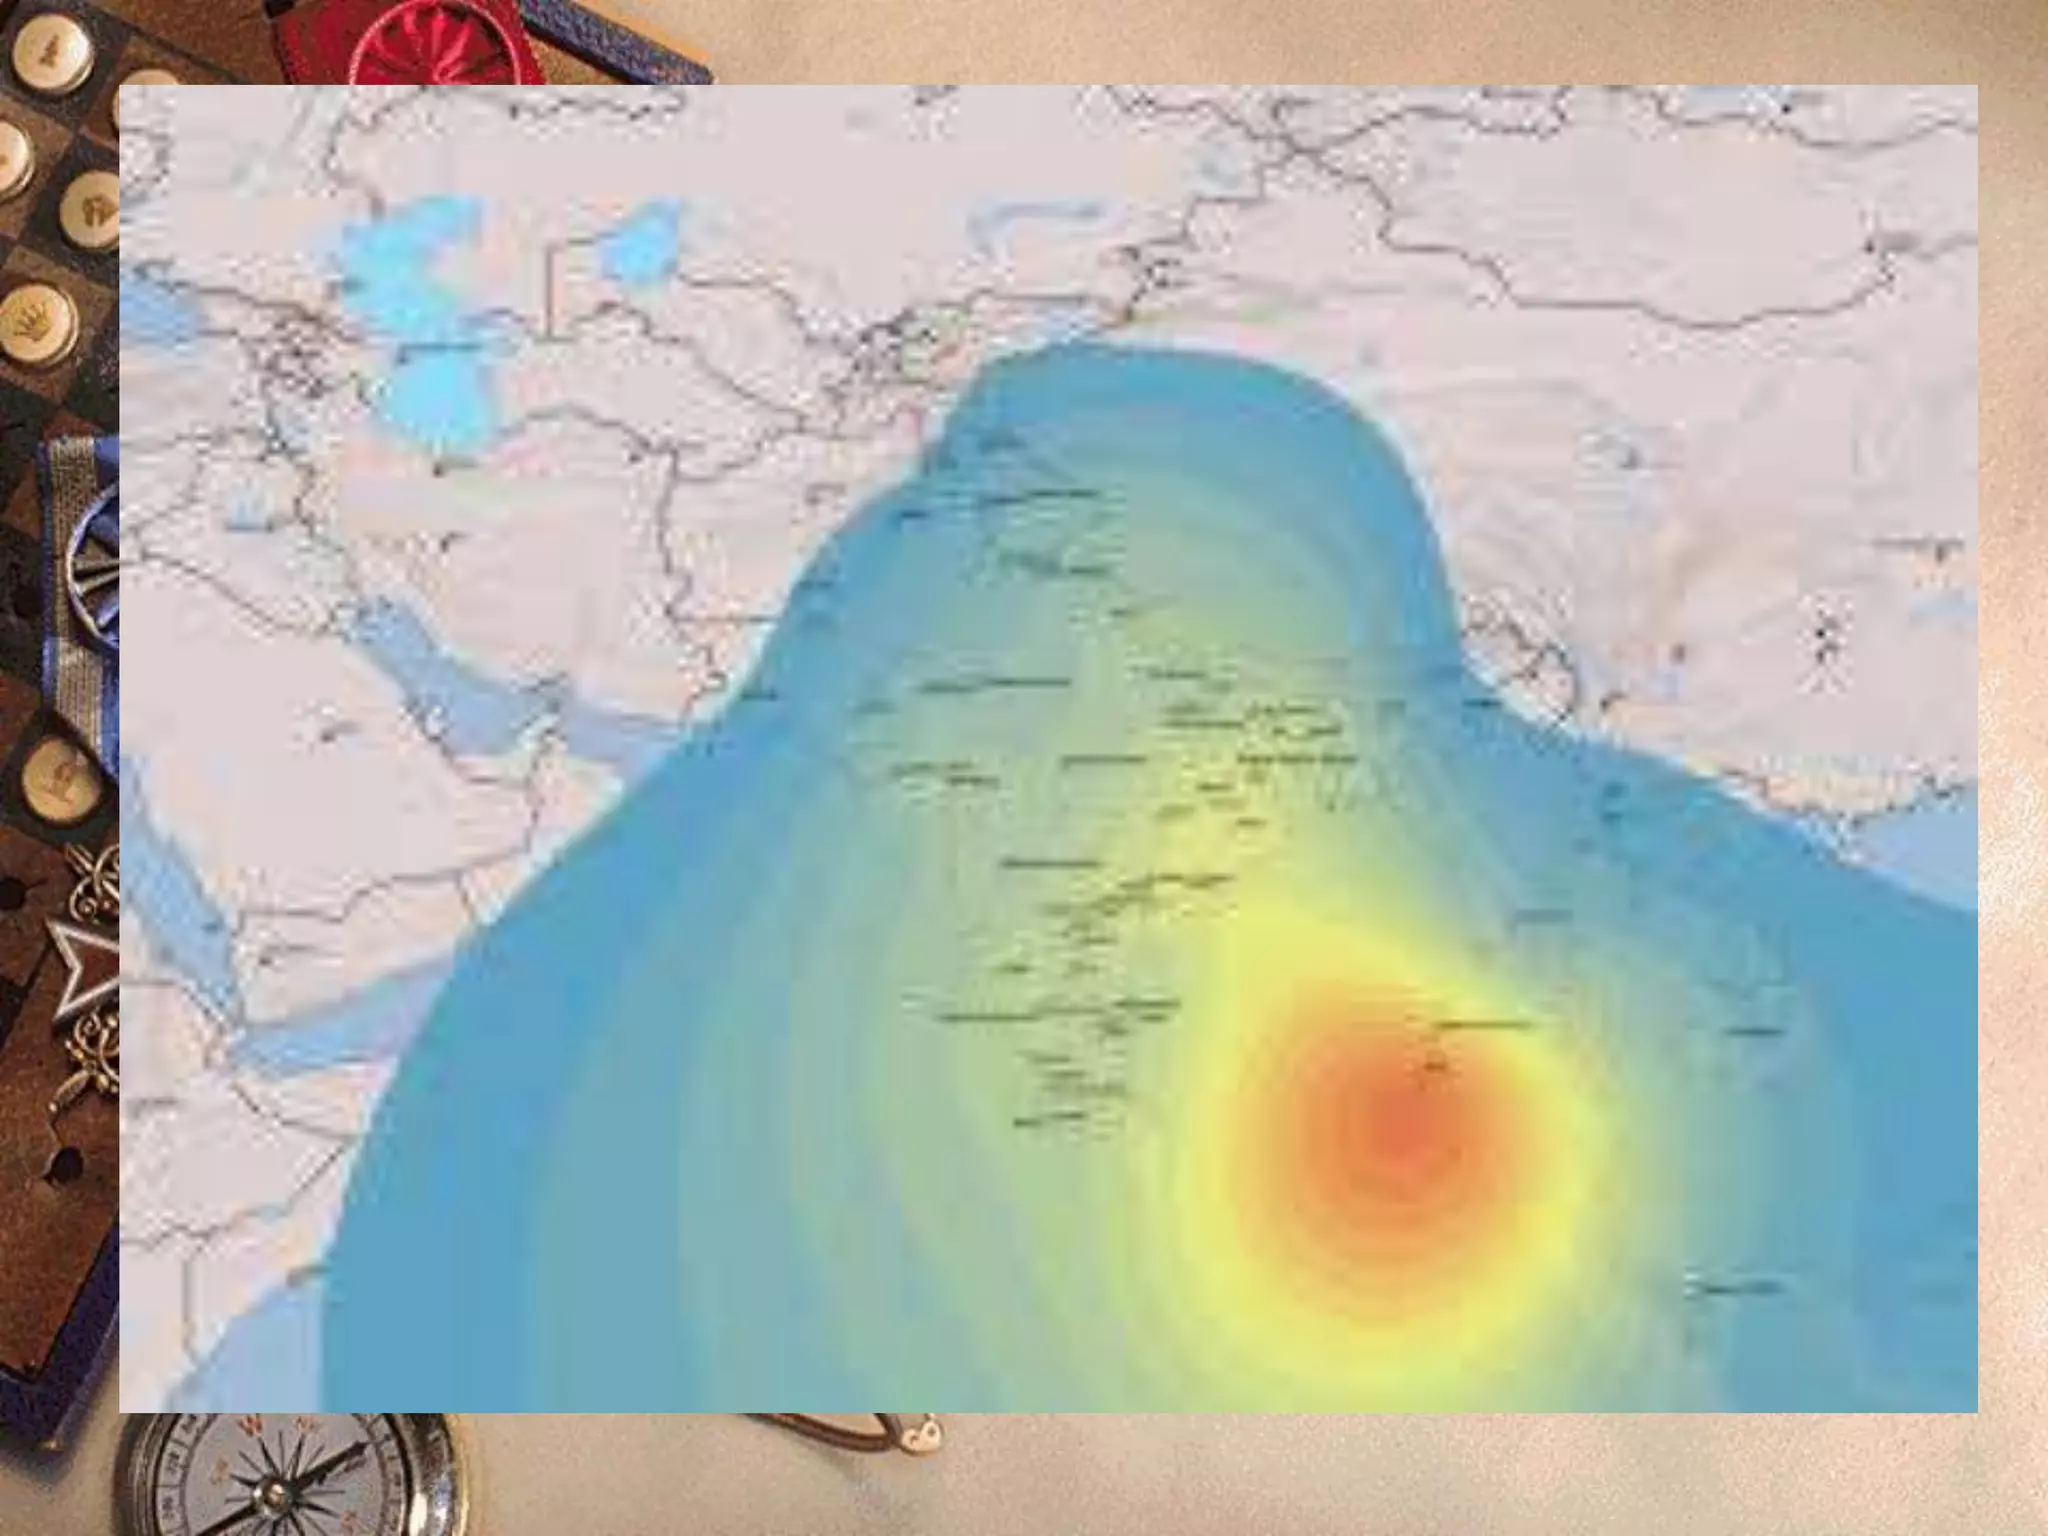
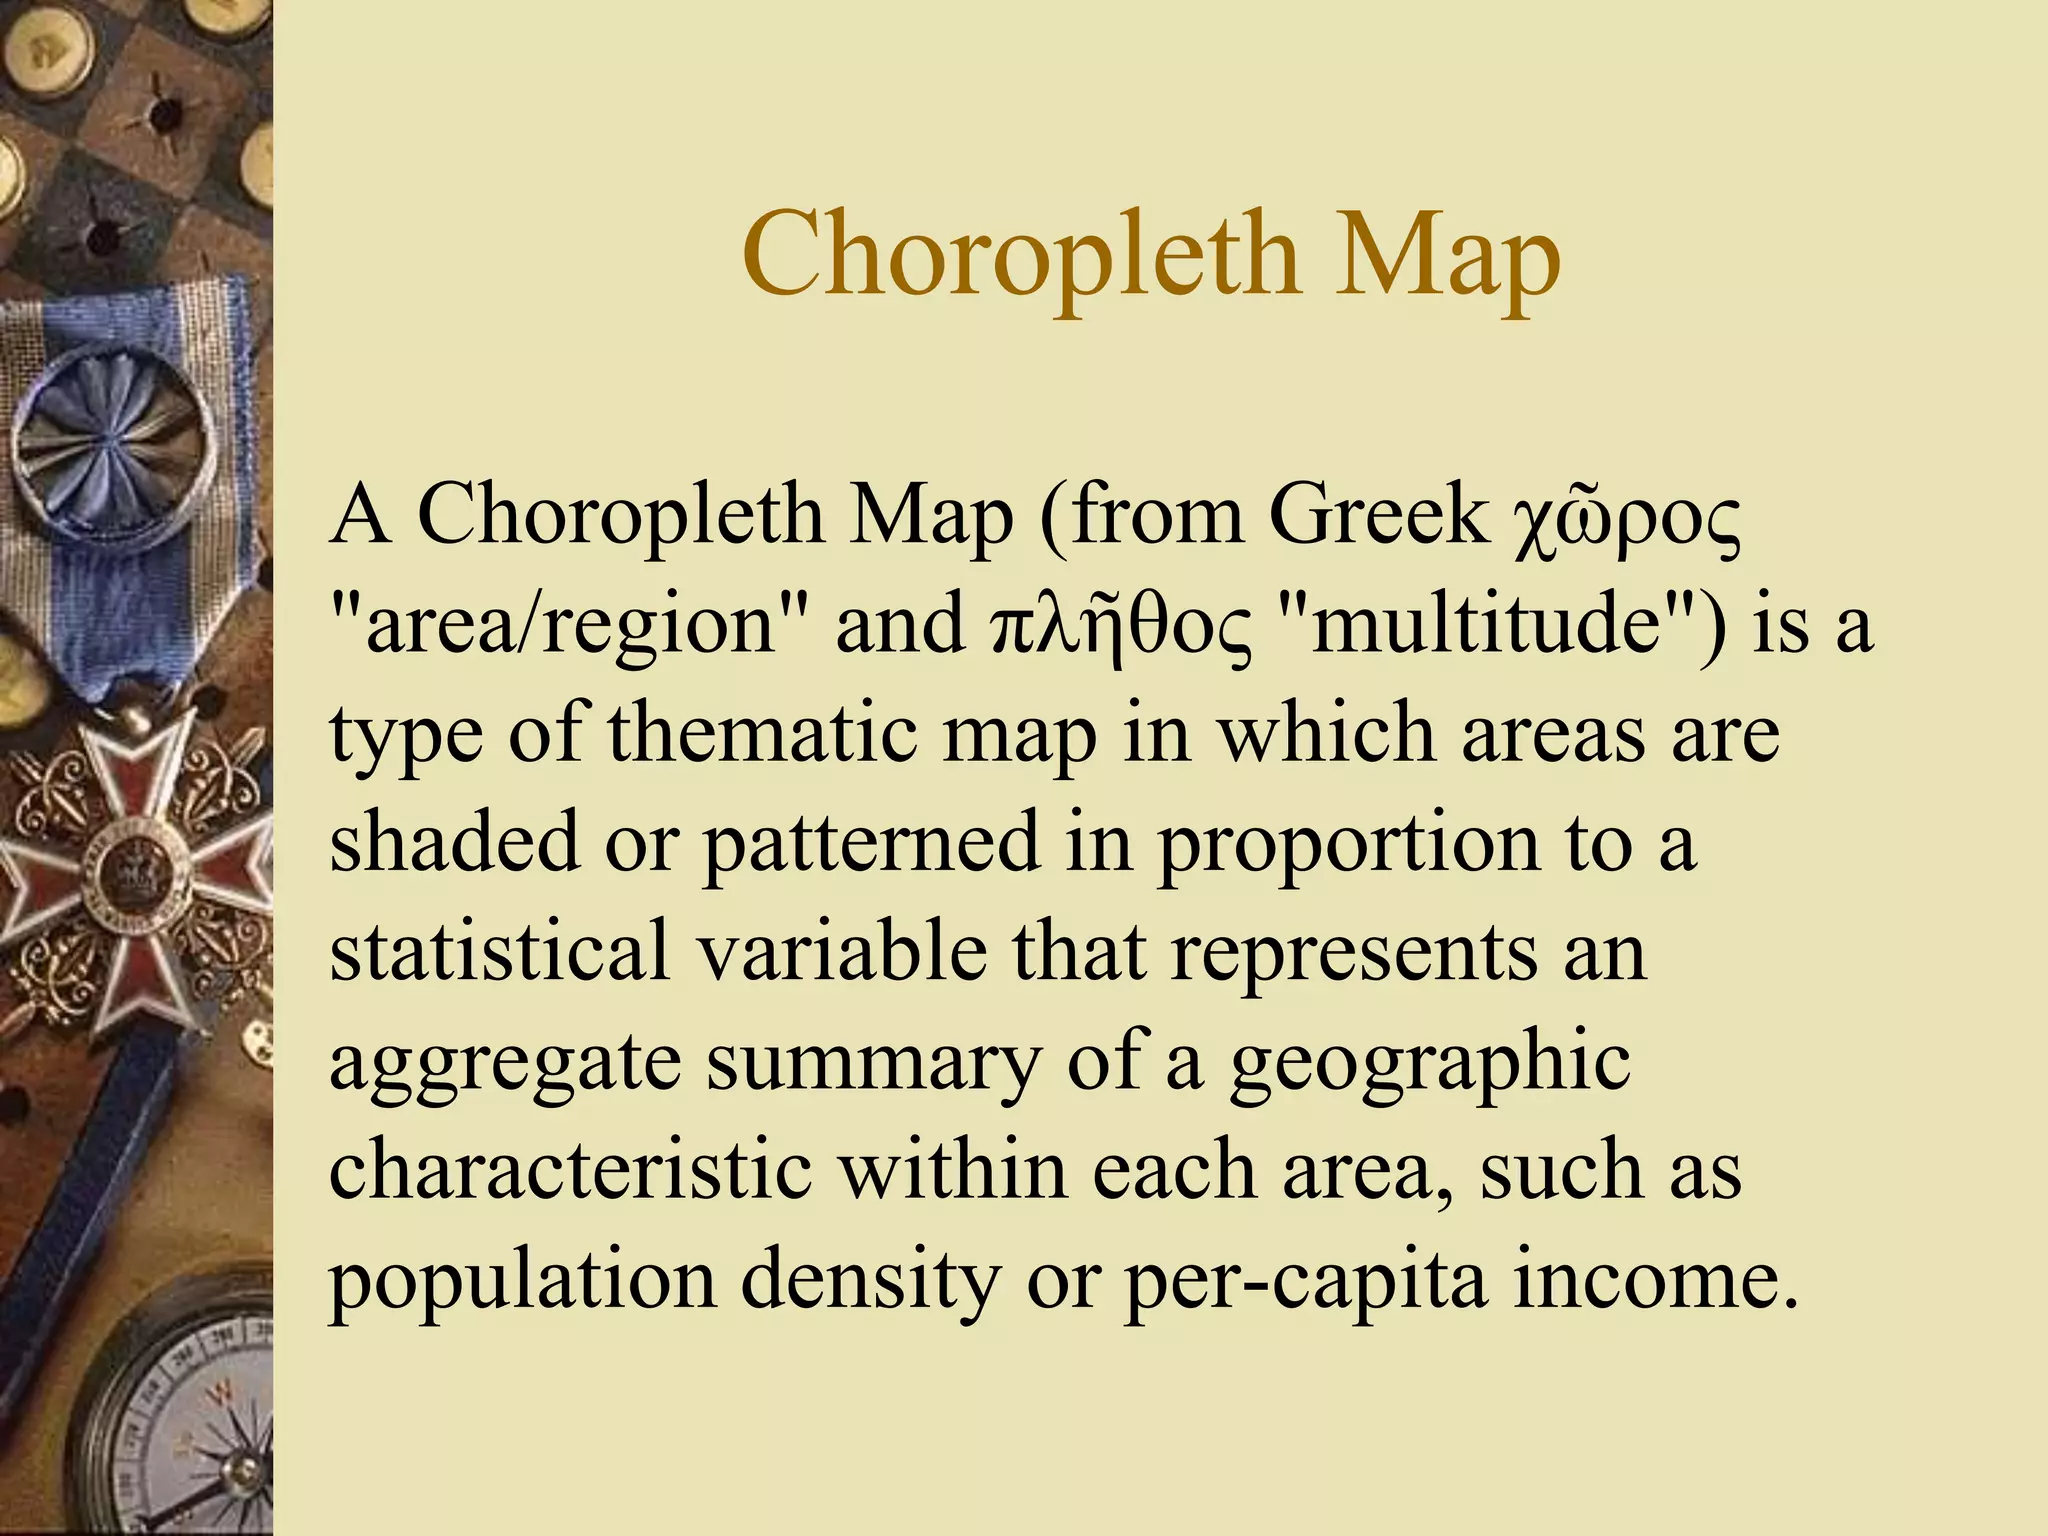
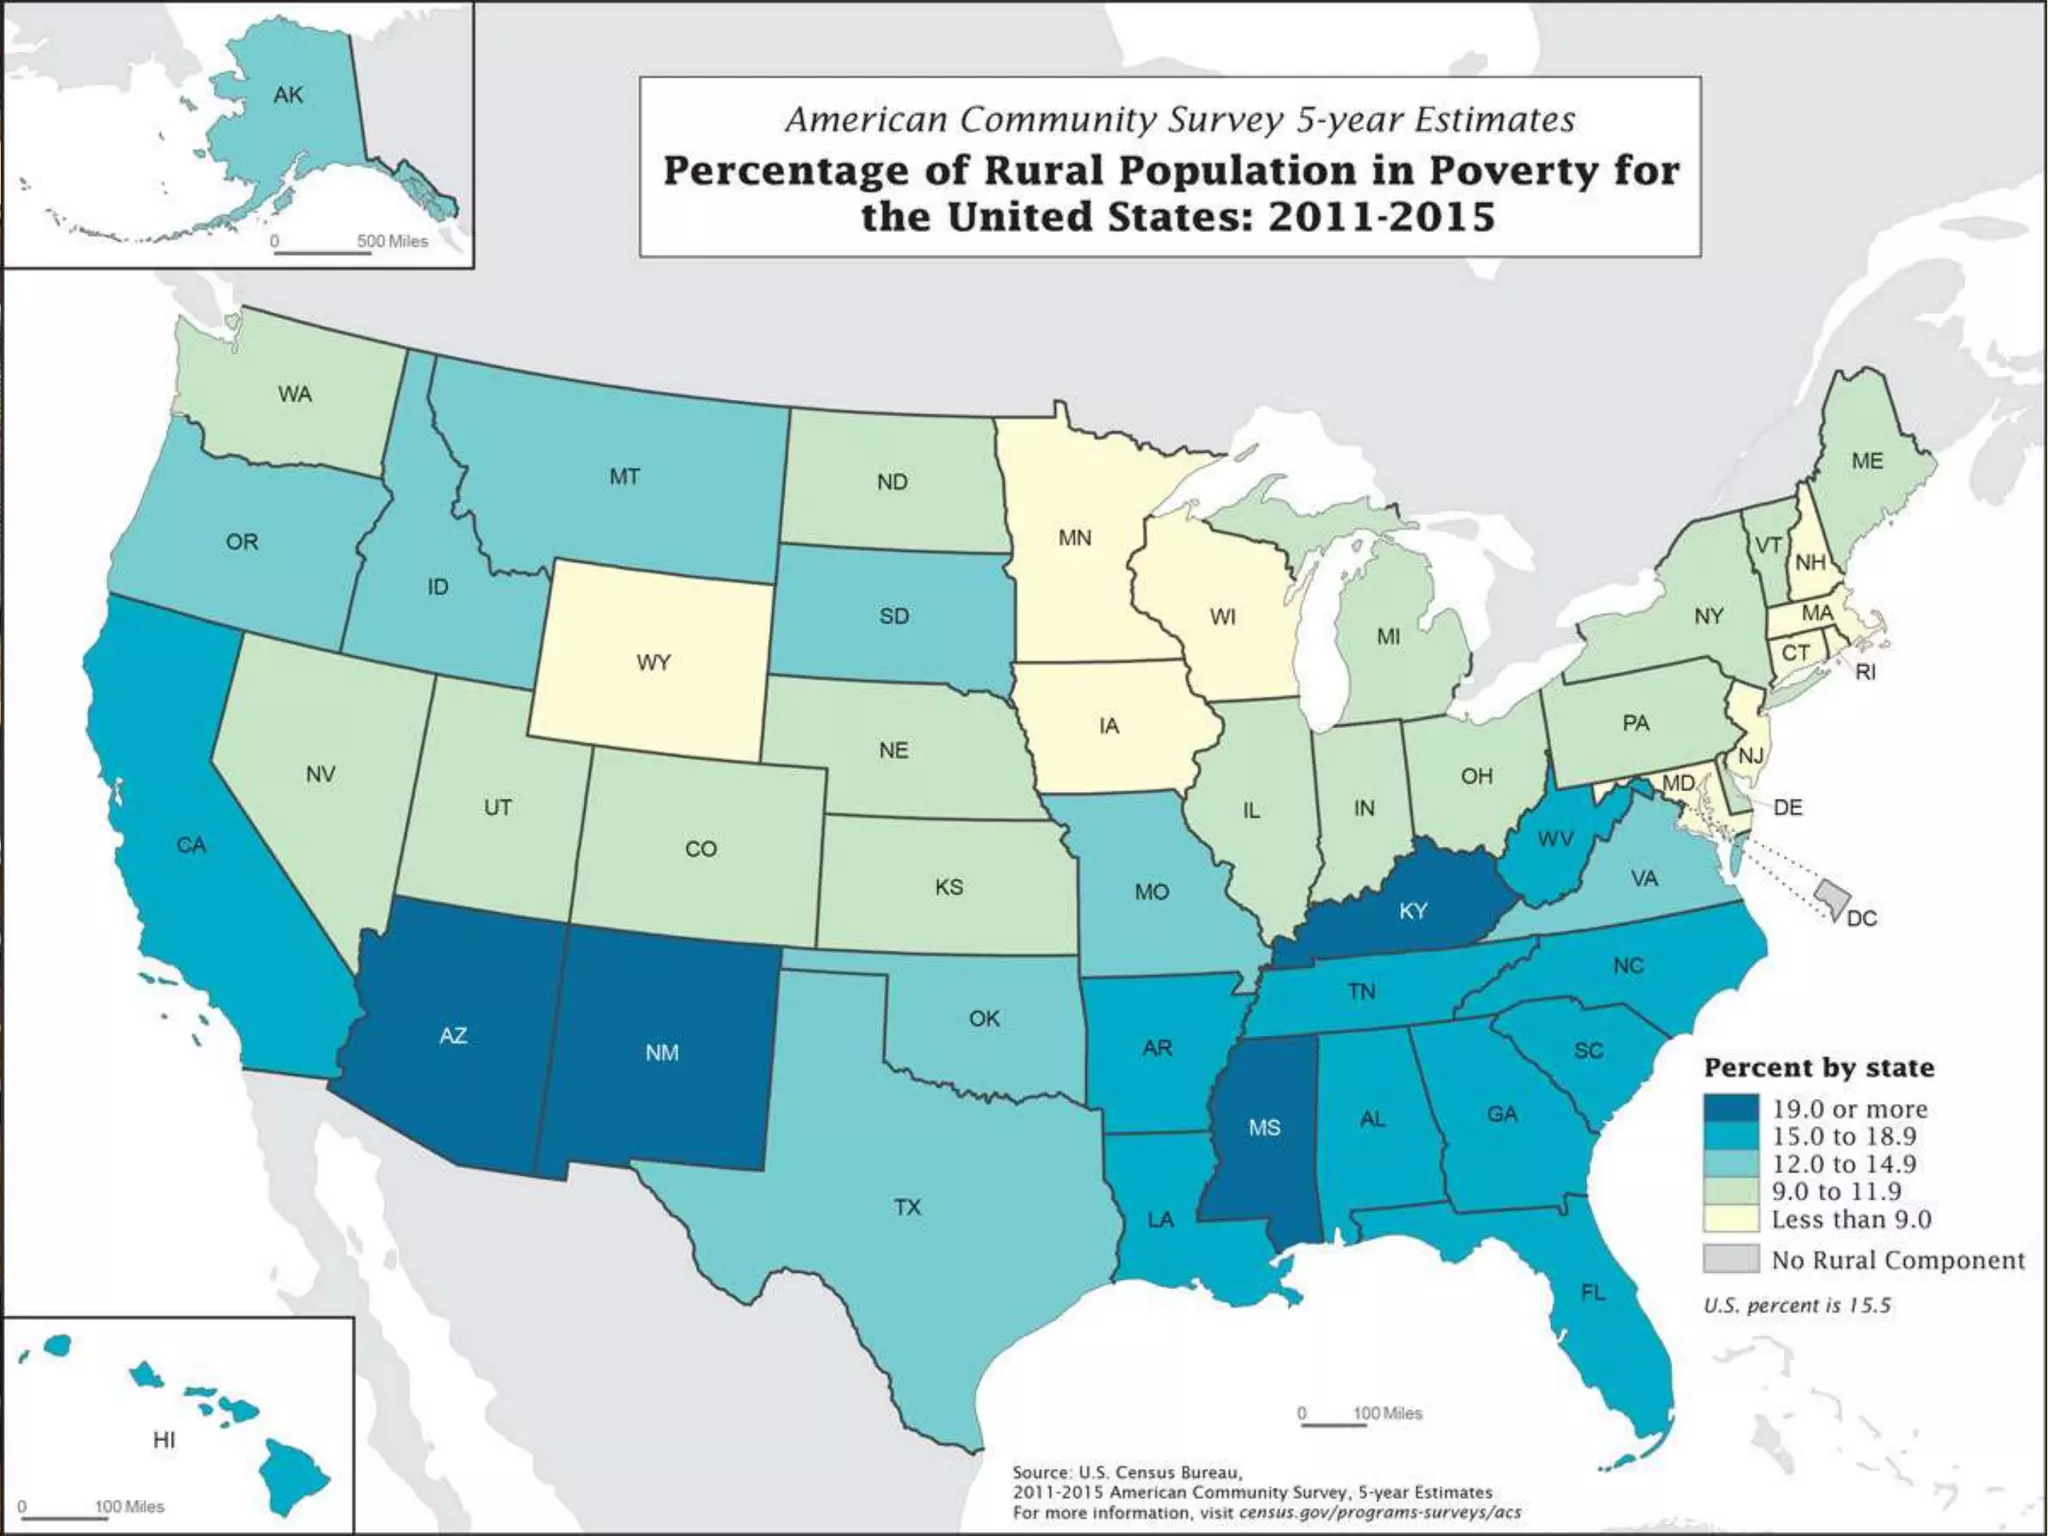
This document discusses different types of thematic maps including choropleth maps, chorochromatic maps, choroschematic maps, dot distribution maps, cartograms, cadastrel maps, topographic maps, contour lines, and isopleth maps. It provides brief definitions and descriptions of each type of map. For example, it explains that a choropleth map uses shading or patterns to represent statistical data within geographic areas, a chorochromatic map uses color variations to represent categorical data regions, and a topographic map shows natural and artificial features using contour lines of equal elevation.
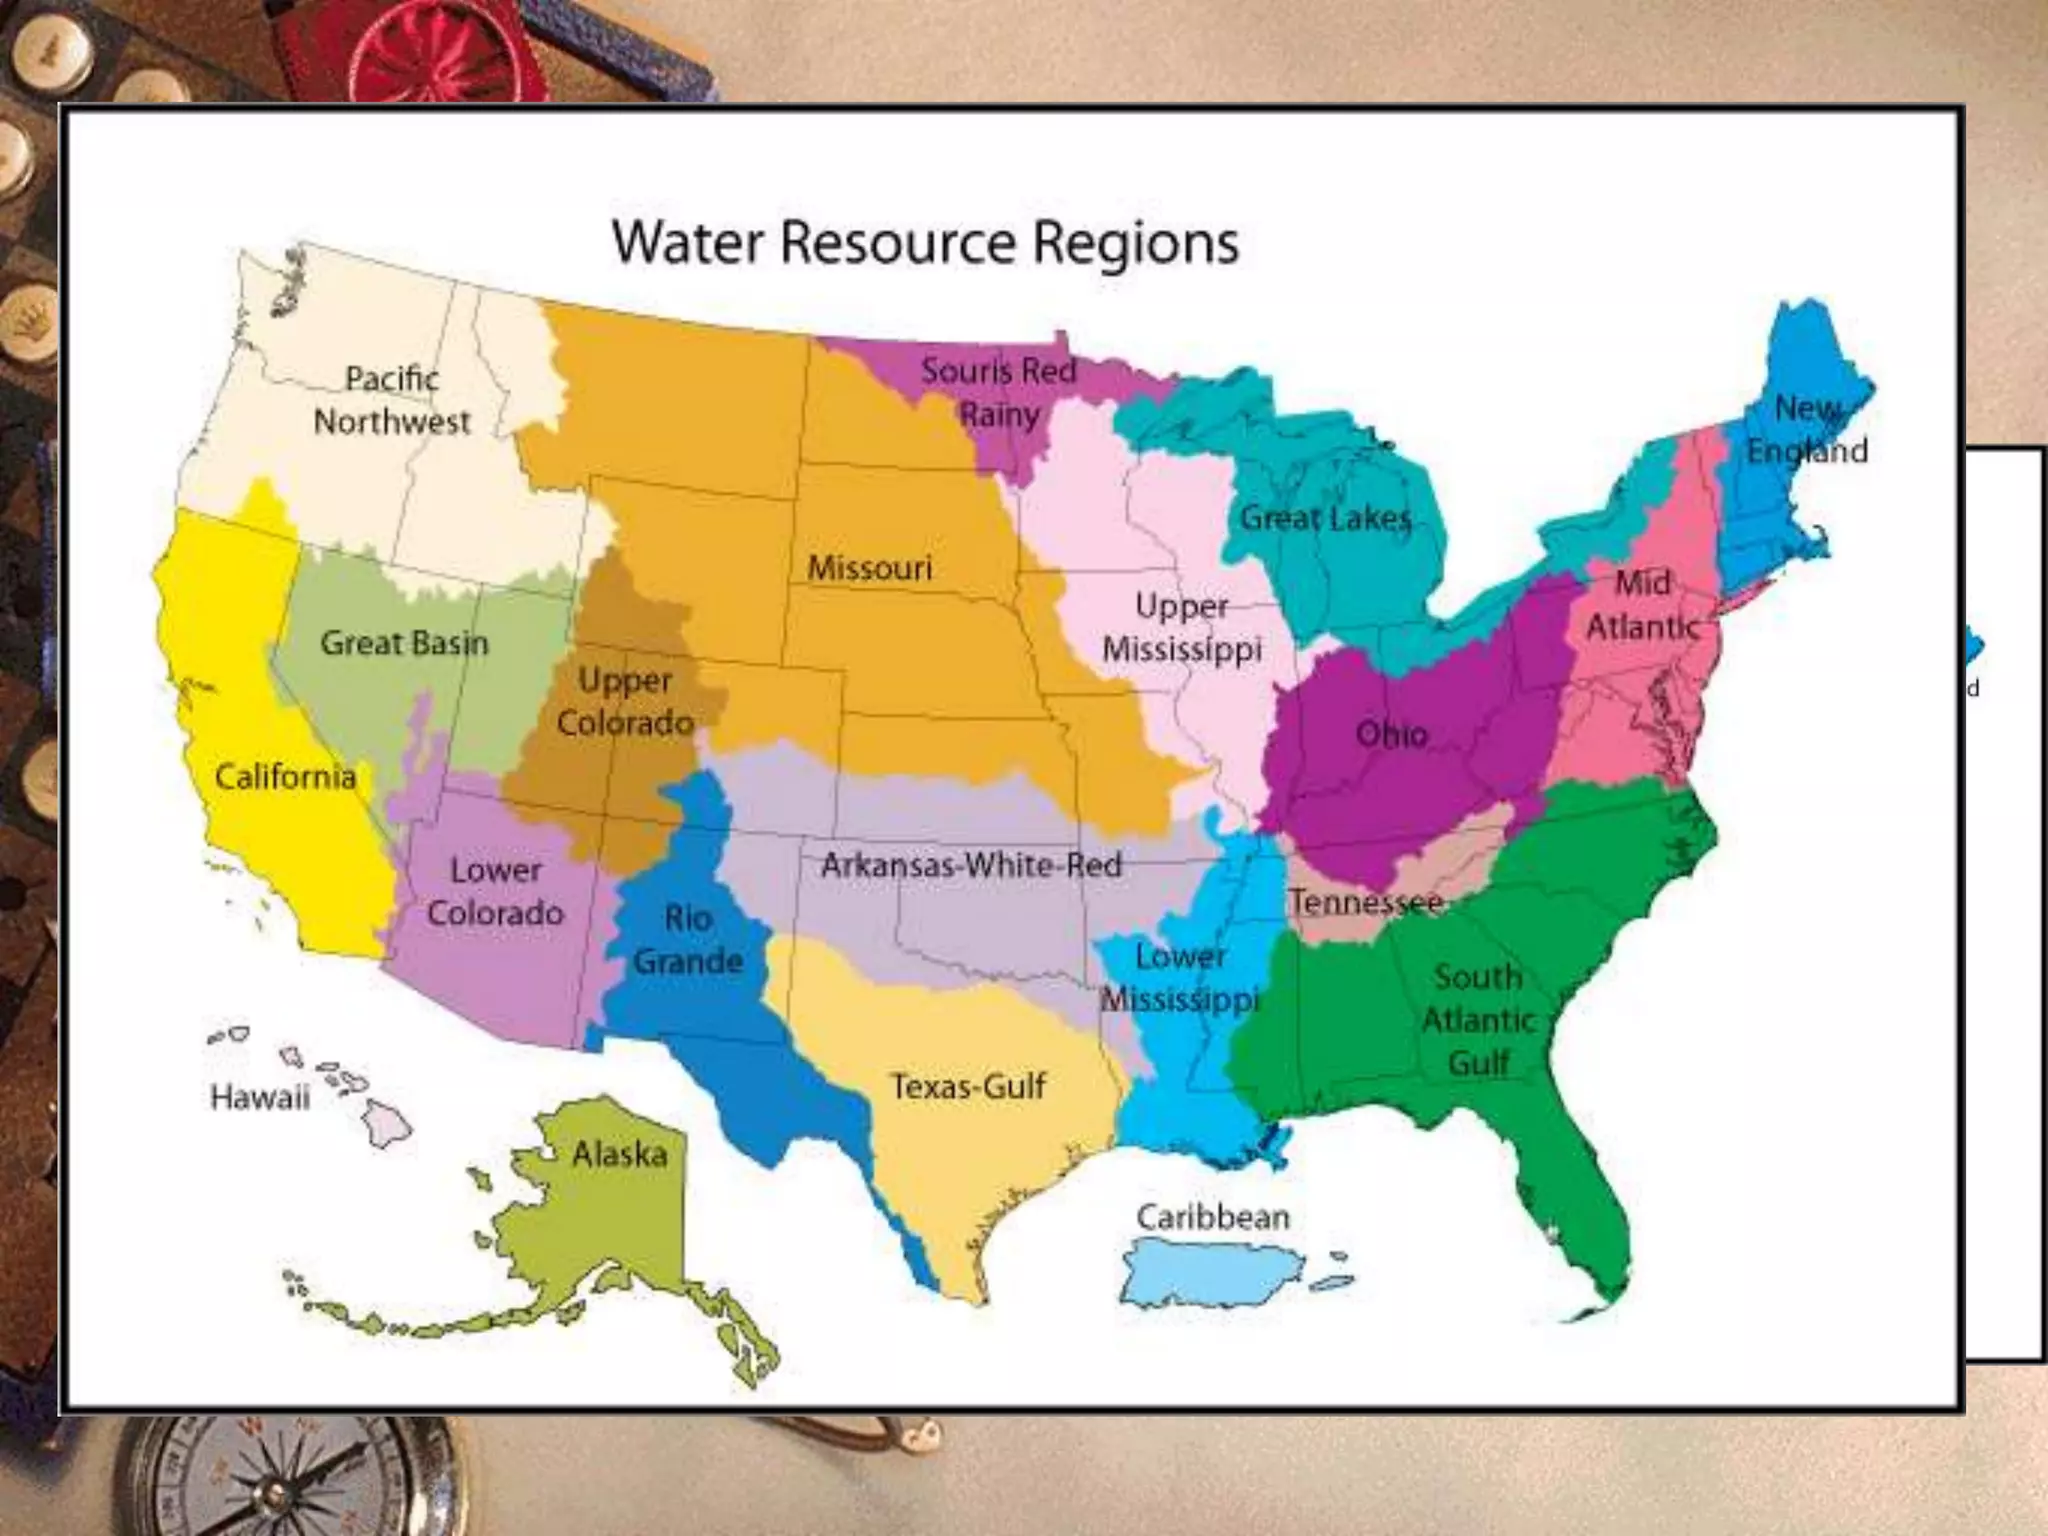
![Chorochromatic Map
A Chorochromatic Map (from Greek χώρα
[khṓra, “location”] and χρῶμα [khrôma,
“color”]), also known as an area-class or
qualitative area maps, is a type of thematic
map that portray regions of categorical or
nominal data using variations in color
symbols.](https://image.slidesharecdn.com/types-of-maps-part2-200802153444/75/Types-of-maps-part-2-4-2048.jpg)

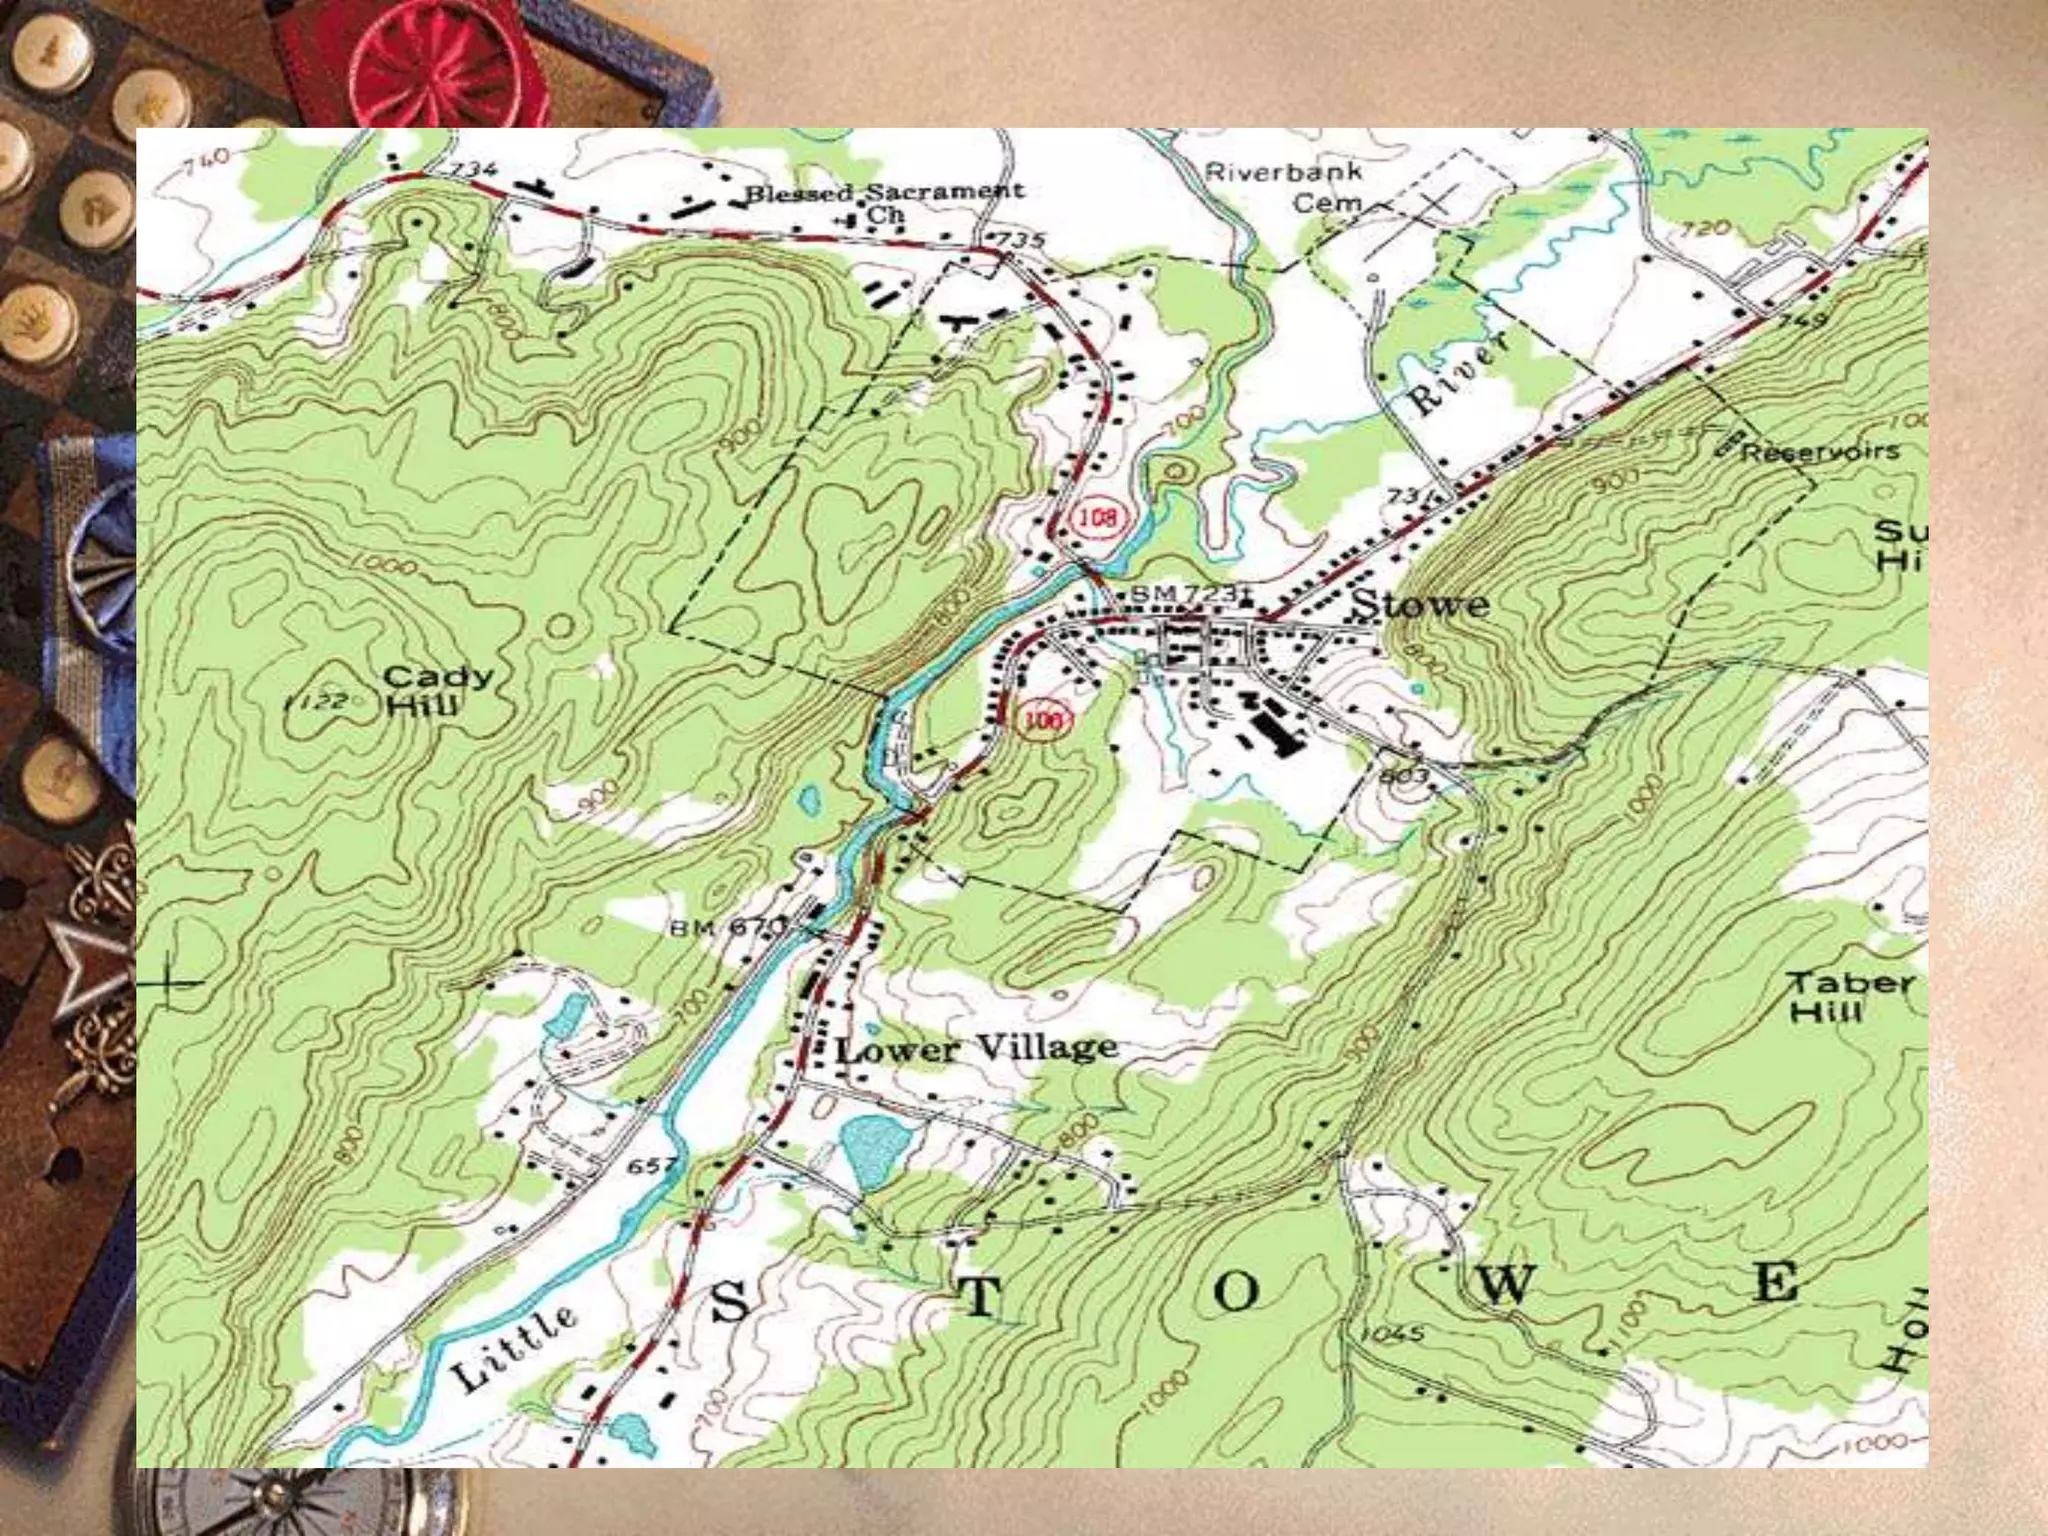
![Topographic Map
A topographic map or topographic sheet is a type of map characterized
by large-scale detail and quantitative representation of relief, usually
using contour lines (connecting points of equal elevation), but
historically using a variety of methods. Traditional definitions require a
topographic map to show both natural and artificial features.[2] A
topographic survey is typically based upon systematic observation and
published as a map series, made up of two or more map sheets that
combine to form the whole map. A topographic map series uses a
common specification that includes the range of cartographic symbols
employed, as well as a standard geodetic framework that defines the map
projection, coordinate system, ellipsoid and geodetic datum. Official
topographic maps also adopt a national grid referencing system.](https://image.slidesharecdn.com/types-of-maps-part2-200802153444/75/Types-of-maps-part-2-14-2048.jpg)