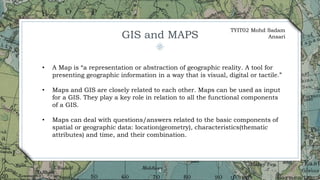
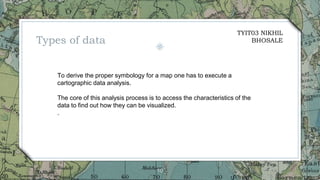
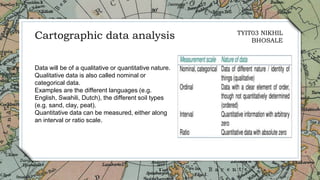
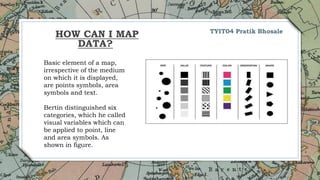
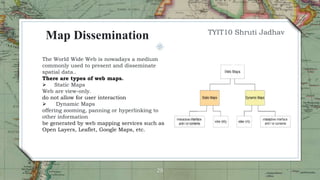
SlideShare a Scribd company logo
1 of 31
GIS
Unit V
Grp 1 TYIT01 - TYIT10
2
Topic Division
Roll Number Name Topics
TYIT01 Roshith Prakash Visualization process
TYIT02 Mohd Sadam Ansari Gis and Maps
TYIT03 Nikhil Bhosale Types of data
TYIT04 Pratik Bhosale How to map data
TYIT05 Gaurav Das How to map qualitative data
TYIT06 Anushka Desai How to map quatitative data
TYIT07 Amol Gaikwad How to map terrain elevation
TYIT08 Sonal Gaud How to map time series
TYIT09 Chaitanya Gorule Map cosmetics
TYIT10 Shruti Jadhav Map dissemination
Data Visualization
GIS and MAPS
4
• A Map is “a representation or abstraction of geographic reality. A tool for
presenting geographic information in a way that is visual, digital or tactile.”
• Maps and GIS are closely related to each other. Maps can be used as input
for a GIS. They play a key role in relation to all the functional components
of a GIS.
• Maps can deal with questions/answers related to the basic components of
spatial or geographic data: location(geometry), characteristics(thematic
attributes) and time, and their combination.
TYIT02 Mohd Sadam
Ansari
TYIT02 Mohd Sadam
Ansari
Comparison of Aerial Photograph and a Map.
Traditionally Maps are divided into Topographic
Maps and Thematic Maps.
6
Maps can further be
distinguished according to
the dimensions of spatial
data that are graphically
represented.
TYIT02 Mohd Sadam
Ansari
7
Visualization Process
TYIT01 Roshith Prakash
Cartographic visualization process - translation of spatial
data into graphics.
Main Purpose of Maps : communicate geoinformation.
Visualization deals with the communication in graphics of
spatial data and the semantics of spatial data.
Visualization varies depending on where in the spatial data
handling process it takes place and its purpose.
Factors affecting the visualization process :
i. Scale of Map
ii. Topographic or thematic data
iii. Qualitative or Quantitative data
8
Visualization Process
Visual data mining - deals with the issue of abundance of
geospatial data.
Democratization of cartography - “using electronic technology. no
longer does the map user depend on what the cartographer decides to put on a
map. Today the user is the cartographer. Users are able to produce analyses
and visualizations at will.”
Factors in Modern Visualization: Interaction & Dynamics.
Scientific visualization offers the possibility of
instantaneously changing appearance of map.
Geovisualization - Covers both presentation and
exploration of map.
TYIT01 Roshith Prakash
“
9
How do I say what to whom, and is it
effective?
10
To derive the proper symbology for a map one has to execute a
cartographic data analysis.
The core of this analysis process is to access the characteristics of the
data to find out how they can be visualized.
.
Types of data
TYIT03 NIKHIL
BHOSALE
11
Data will be of a qualitative or quantitative nature.
Qualitative data is also called nominal or
categorical data.
Examples are the different languages (e.g.
English, Swahili, Dutch), the different soil types
(e.g. sand, clay, peat).
Quantitative data can be measured, either along
an interval or ratio scale.
Cartographic data analysis TYIT03 NIKHIL
BHOSALE
12
Basic element of a map,
irrespective of the medium
on which it is displayed,
are points symbols, area
symbols and text.
Bertin distinguished six
categories, which he called
visual variables which can
be applied to point, line
and area symbols. As
shown in figure.
TYIT04 Pratik Bhosale
HOW CAN I MAP
DATA?
13
There is an obvious relationship
between the nature of the data to be
mapped and the ‘perception
properties’ of visual variables.
Dimension of the plane is added to
the list of visual variables; it is the
basis used for the proper location of
symbols on the plane.
TYIT04 Pratik Bhosale
PERCEPTION PROPERTIES
14
How to map qualitative data
If, after a long fieldwork period, one has finally delineated the
boundaries of a province's watersheds, one likely is interested in a
map showing these areas. The geographic units in the map will have
to represent the individual watersheds. In such a map, each of the
watersheds should get equal attention, and none should stand out
above the others.
The application of colour would be the best solution since is has
characteristics that allow one to quickly differentiate between different
geographic units.
The map can also be made by filling the watershed areas by different
forms (like small circles, squares, triangles, etc.) in one colour (e.g.
black for a monochrome map) as an application of the visual variable
shape.
TYIT05 Gaurav Das
15
Figure 7.13 shows two examples of how not to create
such a map. In (a), several tints of black are used-as
application of the visual variable 'value'. Looking at the
map may cause perceptual confusion since the map
image suggests differences in importance that are not
there in reality. In Figure 7.13(b), colours are used
instead. However, where most watersheds are
represented in pastel tints, one of them stands out by
its bright colour This gives the map an unbalanced
look. The viewer's eye will be distracted by the bright
colours, resulting in an unjustified weaker attention for
other areas.
How to map qualitative data TYIT05 Gaurav Das
16
What is quantitative Data ?
Quantitative data is usually numerical.
Quantitative data refers to information about quantities
that can be measured and written down in numbers
Data that expresses a specific quantity, amount, or
range.
Example : Your height, shoe size, and fingernail
length are just a few examples of quantitative data.
What is a quantitative map?
The numerical value of quantitative map data, such as
elevation in meters or temperature in
degrees Celsius, is expressed as a numerical
value.
use colors, graduated symbols, proportional symbols,
dot densities, and charts to represent quantity
on a map.
How to map quantitative data TYIT06 Anushka Desai
17
How To Map Quantitative Data
• A map with the numbers of people living in each
municipality
• The final map allow the user to determine the
amount per municipality
• To reach this objective ,the symbols are used which
have quantitative perception properties
How to map quantitative data TYIT06 Anushka Desai
18
Mapping Relative Quantitative Data
• The main aim of the map is to give an overview of the
distribution of the population density
• Value display the density from low (light tints) and high
(dark tints)
How to map quantitative data TYIT06 Anushka Desai
1. Mapping terrain elevation involves creating a visual representation of the
different heights and slopes of an area of land.
2. This can be done using various tools and techniques, such as using GPS
devices and surveying equipment to measure the elevation of different
points on the land, and then using software to create a digital map that
shows the different elevations in different colors or contour lines.
3. This map can then be used for a variety of purposes, such as planning
hiking routes, designing buildings and infrastructure, and managing
natural resources.
How to map Terrain Elevation TYIT07 Amol Gaikwad
20
Map Terrain Elevation Diagram
It is a map that shows the different
elevations of different points on the
land, usually in the form of contour
lines, where each line represents a
certain elevation
TYIT07 Amol Gaikwad
21
• Collect elevation data: This can be done using GPS devices, surveying equipment, or
remotely-sensed data such as LIDAR or SRTM.
• Import the data into a GIS software: Most GIS software can import data in different
formats such as shapefiles, rasters, and ASCII files.
• Create a digital elevation model (DEM): This is a 3D representation of the terrain
elevation data, which can be created using the GIS software.
• Create contour lines: Contour lines are used to show the shape and topography of the
land, and they can be created using the GIS software.
• Symbolize and style the map: The final step is to style the map, so it can be easily read,
this includes choosing the colors, line thickness and labeling.
• Export the map for use or sharing.
To map terrain elevation in GIS, you will need to follow these basic steps:
TYIT07 Amol Gaikwad
How to Map Time Series
TYIT08 SONAL GAUD
Advances in spatial data handling have not only made the third dimension part of GIS routines.
Nowadays, the handling of time-dependent data is also part of these routines. This has been
caused by the increasing availability of data captured at different periods in time. Next to this
data abundance, the GIS com- munity wants to analyse changes caused by real world
processes. To that end, single time slice data are no longer sufficient, and the visualization of
these processes cannot be supported with only static paper maps.
Mapping time means mapping change. This may be change in a feature’s geometry, in its
attributes or both.
It is possible to distinguish between three temporal cartographic techniques :
1. Single static map: Specific graphic variables and symbols are used to indicate
change or represent an event.
2. Series of static maps: A single map in the series represents a ‘snapshot’ in
time. Together, the maps depict a process of change
3. Animated map: Change is perceived to happen in a single image by display-
ing several snapshots after each other just like a video cut with successive
frames.
How to Map Time Series
TYIT08 SONAL GAUD
24
TYIT08 SONAL GAUD
25
Map Cosmetics is nothing but the necessary visual details that should be kept
in mind while creating it to be more easily understandable and readable.
Map Cosmetics may have include necessary map details such as
Legends
Scale indicator
North arrow
Space constraints etc
MAP COSMETICS
TYIT09 Chaitanya Gorule
Title : Information about the Context of Map
Scale : Gives us idea about the proportions
of area and scale.
Legend : Helps us understand maps better
with use of colour,symbols etc.
Compass : Tells us the orientation of map
with respect to directions.
Latitude and Longitude : Helpful for
understanding the locations with accurate
positioning.
Fundamental requirements TYIT09 Chaitanya Gorule
Hierarchy: Here the difference in colour
represents the hierarchy of importance of
structure
Eg. The main focus of map is ITC building and
because of hierarchy we can easily tell which of
the buildings from map is ITC building.
Contrast : while choosing colours for out map
contrast is one of important factors to be kept in
mind. Contrast helps differentiate between
different types of structures and also improves
visibility .
Contrast and visual Hierarchy TYIT09 Chaitanya Gorule
 Dissemination describes the circulation or spread of map design techniques.
 the process of distributing maps to a wide audience
 distribution via physical means, printed maps, as well as digital means
 map dissemination ensure that users have access to accurate and up-to-
date maps for their intended use.
TYIT10 Shruti Jadhav
Map Dissemination
29
The World Wide Web is nowadays a medium
commonly used to present and disseminate
spatial data..
There are types of web maps.
 Static Maps
Web are view-only.
do not allow for user interaction
 Dynamic Maps
offering zooming, panning or hyperlinking to
other information
be generated by web mapping services such as
Open Layers, Leaflet, Google Maps, etc.
Map Dissemination TYIT10 Shruti Jadhav
30
Web-based map dissemination has greatly increased the accessibility and use of
spatial data
 Web Mapping Services (WMS)
 Web Feature Services (WFS):
 Web Map Services (WMS):
 GIS Web Services
 Web-based GIS Applications:
Ways used for presenting disseminating spatial data. TYIT10 Shruti Jadhav
THE END
31

More Related Content

What's hot

Geographic Information System unit 1
Geographic Information System   unit 1Geographic Information System   unit 1
Geographic Information System unit 1sridevi5983
 
Fundamentals of GIS and Database Management for Disaster Management
Fundamentals of GIS and Database Management for Disaster ManagementFundamentals of GIS and Database Management for Disaster Management
Fundamentals of GIS and Database Management for Disaster ManagementSyadur Rahaman
 
Geographic information system
Geographic information systemGeographic information system
Geographic information systemOssamaElShanawany
 
Spatial Analysis Using GIS
Spatial Analysis Using GISSpatial Analysis Using GIS
Spatial Analysis Using GISPrachi Mehta
 
TYBSC IT PGIS Unit IV Spacial Data Analysis
TYBSC IT PGIS Unit IV  Spacial Data AnalysisTYBSC IT PGIS Unit IV  Spacial Data Analysis
TYBSC IT PGIS Unit IV Spacial Data AnalysisArti Parab Academics
 
Beginners: What is Industrial IoT (IIoT)
Beginners: What is Industrial IoT (IIoT)Beginners: What is Industrial IoT (IIoT)
Beginners: What is Industrial IoT (IIoT)3G4G
 
Data & Analytics Club - Data Visualization Workshop
Data & Analytics Club - Data Visualization WorkshopData & Analytics Club - Data Visualization Workshop
Data & Analytics Club - Data Visualization Workshopnsrivast
 
Geographic information system
Geographic information system Geographic information system
Geographic information system Bhavik A Shah
 
Getting started with GIS
Getting started with GISGetting started with GIS
Getting started with GISEsri India
 
Power of data visualization
Power of data visualizationPower of data visualization
Power of data visualizationSayantiniBiswas
 
Geographical information system
Geographical information systemGeographical information system
Geographical information systemBipin Karki
 
Principles of GIS unit 2
Principles of GIS unit 2Principles of GIS unit 2
Principles of GIS unit 2SanjanaKhemka1
 

What's hot (20)

Geographic Information System unit 1
Geographic Information System   unit 1Geographic Information System   unit 1
Geographic Information System unit 1
 
gis
gisgis
gis
 
Fundamentals of GIS and Database Management for Disaster Management
Fundamentals of GIS and Database Management for Disaster ManagementFundamentals of GIS and Database Management for Disaster Management
Fundamentals of GIS and Database Management for Disaster Management
 
TYBSC IT SEM 6 GIS
TYBSC IT SEM 6 GISTYBSC IT SEM 6 GIS
TYBSC IT SEM 6 GIS
 
Geographic information system
Geographic information systemGeographic information system
Geographic information system
 
Gis unit 3
Gis   unit 3Gis   unit 3
Gis unit 3
 
E-government architecture
E-government architectureE-government architecture
E-government architecture
 
Data integration
Data integrationData integration
Data integration
 
Spatial Analysis Using GIS
Spatial Analysis Using GISSpatial Analysis Using GIS
Spatial Analysis Using GIS
 
Digital mapping
Digital mappingDigital mapping
Digital mapping
 
TYBSC IT PGIS Unit IV Spacial Data Analysis
TYBSC IT PGIS Unit IV  Spacial Data AnalysisTYBSC IT PGIS Unit IV  Spacial Data Analysis
TYBSC IT PGIS Unit IV Spacial Data Analysis
 
GIS
GISGIS
GIS
 
Data Visualization - A Brief Overview
Data Visualization - A Brief OverviewData Visualization - A Brief Overview
Data Visualization - A Brief Overview
 
Beginners: What is Industrial IoT (IIoT)
Beginners: What is Industrial IoT (IIoT)Beginners: What is Industrial IoT (IIoT)
Beginners: What is Industrial IoT (IIoT)
 
Data & Analytics Club - Data Visualization Workshop
Data & Analytics Club - Data Visualization WorkshopData & Analytics Club - Data Visualization Workshop
Data & Analytics Club - Data Visualization Workshop
 
Geographic information system
Geographic information system Geographic information system
Geographic information system
 
Getting started with GIS
Getting started with GISGetting started with GIS
Getting started with GIS
 
Power of data visualization
Power of data visualizationPower of data visualization
Power of data visualization
 
Geographical information system
Geographical information systemGeographical information system
Geographical information system
 
Principles of GIS unit 2
Principles of GIS unit 2Principles of GIS unit 2
Principles of GIS unit 2
 

Similar to GRP 1 GIS Presentation.pptx

Introduction to gis and arc gis
Introduction to gis and arc gis Introduction to gis and arc gis
Introduction to gis and arc gis Saad Raja
 
ILWIS 3.0 SUMMARY PRESENTATION
ILWIS 3.0 SUMMARY PRESENTATIONILWIS 3.0 SUMMARY PRESENTATION
ILWIS 3.0 SUMMARY PRESENTATIONmusadoto
 
Geographic information system (gis)
Geographic information system (gis)Geographic information system (gis)
Geographic information system (gis)Vandana Verma
 
Lecture 1_ Intro n Basics_GIS.pptx
Lecture 1_ Intro n Basics_GIS.pptxLecture 1_ Intro n Basics_GIS.pptx
Lecture 1_ Intro n Basics_GIS.pptxnobelhasssan
 
Introduction to GIS-basic principles and description
Introduction to GIS-basic principles and descriptionIntroduction to GIS-basic principles and description
Introduction to GIS-basic principles and descriptionmahmoudelassar
 
QGIS Training.pptx
QGIS Training.pptxQGIS Training.pptx
QGIS Training.pptxSeemaAjay7
 
SEMINAR Presentation ppt.pptx
SEMINAR Presentation ppt.pptxSEMINAR Presentation ppt.pptx
SEMINAR Presentation ppt.pptxWageYado
 
SEMINAR Presentation ppt.pptx
SEMINAR Presentation ppt.pptxSEMINAR Presentation ppt.pptx
SEMINAR Presentation ppt.pptxWageYado
 
GEOGRAPHIC INFORMATION SYSTEM.pptx
GEOGRAPHIC INFORMATION SYSTEM.pptxGEOGRAPHIC INFORMATION SYSTEM.pptx
GEOGRAPHIC INFORMATION SYSTEM.pptxFizaNaaz8
 
Introduction and Application of GIS
Introduction and Application of GISIntroduction and Application of GIS
Introduction and Application of GISSatish Taji
 
Remote Sensing & GIS.ppt
Remote Sensing & GIS.pptRemote Sensing & GIS.ppt
Remote Sensing & GIS.pptyhmamdam1
 
Continuing Our Look At Primary And Secondary Data
Continuing Our Look At Primary And Secondary DataContinuing Our Look At Primary And Secondary Data
Continuing Our Look At Primary And Secondary Dataguest2137aa
 

Similar to GRP 1 GIS Presentation.pptx (20)

GIS - lecture-1.ppt
GIS - lecture-1.pptGIS - lecture-1.ppt
GIS - lecture-1.ppt
 
Introduction to gis and arc gis
Introduction to gis and arc gis Introduction to gis and arc gis
Introduction to gis and arc gis
 
ILWIS 3.0 SUMMARY PRESENTATION
ILWIS 3.0 SUMMARY PRESENTATIONILWIS 3.0 SUMMARY PRESENTATION
ILWIS 3.0 SUMMARY PRESENTATION
 
Geographic information system (gis)
Geographic information system (gis)Geographic information system (gis)
Geographic information system (gis)
 
Lecture 1_ Intro n Basics_GIS.pptx
Lecture 1_ Intro n Basics_GIS.pptxLecture 1_ Intro n Basics_GIS.pptx
Lecture 1_ Intro n Basics_GIS.pptx
 
Geographic information system
Geographic information systemGeographic information system
Geographic information system
 
Introduction to GIS-basic principles and description
Introduction to GIS-basic principles and descriptionIntroduction to GIS-basic principles and description
Introduction to GIS-basic principles and description
 
introduction to GIS
introduction to GIS introduction to GIS
introduction to GIS
 
Overview of gis new
Overview of gis newOverview of gis new
Overview of gis new
 
Rs unit iii-gis--- [repaired]
Rs unit iii-gis--- [repaired]Rs unit iii-gis--- [repaired]
Rs unit iii-gis--- [repaired]
 
Rs unit iii-gis--- [repaired]
Rs unit iii-gis--- [repaired]Rs unit iii-gis--- [repaired]
Rs unit iii-gis--- [repaired]
 
Unit III.pptx
Unit III.pptxUnit III.pptx
Unit III.pptx
 
QGIS Training.pptx
QGIS Training.pptxQGIS Training.pptx
QGIS Training.pptx
 
SEMINAR Presentation ppt.pptx
SEMINAR Presentation ppt.pptxSEMINAR Presentation ppt.pptx
SEMINAR Presentation ppt.pptx
 
SEMINAR Presentation ppt.pptx
SEMINAR Presentation ppt.pptxSEMINAR Presentation ppt.pptx
SEMINAR Presentation ppt.pptx
 
GEOGRAPHIC INFORMATION SYSTEM.pptx
GEOGRAPHIC INFORMATION SYSTEM.pptxGEOGRAPHIC INFORMATION SYSTEM.pptx
GEOGRAPHIC INFORMATION SYSTEM.pptx
 
Introduction and Application of GIS
Introduction and Application of GISIntroduction and Application of GIS
Introduction and Application of GIS
 
Remote Sensing & GIS.ppt
Remote Sensing & GIS.pptRemote Sensing & GIS.ppt
Remote Sensing & GIS.ppt
 
Introduction to Maps
Introduction to MapsIntroduction to Maps
Introduction to Maps
 
Continuing Our Look At Primary And Secondary Data
Continuing Our Look At Primary And Secondary DataContinuing Our Look At Primary And Secondary Data
Continuing Our Look At Primary And Secondary Data
 

Recently uploaded

Introduction to ArtificiaI Intelligence in Higher Education
Introduction to ArtificiaI Intelligence in Higher EducationIntroduction to ArtificiaI Intelligence in Higher Education
Introduction to ArtificiaI Intelligence in Higher Educationpboyjonauth
 
Sanyam Choudhary Chemistry practical.pdf
Sanyam Choudhary Chemistry practical.pdfSanyam Choudhary Chemistry practical.pdf
Sanyam Choudhary Chemistry practical.pdfsanyamsingh5019
 
Alper Gobel In Media Res Media Component
Alper Gobel In Media Res Media ComponentAlper Gobel In Media Res Media Component
Alper Gobel In Media Res Media ComponentInMediaRes1
 
Solving Puzzles Benefits Everyone (English).pptx
Solving Puzzles Benefits Everyone (English).pptxSolving Puzzles Benefits Everyone (English).pptx
Solving Puzzles Benefits Everyone (English).pptxOH TEIK BIN
 
Blooming Together_ Growing a Community Garden Worksheet.docx
Blooming Together_ Growing a Community Garden Worksheet.docxBlooming Together_ Growing a Community Garden Worksheet.docx
Blooming Together_ Growing a Community Garden Worksheet.docxUnboundStockton
 
Computed Fields and api Depends in the Odoo 17
Computed Fields and api Depends in the Odoo 17Computed Fields and api Depends in the Odoo 17
Computed Fields and api Depends in the Odoo 17Celine George
 
Employee wellbeing at the workplace.pptx
Employee wellbeing at the workplace.pptxEmployee wellbeing at the workplace.pptx
Employee wellbeing at the workplace.pptxNirmalaLoungPoorunde1
 
Biting mechanism of poisonous snakes.pdf
Biting mechanism of poisonous snakes.pdfBiting mechanism of poisonous snakes.pdf
Biting mechanism of poisonous snakes.pdfadityarao40181
 
Presiding Officer Training module 2024 lok sabha elections
Presiding Officer Training module 2024 lok sabha electionsPresiding Officer Training module 2024 lok sabha elections
Presiding Officer Training module 2024 lok sabha electionsanshu789521
 
18-04-UA_REPORT_MEDIALITERAСY_INDEX-DM_23-1-final-eng.pdf
18-04-UA_REPORT_MEDIALITERAСY_INDEX-DM_23-1-final-eng.pdf18-04-UA_REPORT_MEDIALITERAСY_INDEX-DM_23-1-final-eng.pdf
18-04-UA_REPORT_MEDIALITERAСY_INDEX-DM_23-1-final-eng.pdfssuser54595a
 
“Oh GOSH! Reflecting on Hackteria's Collaborative Practices in a Global Do-It...
“Oh GOSH! Reflecting on Hackteria's Collaborative Practices in a Global Do-It...“Oh GOSH! Reflecting on Hackteria's Collaborative Practices in a Global Do-It...
“Oh GOSH! Reflecting on Hackteria's Collaborative Practices in a Global Do-It...Marc Dusseiller Dusjagr
 
भारत-रोम व्यापार.pptx, Indo-Roman Trade,
भारत-रोम व्यापार.pptx, Indo-Roman Trade,भारत-रोम व्यापार.pptx, Indo-Roman Trade,
भारत-रोम व्यापार.pptx, Indo-Roman Trade,Virag Sontakke
 
Software Engineering Methodologies (overview)
Software Engineering Methodologies (overview)Software Engineering Methodologies (overview)
Software Engineering Methodologies (overview)eniolaolutunde
 
call girls in Kamla Market (DELHI) 🔝 >༒9953330565🔝 genuine Escort Service 🔝✔️✔️
call girls in Kamla Market (DELHI) 🔝 >༒9953330565🔝 genuine Escort Service 🔝✔️✔️call girls in Kamla Market (DELHI) 🔝 >༒9953330565🔝 genuine Escort Service 🔝✔️✔️
call girls in Kamla Market (DELHI) 🔝 >༒9953330565🔝 genuine Escort Service 🔝✔️✔️9953056974 Low Rate Call Girls In Saket, Delhi NCR
 
_Math 4-Q4 Week 5.pptx Steps in Collecting Data
_Math 4-Q4 Week 5.pptx Steps in Collecting Data_Math 4-Q4 Week 5.pptx Steps in Collecting Data
_Math 4-Q4 Week 5.pptx Steps in Collecting DataJhengPantaleon
 
Science 7 - LAND and SEA BREEZE and its Characteristics
Science 7 - LAND and SEA BREEZE and its CharacteristicsScience 7 - LAND and SEA BREEZE and its Characteristics
Science 7 - LAND and SEA BREEZE and its CharacteristicsKarinaGenton
 
How to Make a Pirate ship Primary Education.pptx
How to Make a Pirate ship Primary Education.pptxHow to Make a Pirate ship Primary Education.pptx
How to Make a Pirate ship Primary Education.pptxmanuelaromero2013
 
Final demo Grade 9 for demo Plan dessert.pptx
Final demo Grade 9 for demo Plan dessert.pptxFinal demo Grade 9 for demo Plan dessert.pptx
Final demo Grade 9 for demo Plan dessert.pptxAvyJaneVismanos
 

Recently uploaded (20)

Model Call Girl in Bikash Puri Delhi reach out to us at 🔝9953056974🔝
Model Call Girl in Bikash Puri  Delhi reach out to us at 🔝9953056974🔝Model Call Girl in Bikash Puri  Delhi reach out to us at 🔝9953056974🔝
Model Call Girl in Bikash Puri Delhi reach out to us at 🔝9953056974🔝
 
Introduction to ArtificiaI Intelligence in Higher Education
Introduction to ArtificiaI Intelligence in Higher EducationIntroduction to ArtificiaI Intelligence in Higher Education
Introduction to ArtificiaI Intelligence in Higher Education
 
Sanyam Choudhary Chemistry practical.pdf
Sanyam Choudhary Chemistry practical.pdfSanyam Choudhary Chemistry practical.pdf
Sanyam Choudhary Chemistry practical.pdf
 
Alper Gobel In Media Res Media Component
Alper Gobel In Media Res Media ComponentAlper Gobel In Media Res Media Component
Alper Gobel In Media Res Media Component
 
Solving Puzzles Benefits Everyone (English).pptx
Solving Puzzles Benefits Everyone (English).pptxSolving Puzzles Benefits Everyone (English).pptx
Solving Puzzles Benefits Everyone (English).pptx
 
Blooming Together_ Growing a Community Garden Worksheet.docx
Blooming Together_ Growing a Community Garden Worksheet.docxBlooming Together_ Growing a Community Garden Worksheet.docx
Blooming Together_ Growing a Community Garden Worksheet.docx
 
9953330565 Low Rate Call Girls In Rohini Delhi NCR
9953330565 Low Rate Call Girls In Rohini  Delhi NCR9953330565 Low Rate Call Girls In Rohini  Delhi NCR
9953330565 Low Rate Call Girls In Rohini Delhi NCR
 
Computed Fields and api Depends in the Odoo 17
Computed Fields and api Depends in the Odoo 17Computed Fields and api Depends in the Odoo 17
Computed Fields and api Depends in the Odoo 17
 
Employee wellbeing at the workplace.pptx
Employee wellbeing at the workplace.pptxEmployee wellbeing at the workplace.pptx
Employee wellbeing at the workplace.pptx
 
Biting mechanism of poisonous snakes.pdf
Biting mechanism of poisonous snakes.pdfBiting mechanism of poisonous snakes.pdf
Biting mechanism of poisonous snakes.pdf
 
Presiding Officer Training module 2024 lok sabha elections
Presiding Officer Training module 2024 lok sabha electionsPresiding Officer Training module 2024 lok sabha elections
Presiding Officer Training module 2024 lok sabha elections
 
18-04-UA_REPORT_MEDIALITERAСY_INDEX-DM_23-1-final-eng.pdf
18-04-UA_REPORT_MEDIALITERAСY_INDEX-DM_23-1-final-eng.pdf18-04-UA_REPORT_MEDIALITERAСY_INDEX-DM_23-1-final-eng.pdf
18-04-UA_REPORT_MEDIALITERAСY_INDEX-DM_23-1-final-eng.pdf
 
“Oh GOSH! Reflecting on Hackteria's Collaborative Practices in a Global Do-It...
“Oh GOSH! Reflecting on Hackteria's Collaborative Practices in a Global Do-It...“Oh GOSH! Reflecting on Hackteria's Collaborative Practices in a Global Do-It...
“Oh GOSH! Reflecting on Hackteria's Collaborative Practices in a Global Do-It...
 
भारत-रोम व्यापार.pptx, Indo-Roman Trade,
भारत-रोम व्यापार.pptx, Indo-Roman Trade,भारत-रोम व्यापार.pptx, Indo-Roman Trade,
भारत-रोम व्यापार.pptx, Indo-Roman Trade,
 
Software Engineering Methodologies (overview)
Software Engineering Methodologies (overview)Software Engineering Methodologies (overview)
Software Engineering Methodologies (overview)
 
call girls in Kamla Market (DELHI) 🔝 >༒9953330565🔝 genuine Escort Service 🔝✔️✔️
call girls in Kamla Market (DELHI) 🔝 >༒9953330565🔝 genuine Escort Service 🔝✔️✔️call girls in Kamla Market (DELHI) 🔝 >༒9953330565🔝 genuine Escort Service 🔝✔️✔️
call girls in Kamla Market (DELHI) 🔝 >༒9953330565🔝 genuine Escort Service 🔝✔️✔️
 
_Math 4-Q4 Week 5.pptx Steps in Collecting Data
_Math 4-Q4 Week 5.pptx Steps in Collecting Data_Math 4-Q4 Week 5.pptx Steps in Collecting Data
_Math 4-Q4 Week 5.pptx Steps in Collecting Data
 
Science 7 - LAND and SEA BREEZE and its Characteristics
Science 7 - LAND and SEA BREEZE and its CharacteristicsScience 7 - LAND and SEA BREEZE and its Characteristics
Science 7 - LAND and SEA BREEZE and its Characteristics
 
How to Make a Pirate ship Primary Education.pptx
How to Make a Pirate ship Primary Education.pptxHow to Make a Pirate ship Primary Education.pptx
How to Make a Pirate ship Primary Education.pptx
 
Final demo Grade 9 for demo Plan dessert.pptx
Final demo Grade 9 for demo Plan dessert.pptxFinal demo Grade 9 for demo Plan dessert.pptx
Final demo Grade 9 for demo Plan dessert.pptx
 

GRP 1 GIS Presentation.pptx

  • 1. GIS Unit V Grp 1 TYIT01 - TYIT10
  • 2. 2 Topic Division Roll Number Name Topics TYIT01 Roshith Prakash Visualization process TYIT02 Mohd Sadam Ansari Gis and Maps TYIT03 Nikhil Bhosale Types of data TYIT04 Pratik Bhosale How to map data TYIT05 Gaurav Das How to map qualitative data TYIT06 Anushka Desai How to map quatitative data TYIT07 Amol Gaikwad How to map terrain elevation TYIT08 Sonal Gaud How to map time series TYIT09 Chaitanya Gorule Map cosmetics TYIT10 Shruti Jadhav Map dissemination
  • 4. GIS and MAPS 4 • A Map is “a representation or abstraction of geographic reality. A tool for presenting geographic information in a way that is visual, digital or tactile.” • Maps and GIS are closely related to each other. Maps can be used as input for a GIS. They play a key role in relation to all the functional components of a GIS. • Maps can deal with questions/answers related to the basic components of spatial or geographic data: location(geometry), characteristics(thematic attributes) and time, and their combination. TYIT02 Mohd Sadam Ansari
  • 5. TYIT02 Mohd Sadam Ansari Comparison of Aerial Photograph and a Map. Traditionally Maps are divided into Topographic Maps and Thematic Maps.
  • 6. 6 Maps can further be distinguished according to the dimensions of spatial data that are graphically represented. TYIT02 Mohd Sadam Ansari
  • 7. 7 Visualization Process TYIT01 Roshith Prakash Cartographic visualization process - translation of spatial data into graphics. Main Purpose of Maps : communicate geoinformation. Visualization deals with the communication in graphics of spatial data and the semantics of spatial data. Visualization varies depending on where in the spatial data handling process it takes place and its purpose. Factors affecting the visualization process : i. Scale of Map ii. Topographic or thematic data iii. Qualitative or Quantitative data
  • 8. 8 Visualization Process Visual data mining - deals with the issue of abundance of geospatial data. Democratization of cartography - “using electronic technology. no longer does the map user depend on what the cartographer decides to put on a map. Today the user is the cartographer. Users are able to produce analyses and visualizations at will.” Factors in Modern Visualization: Interaction & Dynamics. Scientific visualization offers the possibility of instantaneously changing appearance of map. Geovisualization - Covers both presentation and exploration of map. TYIT01 Roshith Prakash
  • 9. “ 9 How do I say what to whom, and is it effective?
  • 10. 10 To derive the proper symbology for a map one has to execute a cartographic data analysis. The core of this analysis process is to access the characteristics of the data to find out how they can be visualized. . Types of data TYIT03 NIKHIL BHOSALE
  • 11. 11 Data will be of a qualitative or quantitative nature. Qualitative data is also called nominal or categorical data. Examples are the different languages (e.g. English, Swahili, Dutch), the different soil types (e.g. sand, clay, peat). Quantitative data can be measured, either along an interval or ratio scale. Cartographic data analysis TYIT03 NIKHIL BHOSALE
  • 12. 12 Basic element of a map, irrespective of the medium on which it is displayed, are points symbols, area symbols and text. Bertin distinguished six categories, which he called visual variables which can be applied to point, line and area symbols. As shown in figure. TYIT04 Pratik Bhosale HOW CAN I MAP DATA?
  • 13. 13 There is an obvious relationship between the nature of the data to be mapped and the ‘perception properties’ of visual variables. Dimension of the plane is added to the list of visual variables; it is the basis used for the proper location of symbols on the plane. TYIT04 Pratik Bhosale PERCEPTION PROPERTIES
  • 14. 14 How to map qualitative data If, after a long fieldwork period, one has finally delineated the boundaries of a province's watersheds, one likely is interested in a map showing these areas. The geographic units in the map will have to represent the individual watersheds. In such a map, each of the watersheds should get equal attention, and none should stand out above the others. The application of colour would be the best solution since is has characteristics that allow one to quickly differentiate between different geographic units. The map can also be made by filling the watershed areas by different forms (like small circles, squares, triangles, etc.) in one colour (e.g. black for a monochrome map) as an application of the visual variable shape. TYIT05 Gaurav Das
  • 15. 15 Figure 7.13 shows two examples of how not to create such a map. In (a), several tints of black are used-as application of the visual variable 'value'. Looking at the map may cause perceptual confusion since the map image suggests differences in importance that are not there in reality. In Figure 7.13(b), colours are used instead. However, where most watersheds are represented in pastel tints, one of them stands out by its bright colour This gives the map an unbalanced look. The viewer's eye will be distracted by the bright colours, resulting in an unjustified weaker attention for other areas. How to map qualitative data TYIT05 Gaurav Das
  • 16. 16 What is quantitative Data ? Quantitative data is usually numerical. Quantitative data refers to information about quantities that can be measured and written down in numbers Data that expresses a specific quantity, amount, or range. Example : Your height, shoe size, and fingernail length are just a few examples of quantitative data. What is a quantitative map? The numerical value of quantitative map data, such as elevation in meters or temperature in degrees Celsius, is expressed as a numerical value. use colors, graduated symbols, proportional symbols, dot densities, and charts to represent quantity on a map. How to map quantitative data TYIT06 Anushka Desai
  • 17. 17 How To Map Quantitative Data • A map with the numbers of people living in each municipality • The final map allow the user to determine the amount per municipality • To reach this objective ,the symbols are used which have quantitative perception properties How to map quantitative data TYIT06 Anushka Desai
  • 18. 18 Mapping Relative Quantitative Data • The main aim of the map is to give an overview of the distribution of the population density • Value display the density from low (light tints) and high (dark tints) How to map quantitative data TYIT06 Anushka Desai
  • 19. 1. Mapping terrain elevation involves creating a visual representation of the different heights and slopes of an area of land. 2. This can be done using various tools and techniques, such as using GPS devices and surveying equipment to measure the elevation of different points on the land, and then using software to create a digital map that shows the different elevations in different colors or contour lines. 3. This map can then be used for a variety of purposes, such as planning hiking routes, designing buildings and infrastructure, and managing natural resources. How to map Terrain Elevation TYIT07 Amol Gaikwad
  • 20. 20 Map Terrain Elevation Diagram It is a map that shows the different elevations of different points on the land, usually in the form of contour lines, where each line represents a certain elevation TYIT07 Amol Gaikwad
  • 21. 21 • Collect elevation data: This can be done using GPS devices, surveying equipment, or remotely-sensed data such as LIDAR or SRTM. • Import the data into a GIS software: Most GIS software can import data in different formats such as shapefiles, rasters, and ASCII files. • Create a digital elevation model (DEM): This is a 3D representation of the terrain elevation data, which can be created using the GIS software. • Create contour lines: Contour lines are used to show the shape and topography of the land, and they can be created using the GIS software. • Symbolize and style the map: The final step is to style the map, so it can be easily read, this includes choosing the colors, line thickness and labeling. • Export the map for use or sharing. To map terrain elevation in GIS, you will need to follow these basic steps: TYIT07 Amol Gaikwad
  • 22. How to Map Time Series TYIT08 SONAL GAUD Advances in spatial data handling have not only made the third dimension part of GIS routines. Nowadays, the handling of time-dependent data is also part of these routines. This has been caused by the increasing availability of data captured at different periods in time. Next to this data abundance, the GIS com- munity wants to analyse changes caused by real world processes. To that end, single time slice data are no longer sufficient, and the visualization of these processes cannot be supported with only static paper maps. Mapping time means mapping change. This may be change in a feature’s geometry, in its attributes or both.
  • 23. It is possible to distinguish between three temporal cartographic techniques : 1. Single static map: Specific graphic variables and symbols are used to indicate change or represent an event. 2. Series of static maps: A single map in the series represents a ‘snapshot’ in time. Together, the maps depict a process of change 3. Animated map: Change is perceived to happen in a single image by display- ing several snapshots after each other just like a video cut with successive frames. How to Map Time Series TYIT08 SONAL GAUD
  • 25. 25 Map Cosmetics is nothing but the necessary visual details that should be kept in mind while creating it to be more easily understandable and readable. Map Cosmetics may have include necessary map details such as Legends Scale indicator North arrow Space constraints etc MAP COSMETICS TYIT09 Chaitanya Gorule
  • 26. Title : Information about the Context of Map Scale : Gives us idea about the proportions of area and scale. Legend : Helps us understand maps better with use of colour,symbols etc. Compass : Tells us the orientation of map with respect to directions. Latitude and Longitude : Helpful for understanding the locations with accurate positioning. Fundamental requirements TYIT09 Chaitanya Gorule
  • 27. Hierarchy: Here the difference in colour represents the hierarchy of importance of structure Eg. The main focus of map is ITC building and because of hierarchy we can easily tell which of the buildings from map is ITC building. Contrast : while choosing colours for out map contrast is one of important factors to be kept in mind. Contrast helps differentiate between different types of structures and also improves visibility . Contrast and visual Hierarchy TYIT09 Chaitanya Gorule
  • 28.  Dissemination describes the circulation or spread of map design techniques.  the process of distributing maps to a wide audience  distribution via physical means, printed maps, as well as digital means  map dissemination ensure that users have access to accurate and up-to- date maps for their intended use. TYIT10 Shruti Jadhav Map Dissemination
  • 29. 29 The World Wide Web is nowadays a medium commonly used to present and disseminate spatial data.. There are types of web maps.  Static Maps Web are view-only. do not allow for user interaction  Dynamic Maps offering zooming, panning or hyperlinking to other information be generated by web mapping services such as Open Layers, Leaflet, Google Maps, etc. Map Dissemination TYIT10 Shruti Jadhav
  • 30. 30 Web-based map dissemination has greatly increased the accessibility and use of spatial data  Web Mapping Services (WMS)  Web Feature Services (WFS):  Web Map Services (WMS):  GIS Web Services  Web-based GIS Applications: Ways used for presenting disseminating spatial data. TYIT10 Shruti Jadhav