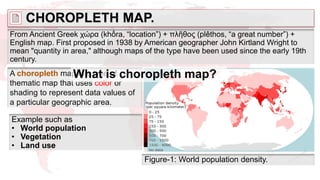
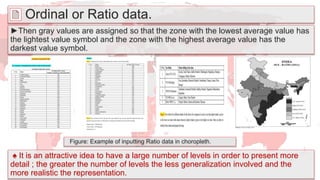
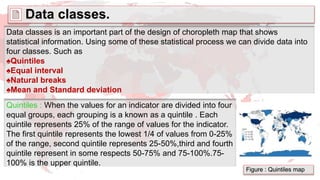
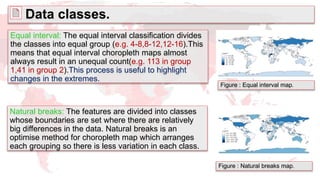
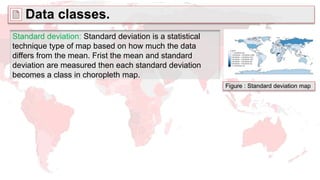
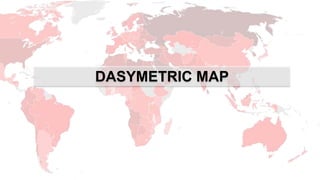
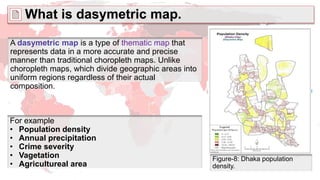
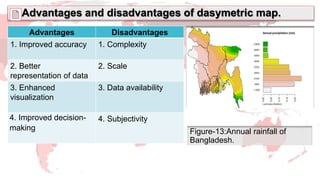
1. Choropleth maps represent data using color or shading within geographic areas, while dasymetric maps represent data more accurately by differentiating between areas that can and cannot contain the phenomena.
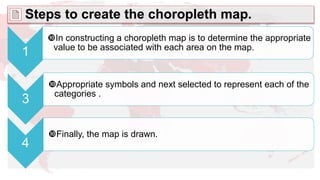
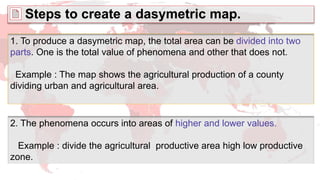
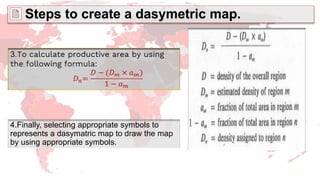
2. Creating choropleth maps involves determining values for each area and selecting symbols to represent categories, while dasymetric maps divide areas into higher and lower value zones.
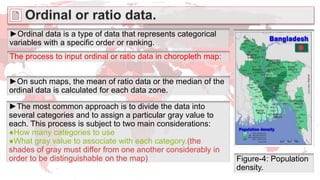
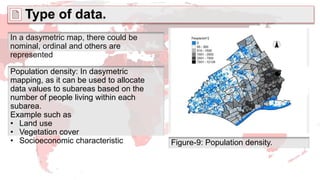
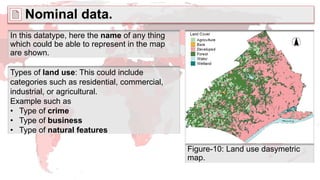
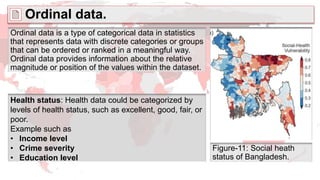
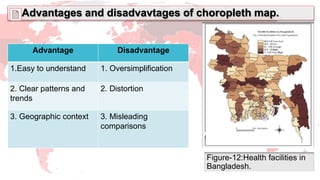
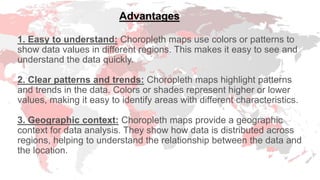
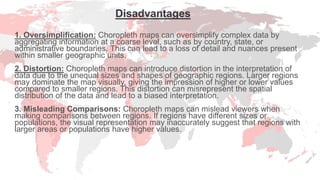
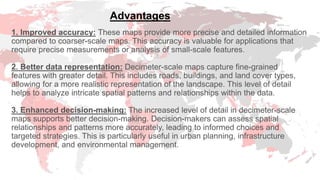
3. Both map types can represent nominal, ordinal, and ratio data but choropleth maps are prone to oversimplification and distortion while dasymetric maps improve accuracy and visualization at finer scales though requiring more complex processing.