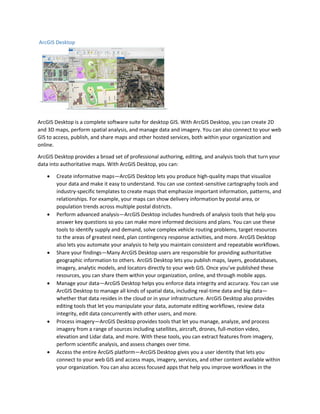
ArcGIS Desktop is a complete desktop GIS software suite that allows users to create 2D and 3D maps, perform spatial analysis, and manage and share data. It provides tools for authoring, editing, and analyzing geospatial data to produce authoritative maps. Users can perform advanced spatial analysis, share findings by publishing maps and data to web GIS, manage various types of spatial data, process imagery, and access the full ArcGIS platform. Optional extensions add further professional capabilities for tasks like 3D modeling, network analysis, and data interoperability.
Want to take advantage of GIS data without having a GIS department? Looking to reap the benefits of GIS data in your projects? This session will show you how to unleash the power of accessing and utilizing GIS data in the AutoCAD environment. We will delve into practical examples and explanations along with reviewing where and when to use each tool.
Software, Application, or a System that is used to analyze, manipulate, and visualize geospatial data and databases is a GIS Software. These are robust packages that are used to handle a large number of data sets. The data sets and files are limited to spreadsheets and multimedia files like video drive files and imagery from various sources. Companies that are into GIS software are ESRI, HERE Maps, Google, Bing Maps and Autodesk, etc. Along with the big guns, there are also small open-source, free wares that are doing well in the industry. I will try to cover the most widely and known software in the latter part
As Europe's leading economic powerhouse and the fourth-largest hashtag#economy globally, Germany stands at the forefront of innovation and industrial might. Renowned for its precision engineering and high-tech sectors, Germany's economic structure is heavily supported by a robust service industry, accounting for approximately 68% of its GDP. This economic clout and strategic geopolitical stance position Germany as a focal point in the global cyber threat landscape.
In the face of escalating global tensions, particularly those emanating from geopolitical disputes with nations like hashtag#Russia and hashtag#China, hashtag#Germany has witnessed a significant uptick in targeted cyber operations. Our analysis indicates a marked increase in hashtag#cyberattack sophistication aimed at critical infrastructure and key industrial sectors. These attacks range from ransomware campaigns to hashtag#AdvancedPersistentThreats (hashtag#APTs), threatening national security and business integrity.
🔑 Key findings include:
🔍 Increased frequency and complexity of cyber threats.
🔍 Escalation of state-sponsored and criminally motivated cyber operations.
🔍 Active dark web exchanges of malicious tools and tactics.
Our comprehensive report delves into these challenges, using a blend of open-source and proprietary data collection techniques. By monitoring activity on critical networks and analyzing attack patterns, our team provides a detailed overview of the threats facing German entities.
This report aims to equip stakeholders across public and private sectors with the knowledge to enhance their defensive strategies, reduce exposure to cyber risks, and reinforce Germany's resilience against cyber threats.
Adjusting primitives for graph : SHORT REPORT / NOTESSubhajit Sahu
Graph algorithms, like PageRank Compressed Sparse Row (CSR) is an adjacency-list based graph representation that is
Multiply with different modes (map)
1. Performance of sequential execution based vs OpenMP based vector multiply.
2. Comparing various launch configs for CUDA based vector multiply.
Sum with different storage types (reduce)
1. Performance of vector element sum using float vs bfloat16 as the storage type.
Sum with different modes (reduce)
1. Performance of sequential execution based vs OpenMP based vector element sum.
2. Performance of memcpy vs in-place based CUDA based vector element sum.
3. Comparing various launch configs for CUDA based vector element sum (memcpy).
4. Comparing various launch configs for CUDA based vector element sum (in-place).
Sum with in-place strategies of CUDA mode (reduce)
1. Comparing various launch configs for CUDA based vector element sum (in-place).
Explore our comprehensive data analysis project presentation on predicting product ad campaign performance. Learn how data-driven insights can optimize your marketing strategies and enhance campaign effectiveness. Perfect for professionals and students looking to understand the power of data analysis in advertising. for more details visit: https://bostoninstituteofanalytics.org/data-science-and-artificial-intelligence/
Predicting Product Ad Campaign Performance: A Data Analysis Project Presentation
ArcGIS por
1. ArcGIS Desktop
ArcGIS Desktop is a complete software suite for desktop GIS. With ArcGIS Desktop, you can create 2D
and 3D maps, perform spatial analysis, and manage data and imagery. You can also connect to your web
GIS to access, publish, and share maps and other hosted services, both within your organization and
online.
ArcGIS Desktop provides a broad set of professional authoring, editing, and analysis tools that turn your
data into authoritative maps. With ArcGIS Desktop, you can:
• Create informative maps—ArcGIS Desktop lets you produce high-quality maps that visualize
your data and make it easy to understand. You can use context-sensitive cartography tools and
industry-specific templates to create maps that emphasize important information, patterns, and
relationships. For example, your maps can show delivery information by postal area, or
population trends across multiple postal districts.
• Perform advanced analysis—ArcGIS Desktop includes hundreds of analysis tools that help you
answer key questions so you can make more informed decisions and plans. You can use these
tools to identify supply and demand, solve complex vehicle routing problems, target resources
to the areas of greatest need, plan contingency response activities, and more. ArcGIS Desktop
also lets you automate your analysis to help you maintain consistent and repeatable workflows.
• Share your findings—Many ArcGIS Desktop users are responsible for providing authoritative
geographic information to others. ArcGIS Desktop lets you publish maps, layers, geodatabases,
imagery, analytic models, and locators directly to your web GIS. Once you’ve published these
resources, you can share them within your organization, online, and through mobile apps.
• Manage your data—ArcGIS Desktop helps you enforce data integrity and accuracy. You can use
ArcGIS Desktop to manage all kinds of spatial data, including real-time data and big data—
whether that data resides in the cloud or in your infrastructure. ArcGIS Desktop also provides
editing tools that let you manipulate your data, automate editing workflows, review data
integrity, edit data concurrently with other users, and more.
• Process imagery—ArcGIS Desktop provides tools that let you manage, analyze, and process
imagery from a range of sources including satellites, aircraft, drones, full-motion video,
elevation and Lidar data, and more. With these tools, you can extract features from imagery,
perform scientific analysis, and assess changes over time.
• Access the entire ArcGIS platform—ArcGIS Desktop gives you a user identity that lets you
connect to your web GIS and access maps, imagery, services, and other content available within
your organization. You can also access focused apps that help you improve workflows in the
2. field, in the office, and when engaging the public. In addition, you can use ArcGIS developer
tools to build your own desktop, web, and mobile apps.
Expand your capabilities—You can add even more professional GIS capabilities to ArcGIS Desktop with
optional extensions. These extensions provide advanced tools in areas like 3D modeling and analysis,
network analysis, geostatistics, spatial analysis, workflow management, and comprehensive data
interoperability.
ArcGIS Desktop is a core component of the ArcGIS platform. As the premier desktop GIS suite, ArcGIS
Desktop gives you the tools needed to integrate, visualize, and analyze all kinds of data. These tools help
you transform your data into a variety of information products—such as web maps, dashboards, and
data collection apps—that are useful to staff throughout your organization. ArcGIS Desktop also works
with your web GIS, making it easy to publish and share your authoritative GIS resources so they can be
accessed anywhere and on any device.