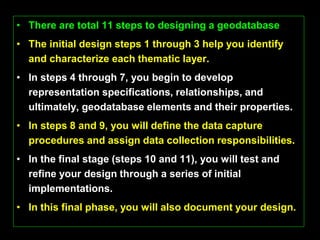
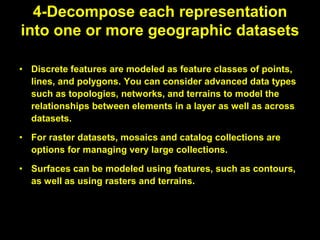
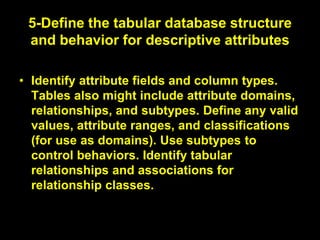
Steps of
Geodatabase
Designing
(1) First, you identify the thematic layers you'll
need for your particular application and
information requirements. What are the data
themes that make up your key landscapes?
(2) Then, you define each thematic layer in
more detail. The characterization of each
thematic layer will result in a specification
of standard geodatabase data elements
such as feature classes, tables, relationship
classes, raster datasets, subtypes,
topologies, domains, and so on.
• When identifying thematic layers in your
design, try to characterize each theme in
terms of its visual representations, its
expected uses in the GIS, its likely data
sources, and its levels of resolution. For
example, at what scales and extents will you
need to use this information, and how will its
elements be represented at each scale?
These characteristics help describe the high-
level contents expected from each theme.
• Below is an example
description of a data theme for
ownership parcels in a
cadastral application:
• Once you have identified the key thematic layers in
your design, the next step is to develop
specifications for representing the contents of each
thematic layer in the physical database.
• List the map scales and extents that you'll need to
work with.
• For each, describe how the geographic features are
to be represented (for example, as points, lines,
polygons, rasters, surfaces, or tabular attributes).
• How should the data be organized into feature
classes, tables, and relationships?
• How will spatial and database integrity rules be used
to implement GIS behavior?
• There are total 11 steps to designing a geodatabase
• The initial design steps 1 through 3 help you identify
and characterize each thematic layer.
• In steps 4 through 7, you begin to develop
representation specifications, relationships, and
ultimately, geodatabase elements and their properties.
• In steps 8 and 9, you will define the data capture
procedures and assign data collection responsibilities.
• In the final stage (steps 10 and 11), you will test and
refine your design through a series of initial
implementations.
• In this final phase, you will also document your design.
1-Identify the information products that
you will create and manage with your GIS
• Your GIS database design should reflect the work of your
organization. Consider compiling and maintaining an
inventory of map products, analytic models, Web mapping
applications, data flows, database reports, key
responsibilities, 3D views, and other mission-based
requirements for your organization. List the data sources
you currently use in this work. Use these to drive your data
design needs.
• Define the essential 2D and 3D digital basemaps for your
applications. Identify the set of map scales that will appear
in each basemap as you pan, zoom, and explore its
contents.
2-Identify the key data themes based on
your information requirements
• Define more completely some of the key aspects of each data
theme. Determine how each dataset will be used—for editing,
GIS modeling and analysis, representing your business
workflows, and mapping and 3D display. Specify the map use,
the data sources, and the spatial representations for each
specified map scale; data accuracy and collection guidelines
for each map view and 3D view; how the theme is displayed, its
symbology, text labels, and annotation. Consider how each
map layer will be displayed in an integrated fashion with other
key layers. For modeling and analysis, consider how
information will be used with other datasets (for example, how
they are combined and integrated). This will help you to identify
some key spatial relationships and data integrity rules. Ensure
that these 2D and 3D map display and analysis properties are
considered as part of your database design.
3-Specify the scale ranges and the spatial
representations of each data theme at
each scale
• Data is compiled for use at a specific range of map
scales. Associate your geographic representation
for each map scale. Geographic representation will
often change between map scales (for example,
from polygon to line or point). In many cases, you
may need to generalize the feature representations
for use at smaller scales. Rasters can be
resampled using image pyramids. In other
situations, you may need to collect alternative
representations for different map scales.
4-Decompose each representation
into one or more geographic datasets
• Discrete features are modeled as feature classes of points,
lines, and polygons. You can consider advanced data types
such as topologies, networks, and terrains to model the
relationships between elements in a layer as well as across
datasets.
• For raster datasets, mosaics and catalog collections are
options for managing very large collections.
• Surfaces can be modeled using features, such as contours,
as well as using rasters and terrains.
5-Define the tabular database structure
and behavior for descriptive attributes
• Identify attribute fields and column types.
Tables also might include attribute domains,
relationships, and subtypes. Define any valid
values, attribute ranges, and classifications
(for use as domains). Use subtypes to
control behaviors. Identify tabular
relationships and associations for
relationship classes.
6-Define the spatial behavior, spatial
relationships, and integrity rules for your
datasets
• For features, you can add spatial behavior and
capabilities and also characterize the spatial
relationships inherent in your related features for a
number of purposes using topologies, address
locators, networks, terrains, and so on. For
example, use topologies to model the spatial
relationships of shared geometry and to enforce
integrity rules. Use address locators to support
geocoding. Use networks for tracing and path
finding. For rasters, you can decide if you need a
raster dataset or a raster catalog.
7-Propose a geodatabase
design
• Define the set of geodatabase elements you want in
your design for each data theme. Study existing
designs for ideas and approaches that work
• Copy patterns and best practices from the ArcGIS
Data Models.
8-Design editing workflows and
map display properties.
• Define the editing procedures and integrity rules
(for example, all streets are split where they
intersect other streets and street segments
connect at endpoints).
• Design editing workflows that help you to meet
these integrity rules for your data.
Define display properties for maps and 3D views.
• Determine the map display properties for each
map scale. These will be used to define map
layers.
9-Assign responsibilities for
building and maintaining each
data layer
• Determine who will be assigned the data
maintenance work within your organization
or assigned to other organizations.
Understanding these roles is important. You
will need to design how data conversion and
transformation is used to import and export
data across various partner organizations.
10-Build a working prototype.
Review and refine your design
• Test your prototype design. Build a sample geodatabase
copy of your proposed design using a file, personal, or
ArcSDE Personal geodatabase. Build maps, run key
applications, and perform editing operations to test the
design's utility. Based on your prototype test results, revise
and refine your design. Once you have a working schema,
load a larger set of data (such as loading it into an ArcSDE
geodatabase) to check out production, performance,
scalability, and data management workflows.
• This is an important step. Settle on your design before you
begin to populate your geodatabase.
11-Document your geodatabase
design.
• Various methods can be used to describe your database design and
decisions. Use drawings, map layer examples, schema diagrams,
simple reports, and metadata documents.
• Some users like using UML (Unified Modeling Languag). However,
UML is not sufficient on its own. UML cannot represent all the
geographic properties and decisions to be made. Also, UML does not
convey the key GIS design concepts such as thematic organization,
topology rules, and network connectivity. UML provides no spatial
insight into your design.
• Many users like using Visio to create a graphic representation of their
geodatabase schema such as those published with the ArcGIS data
models. ESRI provides a tool that can help you capture these kinds of
graphics of your data model elements using Visio.

Geodatabase design steps for students.pptx

  • 1.
  • 2.
    (1) First, youidentify the thematic layers you'll need for your particular application and information requirements. What are the data themes that make up your key landscapes? (2) Then, you define each thematic layer in more detail. The characterization of each thematic layer will result in a specification of standard geodatabase data elements such as feature classes, tables, relationship classes, raster datasets, subtypes, topologies, domains, and so on.
  • 3.
    • When identifyingthematic layers in your design, try to characterize each theme in terms of its visual representations, its expected uses in the GIS, its likely data sources, and its levels of resolution. For example, at what scales and extents will you need to use this information, and how will its elements be represented at each scale? These characteristics help describe the high- level contents expected from each theme.
  • 4.
    • Below isan example description of a data theme for ownership parcels in a cadastral application:
  • 6.
    • Once youhave identified the key thematic layers in your design, the next step is to develop specifications for representing the contents of each thematic layer in the physical database. • List the map scales and extents that you'll need to work with. • For each, describe how the geographic features are to be represented (for example, as points, lines, polygons, rasters, surfaces, or tabular attributes). • How should the data be organized into feature classes, tables, and relationships? • How will spatial and database integrity rules be used to implement GIS behavior?
  • 7.
    • There aretotal 11 steps to designing a geodatabase • The initial design steps 1 through 3 help you identify and characterize each thematic layer. • In steps 4 through 7, you begin to develop representation specifications, relationships, and ultimately, geodatabase elements and their properties. • In steps 8 and 9, you will define the data capture procedures and assign data collection responsibilities. • In the final stage (steps 10 and 11), you will test and refine your design through a series of initial implementations. • In this final phase, you will also document your design.
  • 8.
    1-Identify the informationproducts that you will create and manage with your GIS • Your GIS database design should reflect the work of your organization. Consider compiling and maintaining an inventory of map products, analytic models, Web mapping applications, data flows, database reports, key responsibilities, 3D views, and other mission-based requirements for your organization. List the data sources you currently use in this work. Use these to drive your data design needs. • Define the essential 2D and 3D digital basemaps for your applications. Identify the set of map scales that will appear in each basemap as you pan, zoom, and explore its contents.
  • 9.
    2-Identify the keydata themes based on your information requirements • Define more completely some of the key aspects of each data theme. Determine how each dataset will be used—for editing, GIS modeling and analysis, representing your business workflows, and mapping and 3D display. Specify the map use, the data sources, and the spatial representations for each specified map scale; data accuracy and collection guidelines for each map view and 3D view; how the theme is displayed, its symbology, text labels, and annotation. Consider how each map layer will be displayed in an integrated fashion with other key layers. For modeling and analysis, consider how information will be used with other datasets (for example, how they are combined and integrated). This will help you to identify some key spatial relationships and data integrity rules. Ensure that these 2D and 3D map display and analysis properties are considered as part of your database design.
  • 10.
    3-Specify the scaleranges and the spatial representations of each data theme at each scale • Data is compiled for use at a specific range of map scales. Associate your geographic representation for each map scale. Geographic representation will often change between map scales (for example, from polygon to line or point). In many cases, you may need to generalize the feature representations for use at smaller scales. Rasters can be resampled using image pyramids. In other situations, you may need to collect alternative representations for different map scales.
  • 11.
    4-Decompose each representation intoone or more geographic datasets • Discrete features are modeled as feature classes of points, lines, and polygons. You can consider advanced data types such as topologies, networks, and terrains to model the relationships between elements in a layer as well as across datasets. • For raster datasets, mosaics and catalog collections are options for managing very large collections. • Surfaces can be modeled using features, such as contours, as well as using rasters and terrains.
  • 12.
    5-Define the tabulardatabase structure and behavior for descriptive attributes • Identify attribute fields and column types. Tables also might include attribute domains, relationships, and subtypes. Define any valid values, attribute ranges, and classifications (for use as domains). Use subtypes to control behaviors. Identify tabular relationships and associations for relationship classes.
  • 13.
    6-Define the spatialbehavior, spatial relationships, and integrity rules for your datasets • For features, you can add spatial behavior and capabilities and also characterize the spatial relationships inherent in your related features for a number of purposes using topologies, address locators, networks, terrains, and so on. For example, use topologies to model the spatial relationships of shared geometry and to enforce integrity rules. Use address locators to support geocoding. Use networks for tracing and path finding. For rasters, you can decide if you need a raster dataset or a raster catalog.
  • 14.
    7-Propose a geodatabase design •Define the set of geodatabase elements you want in your design for each data theme. Study existing designs for ideas and approaches that work • Copy patterns and best practices from the ArcGIS Data Models.
  • 15.
    8-Design editing workflowsand map display properties. • Define the editing procedures and integrity rules (for example, all streets are split where they intersect other streets and street segments connect at endpoints). • Design editing workflows that help you to meet these integrity rules for your data. Define display properties for maps and 3D views. • Determine the map display properties for each map scale. These will be used to define map layers.
  • 16.
    9-Assign responsibilities for buildingand maintaining each data layer • Determine who will be assigned the data maintenance work within your organization or assigned to other organizations. Understanding these roles is important. You will need to design how data conversion and transformation is used to import and export data across various partner organizations.
  • 17.
    10-Build a workingprototype. Review and refine your design • Test your prototype design. Build a sample geodatabase copy of your proposed design using a file, personal, or ArcSDE Personal geodatabase. Build maps, run key applications, and perform editing operations to test the design's utility. Based on your prototype test results, revise and refine your design. Once you have a working schema, load a larger set of data (such as loading it into an ArcSDE geodatabase) to check out production, performance, scalability, and data management workflows. • This is an important step. Settle on your design before you begin to populate your geodatabase.
  • 18.
    11-Document your geodatabase design. •Various methods can be used to describe your database design and decisions. Use drawings, map layer examples, schema diagrams, simple reports, and metadata documents. • Some users like using UML (Unified Modeling Languag). However, UML is not sufficient on its own. UML cannot represent all the geographic properties and decisions to be made. Also, UML does not convey the key GIS design concepts such as thematic organization, topology rules, and network connectivity. UML provides no spatial insight into your design. • Many users like using Visio to create a graphic representation of their geodatabase schema such as those published with the ArcGIS data models. ESRI provides a tool that can help you capture these kinds of graphics of your data model elements using Visio.