1) The document discusses valuation techniques for mergers and acquisitions (M&A), focusing on synergies.
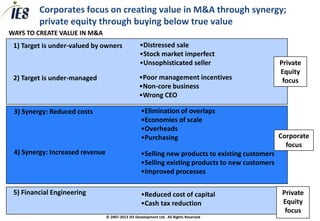
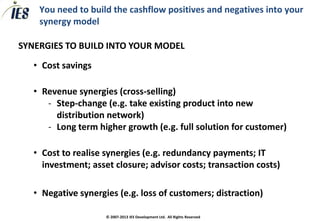
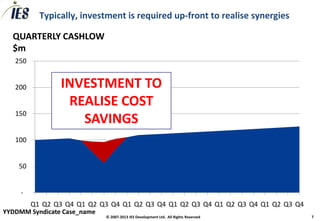
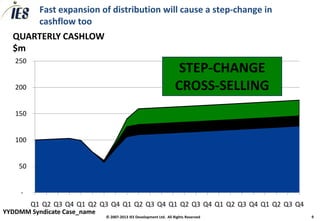
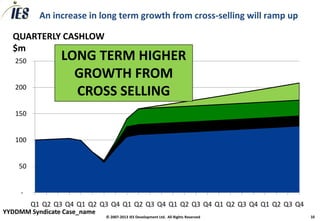
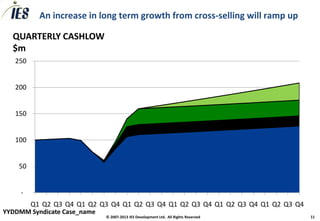
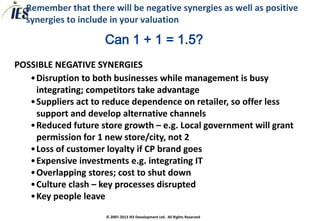
2) Synergies are cost savings and revenue increases that can be realized by combining two companies.
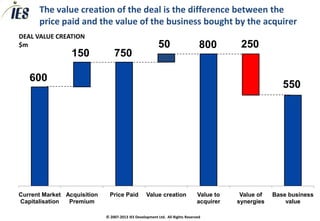
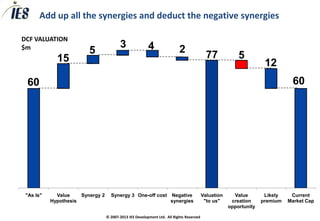
3) The value created by a deal is the difference between the price paid and the value of the acquired business including synergies.