SlideShare a Scribd company logo
1 of 27
Giulio Laudani                    #27                                                                                                                                                              Cod. 20137


                                                                 Corporate Finance
                        General concept on Value and its implication: ____________________________________________________ 1
                            Understand the company positioning in the market ________________________________________________________ 1

                            What we need to do to boost value creation: ______________________________________________________________ 4
                                 The cycle of business and the perfect owner theory ____________________________________________________________________ 4
                                 M&A Transaction _______________________________________________________________________________________________ 5
                                 Disinvest from business __________________________________________________________________________________________ 6
                                 Capital structure ________________________________________________________________________________________________ 7

                            How to implement value enhancing strategies and how to ensure management to recognize them: _________________ 8
                                 Governance & compensation scheme _______________________________________________________________________________ 9
                                 Information gave by the market and managerial implication ____________________________________________________________ 10

                        Valuation methodologies are based on several variants: ___________________________________________ 12
                            DCF Model _________________________________________________________________________________________ 12
                                 WACC Estimation: ______________________________________________________________________________________________ 12
                                 OFCF Estimation: _______________________________________________________________________________________________ 13
                                 Final remark and ending procedure ________________________________________________________________________________ 18
                                 The CAPM approach needs: ______________________________________________________________________________________ 19

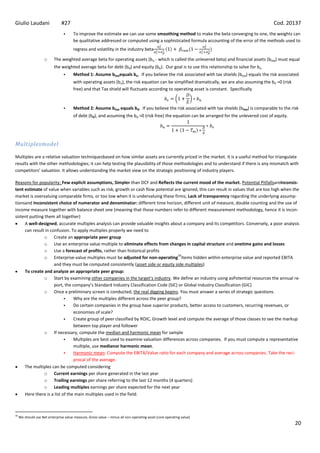
                            Multiples model _____________________________________________________________________________________ 20

                            Economic Profit (EVA) Model __________________________________________________________________________ 23

                            APV Model: ________________________________________________________________________________________ 23

                            Equity DCF Model [Used for banks]:_____________________________________________________________________ 23

                            Special valuation case: _______________________________________________________________________________ 24
                                 Emerging market valuation: ______________________________________________________________________________________ 24
                                 High growth industry ____________________________________________________________________________________________ 25
                                 Cyclical industry valuation both from a managerial prospective and a financial one __________________________________________ 25
                                 Bank industry __________________________________________________________________________________________________ 25
                                 Insurers: ______________________________________________________________________________________________________ 26


General concept on Value and its implication:
Value is a broad measure well expressed by cash flow trend, and it reassumes the healthiness of a company, since itrepresents the interest of
all the stakeholders, granting prosperity to all the community/business. Furthermore it is a long time measureused to assess fundamental driver
for stock price and it is not biased by short term deviation which are consequence of bubbles. Measure of value creation,expressing the-
                                                             1
firms’competitive advantage, are ROIC spread and Growth .
There is a direct link between future cash flow and competitive advantage, the higher the second the higher will be the first. This relation is the
reason behind the value reasoning, in fact increasing value is equal to ask the business to increase its competitive advantage.The investment rate
is given by                                               it clearly shows the relationship between cash flow and value


Understand the company positioning in the market
The first task to be performed when valuing a firm is to define if there is any competitive advantage and itsweakness and strength compared to
benchmark peers and their cause. We could implement several models/scheme to properly address the value sources:
     The first three to be presented are qualitative models and they are focus on understanding the positioning of the firms’ goods (the first),
     the firm’market placementwith a dynamic approach(the second one) while the last one is a qualitative representation on where the com-
     petitive advantage has been manifested:
               The Porter Model outline the mixtures of internal and external factor to define profitability:
                      1. The less intense is the rivalry in its industry the better, higher margin are possible;
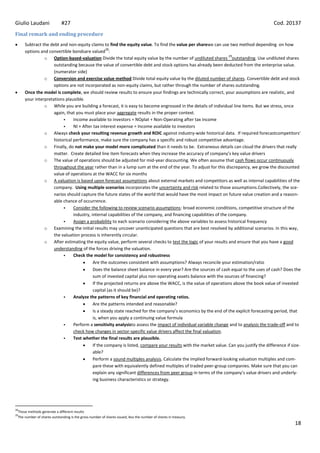
                      2. The less danger of potential entrants& the higher the barriers to entry;the higher is theretentions of extra profit
                               o Tangible barriers – anything that would put a potential entrant at a competitive disadvantage after entryi.e.


1
 Note that an higher growth is positive only in the case of a positive spread between ROIC and WACC otherwise the company will increase the value destruction, however investing in growth will lower the ROIC, since
the marginal value contribution of new added project will decrease as well [many companies decide to not invest due to the fear of decreasing their ROIC]
                                                                                                                                                                                                                        1
Giulio Laudani        #27                                                                                                             Cod. 20137
                                            Scale-based cost advantages, scope-based cost advantages: when fixed costs can be shared among
                                             different products,
                                            Knowledge-based cost advantages: when experience is an important factor in knowing how to do
                                             things efficiently,
                                            Financial resources: when firms are able to fight off new entrants by cutting prices as a result of hav-
                                             ing significant financial resources available,
                                            Favored access to particular resources: when existing firms control resources that are useful or es-
                                             sential to efficient operation (For example, airlines may control landing slots at favorable times.),
                                            Favored access to distribution channels: when existing firms can more easily reach the customers
                                            Customer goodwill and reputation: when a firm has built up a loyal customer base, but new en-
                                             trants have to win those loyal customers away or convince new customers who were not buying the
                                             product to do so
                                            Customer lock-in: when customers tend to continue with the original firm because of issues such as
                                             compatibility with existing equipment, economies in maintenance & repair, etc.
                                            Legal & political restrictions: when firms are protected against entry by legal restrictions such as
                                             government certification or licenses (Existing firms may also encourage the government to ban for-
                                             eign competitors from entering the industry.)
                             o Psychological barriers – beliefs on the part of potential entrants that, if they enter, firms already in the busi-
                                 ness will react aggressively, and are even willing to incur short-term losses, to force out the new entrant
                                            Fighting offan entrant or two is one way for a firm to gain a reputation for being willing & able to
                                             fight off new entrants.
                                            Maintaining excess capacity for production or distribution
                                            Keeping patents & products on the shelf ready for use if needed can also send a strong signal
                  3. Theless numerous and less aggressive the firms that sell substitute products, and the more numerous and more ag-
                       gressive the firms that sell complementary products;
                             o If there are many good substitutes for a product, the elasticity of demand for that product will be high. This
                                 will limit the ability of the firm to raise prices and will consequently lower potential profits.
                  4. The weaker the bargaining power of clients/customers;
                             o The client industry is highly concentrated. (The firms buying the product are in an industry in which there are
                                 just a few companies and they are large.)
                             o One particular client industry buys a very large share of the products
                             o The item is not essential to the clients; there are lots of possible substitute in the clients’ production process.
                             o The cost of the item is a large fraction of the clients’ costs/budget. The client is then likely to resist attempts
                                 to push up prices.
                  5. The weaker the bargaining power of suppliers
                             o The supplier has a franchise or patent on a particular item that is required by firms in the industry.
                             o The supplier is not restrained by any clause substitutes for its product.
                             o The supplier industry is concentrated and the firms are not aggressive rivals with each other
           Another technique to represent the competitive positioning is the SWOT analysis:
                      It divides the success mixture in internal factor: Strength and weakness: related to brand, management or any other va-
                      riables related to the goods or firms’ business model
                      And those who are external: Opportunities and threats, such as geographical barrier, market evolution or any variables
                      related to macro change in the society/ countries
           Consequence and reasons of the presence of competitive advantage is measured by the firm's profitability: it can be above or be-
            low the industry average. This is a consequence of:
                      Price premium side:
                                 Innovative product are difficult to copy or are protected by patent
                                 Quality: the customer are willing to pay more for a better goods
                                 Brand: differently to quality the costumer are willing to pay more even if there is no quality difference
                                 Client lock-in: clients are unable or unwilling to change goods
                      Cost and capital efficiency side:
                            o     Innovative business method: hard to be copy since it isn’t directly observable
                            o     Unique resource, Economies of scale
                            o     Scalable product: any new clients have a low margin cost (common in IT industry)
                      The higher profitability can be preserved in the long term only if it is sustainable
   Other possible schemes to be use are those inside the quantitative family. These models consist of computing specific value driver measure,
   which are ROIC and Growth:
                                                                                                                                                   2
Giulio Laudani               #27                                                                                                                                       Cod. 20137
                  o     High ROIC companies should search for higher growth, and the opposite strategy should be pursued by low or negative ROIC-
                        WACC spread companies, those companiesshould operate on their efficiency and value creation before looking to growth
                                We should reorganized the financial statements in effort to have a clean measure of total invested capital and its
                                 related after-tax operating income, needed to compute ROIC
                                To better understand ROIC, we can decompose the ratio as follows


                                                As the formula demonstrates, a company’s ROIC is driven by its ability to (1) maximize profitability, (2)
                                                optimize capital efficiency, or (3) minimize taxes
                                                We can further decompose ROIC as much as we want, if you are working inside a company or if the com-
                                                pany releases operating data, you should link operating drivers directly to ROIC. All this work will give you
                                                                  2
                                                a better insight
                                   It is hard to retain for long period high level of ROIC. There are several empirical research to demonstrate those
                                    trends divided by company quintile
                                                ROIC is easier to preserve than growth rate by continuing introducing new product and by pursuing inno-
                                                vation, there is an empirical evidence that best player will be able to preserve those advantages
                                                Any goods portfolio will go toward a common base line after tot years
                                                Every sector has a typical average ROIC level, however there is a large range within the same sector and
                                                the difference among industries
                                                Nowadays the trends are positive for Health care equipment and Aerospace defense, while it is trending
                                                down for Auto, Tracking, Advertisement and health care facilities
                                                Size do not matter
                  o     Organic Growth can be pursueby introducing new product, expanding the market share,while the inorganic one by acquisi-
                        tion, all of them show a marginal decreasing value contribution
                                   The ability to grow cash flows over the long-term depends on a company’s ability to organically grow its revenues
                                                Calculating revenue growth directly from the income statement will suffice for most companies. However
                                                the year-to-year revenue growth numbers sometimes can be misleading.
                                                It is also useful to decompose the Growth rate using the information on the business characteristic to as-
                                                sess subunits/divisions expectation
                                   Growth compared to ROIC is harder to sustain, even if both ultimately depends on the underling product’s life
                                    cycle, since market dimension is caped and mature growth rate is basicallythe economic underling. Hence, the
                                    three prime culprits affecting revenue growth are:
                                                                                 3
                                                Introduce new product: higher value creation but longer and harder to implement;
                                                Expand the market size:it can be made by attracting new customers or by pushing the existing one to buy
                                                more
                                                Increase its own market share: it isn’t a long term strategy, any movement in the market will trigger a
                                                reaction form the competitors. It is a winner strategy only for big players which are bale to force out
                                                smaller competitors entirely
                                                Mergers and Acquisitions. When one company purchases another, the bidding company may not restate
                                                historical financial statements;this will bias one-year growth rates upwards. There could be two types
                                                       o Bolt-on wherethe bidder will acquire small business to increase its portfolio or filling gap distri-
                                                            bution channel
                                                       o Large acquisition where the bidder try to acquire same size business, those strategy shows
                                                            poorer value creation and are focus only on the cost side, revenue do not increase
                                   It is hard to grow since the base level on which growth it’s computed increase over time, hence the firms should in-
                                    troduce new products at an increasing rate. Some empirical papers show:
                                                Big company has lower growth
                                                High “g” business will rapidly loss power
                                                There is an higher dispersion value in the market than ROIC
                                                Business tends to grow at an higher rate than home economy due to:
                                                       o Based sample(public company are better than other)
                                                       o Growth is usually carry out in other economy
                                                       o Outsourcing strategy do not increase GDP, but business in that high specialized sector will grow


2
We can desegregate by units, by division, by stores, which can be divided in # transaction and in amountof transaction, where # transaction by square feet/store and transaction/store
3
However this measure doesn’t account of the risk of the project, there is no risk correction [fuzzy comparison]
                                                                                                                                                                                         3
Giulio Laudani                #27                                                                                                                                       Cod. 20137
      The last angle to be understand, besides the value/competitive advantage side, is theintrinsic riskbeard by the company, since future cash
      flow are affected by the strategies that have granted to achieve those market positioning(any policy aiming to enhance this units will in-
      crease both the cash flow, but even the risk/volatility of these flows).
                o Companies must decide between the tradeoff of bearing too high risk (survivorship is challenged) and higher profit/margin,
                      and theymust internally decide which risk is going to be hedged, considering the marginal cost against its benefit, which are
                      granted by the more favorable market judgment on more stable cash flow
                o To understand if the business is sustainable, to assess the aggressiveness of a company’s capital structure, we examine:
                              Liquidity – the ability to meet short-term obligations. We measure liquidity by examining the interest coverage ra-
                               tio defines as:
                                         EBITDA / interest measures the ability to meet short-term financial commitments using both profits, as
                                         well as depreciation dollars earmarked for replacement capital.
                                         EBITA / interest ratio measures the ability to pay interest without having to cut expenditures intended to
                                         replace depreciating equipment.
                              Leverage – the ability to meet long-term obligations. Leverage is measured by computing the market-based debt-
                               to-value ratio
                                         The use of leverage magnifies the effect of operating performance. Specifically, with a high leverage ratio
                                         (a very steep line), the smallest change in operating performance, can lead to enormous changes in ROE
                                         The higher the leverage ratio (IC/E), the greater the risk, since fixed asset are financed by redeemable

What we need to do to boost valu e creation:
After understating the firm’s competitive advantage and market positioning we should study how to Boost value creation, we should aim to
solve the weakness discovered in the preliminary phase to increase either ROIC or Growth depending on their relative value. We will speak about
the perfect owner theory which will allow us to understand how properly run a business by identifying when we need to reallocate/allocate re-
sources and how to set up a proper capital structure depending on the business’s life cycle .


The cycle of business and the perfect owner theory
The scope of this theory is to explain and justified how ownership matter in creating value. The main idea is that any goods/business has a life
cycle and each of these phases should be run by a specific type of shareholder/management.
Hence the best owner is not static, it is dynamic moving from large institution to venture capital: First phases are suitable for founder to stimu-
late entrepreneurship, When the company starts to develop there will be the entrance of angel or venture, providing more capital and mana-
gerial skills; Go public to rise more money, and create governance control to align managers interest with investors; Go in M&A or fusion to in-
crease in size & Go in private equity transaction to reconstructing or refocusing the business
     Executive have to think about their business as a portfolio of different asset, where any of them have an economic cycle, so to obtain the
     maximum value they need to be managed using specific skills that can provided by specific owners’ class, such as:
                 o Unique links with other business
                 o Distinctive skills (managerial or functional)
                 o Better governance, for a specific time there is the best business form
                 o Better insight and foresight (be able to capitalize on innovation)
                 o Influence on critical stakeholder (it is crucial in emerging market)
                                                                                                                                                        4
      Hence, the correct approach is to create a corporate strategic team focus on constructingthe perfect portfolio by :
                o Determining the market value of the company as whole and comparing it by the management expectation to see if there ex-
                    ist any gap
                o Identifying and valuing new opportunityinternally
                o Evaluating if it is the case to disinvest form some business
                o Identifying potential acquisition or other initiatives; the best investment for high performing management is usually a com-
                    pany in a financial distress or poor return
                o Value how much the company may gain from a changing in the capital structure
      The tool used to maximize the value creation are: M&A, Disinvestment and capital structure strategiesled by this theory


4
 Remember that the diversification for a company is not a source of value, investor can do the same with lower cost, and hence conglomerate strategy doesn’t add value. the management
doesn’t have confidence to properly finance the different business to anticipate cycle and they don’t use their more stable cash flow to increase leverage compared to their peers, moreo-
ver the different division usually performs less than standing alone business line due to lack of focus
                                                                                                                                                                                        4
Giulio Laudani                   #27                                                                                                                       Cod. 20137
M&A Transaction
M&A are an important element in a dynamic economy, in fact it is the best (and sometimes the only) way to sensibly reallocate resources. M&A
aims to create value both for the whole economy and for the investors; in fact better ownership is more probable to increase the profitability of
the business itself.Since Value “amount” creation in M&A is not sure and it must be share between the bidder and the target and the usual pay-
ment methods consists of an up-front premium payment to the target by the bidder, we can easily assess that this value distribution is favoring
                          5
the target shareholders . M&A deal shows some peculiar features: theyhappen in waves[a pre signal the beginning of the phase is the lowering
of the interest rate, allowing big leverage buyout]; Favorable elements to the bidder are: if the acquirer has strong performance, low transaction
premium and being the sole bidder helps. There are some myths on success or failing: size relative to target, accounting magic (like change in
EPS dilution) and the relationship between SIC code of the players.
     There are several possible value source in the M&A transaction, they can be classified as synergy and control one, here there is a list:
                o Improving the target performance by working on possible improvement on the revenue side either by reducing cost or by
                     managing the company more efficiently
                o Consolidate or remove excess capacity from the market (even less tangible like reducing sale force, not only factories)
                o Create market access to geographical area (sometimes it is a prerequisite)
                o Acquire new technologies more quickly and cheaper than develop them internally
                o Roll up strategy, when a business as a group can realize substantial cost savings or achieve higher revenue than the individual
                o Consolidate to improve competitor behavior, meaning create oligopoly, which is hard both because of country legislation
                     against monopoly and because of the difficulty bear by companies to avoid new entrance in the market
                o Enter into a transformational merger, to totally modifying the underlying business, refocusing the business
                o Buy cheap business in down economy and restructuring them
                o Pick winnersearly and develop them, by exploit the so called cash slap problem, meaning bigger company have more availa-
                     ble cash to be implemented in costly project retain by the target who cannot implement them due to cash constrain
                o Tax benefits (loss on the target or specific benefits that cannot be exploit by the actual owner, or by write up asset, increas-
                     ing future depreciation) together with all the other financial benefits: Lower capital cost, Better capital structure and Differ-
                     ent seasoning evolution [use of internal cash flow]
     The synergy component is estimated by looking after possible operating and financial improvements (higher cash flow or lower discount
     rate) achievable only thanks to the merger with an industrial partner.
                o Estimating cost saving must be structured using a disciplined methodologies, meaning we should allocate any improvement
                     to a specific items, being clear and focus on how to achieve it. It is crucial to involve the experienced line management, and
                     to compare the combined result with the comparable benchmark to avoid unrealistic plan
                o Estimating revenue improvement must consider the possible loss of clients and value manger in the operation and the pos-
                     sibility to incur in additional cost to uniform the business model. Be explicit about where any revenue growth is going to be
                     obtained. This estimation is harder
                o EstimatingFinancial synergies is worked out by trying to assess the ex-post firm structure, valuing the additional value
                o A final comment on the implementation and timing:
                                It is important to understand that any value source are not be on the table forever after the merger, hence it is cru-
                                 cial to capture all of it as soon as possible
                                The M&A transaction must be led by a detailed plan to be implemented at day one
                                Empirical result shows that companies are quite good in assessing the cost saving, while they are too optimistic on
                                 the revenue improvement side
     The control component is related to the possibility to increase value by properly/efficiently manage the business, this kind of value is totally
     linked to the target own business and should be paid entirely to the target. How to value this lack of efficiency:
                o At first we should estimate the as-usual value (business run by the old management).Then we will perform another valuation
                     assuming to solve all the inefficiency, the difference (if any) with the base value is the control value
                o A final comment on the implementation of this strategy:Even if it is an “easy task” to improve management efficiency it is
                     rare/hard to run an M&A transaction lead by this motivation, since the target management will strongly react against this
                     operation and it’s not obvious that target shareholder will accept the bidder offer, so since the legislation on defensive tactics
                     is quite open it is hard to run hostile takeover, unfortunately this is a decrement for the wholeeconomy (lack of value en-
                     hancement)
     There are different ways to pay, each of those present different advantage and disadvantage:
                                        6
                o Cash payment [assuming no financial constrain for the buyer] can result in a lower premium compared with stock one and
                     can testify the bidder’s confidence on the deal, since in case of future loss (due to misleading valuation) there is no possible
                     ex post correction on the price paid, furthermorethere is a tax issue since the old investor must paid tax on capital gain

5
    Proved by empirical results which demonstrate that the winner part is always the target (however the overall aggregated value is higher than before)

6
    Do not do this for high growth companies
                                                                                                                                                                   5
Giulio Laudani                    #27                                                                                                                                             Cod. 20137
                      o Stock payment (the Bidder will exchange own stock (newly issued) with those of the Target one) is a little bit more expensive,
                        but there is the sharing of risk, so if you are not confident enough confident this method is the better, otherwise cash.
                   o There are other mean of payments to solve specific problems:
                                    Vendor loan: sometimes Bidder doesn’t have enough resource (multimedia case), hence the Target can help by
                                     providing a loan (usually really cheap condition)
                                    Convertible: it is a compromise between cash and equity
                                              7
                                    Earn-out : it is more complicated and it is a sort of postponed payment related to the Target performance without
                                     issuing equity. It is a good compromise
                                                The Target will lock in a base value, and will participate in the upper side
                                                The transaction can be speed up thanks to this clause
                                                                                                                                                      8
                                                The parties must decide how will be settled the compensation and the measurements of performance
                                                It is possible to hedge this risk by using a collaroption to avoid downside by forgo the upper side. This
                                                may be good for the Target to reduce the volatility
                                    Squeeze-out: the option to force minority with less 5% if the OPA reach 95% to sell
                                    Sell-outright: sell the reaming 10% at the same condition
                   o Some final comments
                                    The concept of accretive: it is a misleading one and it doesn’t put in evidence the economic ratio behind the lower
                                     market multiple of the target (something must be wrong), that problem can drop the bidder value down, or by the
                                     presence of some distortion on the P/E
                                    The synergy sharing process depends on the bargain power of the bidder (the synergy can be achieve only by him)
                                     on the offer typology (private placement or auction) and on relative dimension
         Defensive tactics allowed for Target are country/area specific. There is the conflict of two principles: the efficiency of the market and the
         protection of national or valuable situation. In EU the new Takeover bid clearly define which tactics can be implement by Targets and Bid-
         ders, here there is a list of the most famous and used one:
                   o White knights the Target will ask to another firm, which is consider friendly, to bid for the transaction
                   o Golden parachute or silver one the Target grants to top management big compensation in case of hostile takeover, this
                        rules is usually set to protect executive that will be fire after the transaction
                   o Poison pillow the board will issue new stock at discount to increase the cost for the Bidder
                   o Crown jewel the Target will sell all the valuable asset to other and will cash out
                   o Labor agreements  they can hamper the Bidder possibility to effectively change production


Disinvest from business
Even if divestures create value and there are several empirical evidence that companies employing balanced portfolio approach perform better
than companies that rarely disinvest, this procedure is undergo only due to external pressure not for a proactive program, and tends to happen
in wave as M&A, and nowadays public ownership transaction has become the principal mean for disinvesting. This behavior is mainly due to two
circumstance: The management typical adverse perception of divesture due to the general idea that disinvest means failing, furthermore reduc-
ing the size of the company is a negative prospective for Executive salary and maybe difficult to find an alternative investment, in fact either
1)holding cash will lower the performance, or 2)repaying debt will be the same of invest at the debt cost, which is usually by far lower than asset
return or 3)buying back stock can be problematic as well since the market can react negatively (the company doesn’t have future project)
     However this strategy allows companies to create value form these sources of value:
                o Disinvest form a underperforming business avoids the direct costs of bearing deteriorating results
                o The subsidiary can be morecompetitive or better managed under other ownership
                o There is the possibility to take advantage of asymmetric information
                o The possibility to focus on the core business
                o Problems solved by divesture:
                             There could be the case of an incompatible culture or of a possible conflict of interest with the subsidiary business
                             The parent could not have the experience and skill to develop properly the business
                             Underperforming business brings down the value of the entire corporation
     To properly set up a disinvest strategya company must spend regular and dedicated session for exit review meeting, forcing the manage-
     ment to evaluate all businesses:
                o The first step is to understand the entity of synergies and shared asset, services and system, in this way the management can
                     understand which is the cost of the operation
                o The mixture of different type of business allows to reduce the operating risk, and this will grant an higher financial capacity


7
    It can be set on the overall business (warrants) or just to the Target one (contingent payment), each of them have its own advantage and cons
8
     There could be problems on monitoring, external events and rise of conflict of interest. That’s way it is crucial to properly address all the possible situations/problems
                                                                                                                                                                                          6
Giulio Laudani                #27                                                                                                                                          Cod. 20137
                   oIf the operation is undergo is really important to understand and well define the legal aspect of the operation to avoid any
                    slow down during the transaction or unpleasant surprise after the transaction
                o Consider the market valuation to discover if there is a significant mismatch between intrinsic value and current valuation (ex-
                    ploiting asymmetric info). In a sense liquidity in the market allows divesture to be more attractive
      Type of transaction can be private or public, the first one is better if you can identify a proper bidder, not all the transaction bring a cash
      proceeds, many create long term value by giving new share to existing shareholder:
                o Equity curve out: in this way the parent doesn’t give up control on subsidiary, to maintain same synergies
                              However, the separation is typically irreversible, due to possible dilution of parent ownership, hence it is important
                               that parent executive need to plan a full separation since the beginning of the transaction
                              The risk of unclear governance is present in this type of transaction, and this can destroy the benefits that were
                               supposed to happen. Any subsequent reacquisition is typical a negative sign and empirical research shows that any
                               blend strategy doesn’t grant positive return for the shareholders
                o Spin off: the parent gives up the control of the subsidiary, which shares will be divided through parent shareholders, allowing
                                                                           9
                    the maximum strategic flexibility for the subsidiary . Sometimes this transaction is done with a two-step: at first a partial IPO
                    followed by the spin off, this typology allows the existence of a market for the parent shareholder in the case they want to li-
                    quidate their stake
                o Split off is an offer to parent shareholder to exchange their shares with those of the subsidiary, so the equity will be divided
                o Tracking stock is a new possibility that allows the parent to retain control, but create severe problem of governance, in fact
                    the board will be the same
                              Each entity will liable to all the group debt, hence there is no financial advantage, furthermore empirical research
                               have proven that there is no value creation for this transaction
                o IPO is the way the new share are issue in the market to new investors
                o Joint venture and Trade sale are the private transaction


Capital structure
                                                                                                                                    10
      Consequences of the capital structure and the typical tradeoffs in defining the optimal structure :
                 o Tax savings is granted by the possibility to reduce the taxable income, and therefore increase the value of the company.
                      However there is an important consideration to be made: usually taxation on interest income is higher than on capital gains
                      for investors, hence with a 100% debt funding the investor tax rate could be higher
                 o Reduction of corporate overinvestment: debt can help impose discipline on mangers; therefore the management is forced
                      to pay back the debt interest expense before making another investment. This is quite crucial for highly fragment ownership
                 o Cost of business erosion and bankruptcy: highly levered company could forgo good investment opportunity or reduce R&D
                      (loss of flexibility), moreover they can lose client, employers and suppliers due to the risk of a financial distress
                 o Cost of investor conflicts may become crucial, the two main investors categories can have different view on how to run the
                      business (different risk appetite, moral hazard problem)
                 o Besides all this consideration there isn’t any analytical formula for the optimal choice, because every business have different
                      needs and characteristic, which will require different level of flexibility and robustness form the financial side
      The tools used by firms to finance their business are (form the most preferred to the less one):Internal resources, in other world reinvest-
      ing the income; issuing debt, which is the more common practice. Thereexist several possible instruments to be issue; &issuing equity
      which is the last resort because it can cause the share price to fall. Some empirical data:
                 o Firms ends to react to regain their target capital structure after a change only after two years rather than immediately after
                      each change; continuously adjustment are too costly and impracticable
                 o Firms are likely to issue equity when they are overleveraged compered to their target
      How to set an effective capital structure:
                 o Look at the peer group is a good approach; at least firms are not giving away any competitive advantage derived by the capi-
                      tal structure. This problem is quite severe when competitors can use their financial robustness to start a war of price
                 o Credit rating analysis is suggested when peer group is far away from their optimal structure due to wave change in the mar-
                      ket. In doing this the executives must understand the key driver in rating:
                                              The size is an external factor and it is determinant only for blue chips segment, it is a prerequisite to
                                              achieve high rating (above AA)


9
The subsidiaries show the higher performance improvement (empirical test)
10
  Debt leverage matter less than we have expected, in fact firm’s structure is usually set up more in a negative way, by trying to avoid losing value more than achieving higher value with a
prospective attitude  The cost of an error is more costly than any possible advantages. Market surveys have proven that the firms prefer a rating range between A+ and BBB-, for struc-
ture outside this range the loss of value or the cost are too high in fact among this range the value of the tax shield difference is really slim


                                                                                                                                                                                           7
Giulio Laudani         #27                                                                                                             Cod. 20137
                                          Coverage ratiogives a measure on how many times the firm is able to repay interest by using cash flow. It
                                          is more relevant together with the underling volatility of the revenues (risk proxy measurement)
                                          Leverage ratio measures the samething of coverage, but over different time horizons (long term), hence
                                          it is complementary to the first
                                          Solvency is not critical, besides for financial distress prospective
                              The Credit spread doesn’t increase linearly according to the default probability, in fact there is much more differ-
                               ence in the default probability between BBB and B than between AAA and BBB
                              Another approach to value rating is the market based one, it consists on extrapolate from the current price the im-
                               plied risk, instead of computing the firm ratios. This methodologies is a nice measure because consider all the in-
                               formation, but it is sensible to short term fluctuation
              o Cash flow analysis is the best one to understand the specific needs of the own business in terms of flexibility and robustness
    For any capital adjustment on the short term Management is facingasignal problem and a transaction cost, the first one is difficult to esti-
    mate, while the second is clear since it is an explicit cost
              o Commonly the higher transaction cost is associated with the IPO, followed by SEO, Bond convertible and bond.
              o The signal problem is the typical reaction of the market to management action, besides any other consideration:
                              Dividend cut is a really strong negative signal, so any change in the dividend policy must be carefully taken
                              Issuing equity is taken as an executives’ belief about overvaluation of stock price
                              Issuing debt gives less negatively signal
                              Redeemingexcess fund is controversial, it is a positive signal because the company is able to produce extra cash,
                               but it could the case of losing future benefit due to lack of investment opportunity
                              Share repurchase is a better choice if the management doesn’t want a long term commitment and furthermore this
                               strategy do not force the investors to choose between capital gains or dividends
                              Debt repayment have different drawback the market will think that stock are overvalue (otherwise the company
                               should have buy it), that future cash flow are not enough to repay debt or a lack of investment opportunity. It is dif-
                               ferent in the case of financial distress, in this situation it is a positive signal
                              Increase dividend must be undertaken consciously, any increase must be sustainable (long term commitment). In
                               general it is viewed as positive by investors, however can be a signal for future low return (less Investment)
    Business plan must represent all the Management issues regarding the long term horizon, hence it should determine:
              o At first we have to estimate the surplus and deficit, and this is crucial, in fact CFO spend more time on it to grant enough
                   flexibility and robustness
              o Estimate expected operating and investment cash flow, so that is possible to plan the requirement of capital for the capital
                   expenditure and acquisition
              o Analyze exposure to business risk to understand any possible fluctuation to assess the robustness requirement
              o Make assumption on unexpected investment opportunity, to assess the flexibility
              o Project as-if financing surplus or deficit assuming not changing structure
              o Set target capital structure, management help themselves with setting controlling ratio, (enforce them if there are any cove-
                   nants on past debt). It must follow the business cycle
              o Decide the tactical measure to implement in order to move toward the target (short term tactics)
    Create value from financial engineering
              o Derivate instruments can transfer some risk to a third party, but management must be aware of their complexity and they
                   have to avoid error
              o Off balance sheet is a good instrument to raise fund without affecting the balance sheet outlook, however the market is
                   aware of it, hence it must be used to create special vehicles to boost or securities asset to receive debt
              o Hybrid financing like convertible bond must be understand by management, in fact given up ownership for a low coupon can
                   be a misleading strategy

How to implement value enhancing strategies and how to ensure management to recognize them:

When we have recognized some possible initiatives we need to assess a proper internal management organizational scheme to implement them.
We need to work simultaneously on the governance, compensation and market relationship side. At first we will describe an innovative gover-
nance scheme proposed by McKinsey to deal with increasing complexity then we will reconcile governance with compensation, enlarging our
discussion to market linked instruments. The second section is entirely dedicated on Market information stream both from a management pros-
pective (how to deal with investors and how to avoid mistake) and from an investors one (try to understand the stock price movements)


                                                                                                                                                    8
Giulio Laudani                #27                                                                                                                                         Cod. 20137
Governance& compensation scheme
Firms have to face continuously with decision, trade off and operational issue on how to value performance and consequently decide how to al-
locate resources. Therefore is crucial to definea new approach which works on several variables:
     It is crucial for a company to ensure that all decision affecting value are consistent with objectives, to ensure thisit is important to develop a
     reliable management performance system to see clearly the impact of those decisions
     The ultimate solution proposed by McKensey is Value Managerwhich is an useful tool to make easier the decision process in case of trade
     off, helpingin defining priority among actions and in setting priorities (ensuringmulti-dimensional improvements) and to better allocate time
     resource, in fact 40% of time resource is dedicated to this task, and moreover one of the main role of the CFO is to properly implement
     those performance measurement ; this situation has been steam up by a greater external pressure/scrutiny on companies and by the in-
     creasing business complexity
     Choose the right metrics to ensure value creation and organizational health:
                 o First of all we should identifying value drivers by dividing from internal (controllable) factor and those who are external (take
                       as given) and by focusing on the first one:
                                Short term driver are: sales (market share, price premium), operating cost and capital (working capital) productivity
                                 index/ratio
                                Medium-t: Commercial (brand, pipeline, customer satisfaction), cost structure (ability to have to manage its cost
                                 relative to competitors) and asset health
                                Long term: define and measure the opportunities and the threats it is a more qualitative milestones
                                                                       11                                                         12
                 o Secondly develop a value drivers tree diagram to increase the company insight (be company specific ); we can assess the
                       difference by characteristic, ROIC-growth profile, so that it is possible to understand where company is doing well and where
                       not. To create BU we need to identify:
                                The overhead cost to be allocate in the center cost units which must be value separately:
                                            To properly compare BU with peer that don’t have those cost
                                            To assess how much resources are dragged by overhead
                                Do not off-set internal transactions, but rather left them in the FCF
                                The BU’s debt cost, in case of miss reconciliation allocate the difference as a corporate item
                                The BU’s NOPLAT and IC and reconcile them with the company’s one
                 o Thirdly we need to ensure the ability of the company of retaining valuable human resource by providing a good work envi-
                       ronment (value, satisfaction)
                 o Lastly chose effective targets, that need to be both realistic and challenging
                                Use benchmark from competitors or other cells/ Business units parameters, often senior executives will bench-
                                 mark performance not against BU’s peer, but rather to other BU within the firm, even if they have different fea-
                                 tures
                                Set range is better than single point by dividing the target in base and in stretch one
     Organizational support for corrective action:
                 o Buy-in to performance managementat all levels:it means to involve all management level by enforcing the perception of
                       value creation in all the communications, link value creation with reward process
                 o Properly define target, be specific (explain interrelation) and motivating
                                                         13
                 o Fact-based performancereviews : using more than financial report to make decision, use brain storming or meeting to dis-
                       cuss of the problem to better inform all the parts

The compensation is a crucial element, highly linked with Organizational and Governance. We are going to describe the TRS relation with salary.
At first we need to address that short term movement are meaningless, and that there exists a possible distortion in using TRS, which is the
treadmill.
      Management shouldn’t pay attention on short term movement, as a general rule management should start to be worry for any movement
      greater than 2% daily or 10% quarterly not justified by peers’ co-movement
      Market expectation translates themselves into value creation and can easily become a treadmill, which means that successful company al-
      ready discount extremely future positive return, so it becomes really hard to further improve those expectations, and (hence) the market
      price. An appropriate rewardwill aim to long term/sustainable growth pursuing :
           o Stock based stripping out broad macro or industry effects
           o Postpone bonus compensation
           o Long term company health metricslike ROIC, Growth measure relative to peers


11
   The higher is the disaggregation the better, under those simple rules: Each cells should be enough big to be independent and should not share too many activity or link (limited synergy)
with other cells
12
   By branch, by division/geographical area, by custom types
13
   It’s common practice to use scorecards, since they allow fast and easy comparison between units, however it is important to address the unique characteristic of each units
                                                                                                                                                                                          9
Giulio Laudani               #27                                                                                                                                     Cod. 20137
            o     Use more holist system, less math
            o     Harnessing the power of non-financial incentives like career progression
            o     Understand the market expectation to properly set up stock linked compensation to overcome the treadmill problems, thus fru-
                  strating the management


Information gave by the market and managerialimplication
Now we will speak about the relation between stock price and their intrinsic value. At first we will understand the source of TRS by decompos-
ing it, using two possible ways:
      The traditional decomposition defines the TRS as the linear summation of % increase in earnings, % change in P/E and dividend yield. This
      methodology has three limits:
                  o Not all type of earnings lead to value creation
                  o The dividend yield can be increased without affecting future earnings, just modifying the payout ratio
                  o It doesn’t consider the financial leverage of the company
                                                                                                                                 14
      The McKinsey approach consists on breaking down the TRS into 4 parts, it will allow management to have a better insight :
                  o Value generating from revenue growth net of capital required to sustain that grow
                  o What TRS would have been without the growth part
                  o Change in P/E or other earnings multiple between period
                  o The impact of leverage on TRS
      It isn’t always a good measure of intrinsic value; however it has been proven by many papers the existence of the relationship between key
      value drivers and stock price, thus TRS
                  o ROICstrong relationship
                  o Growth high relations only for company with a positive ROIC spread, the higher the higher the impact of g
                  o Expectationinitial expectation plays a big role in assessing the TRS, and any change in expectation has big market effect
                  o There are empirical evidences of the existence of long term reversal and short term momentum. The first one is a direct con-
                       sequence of overreaction, while the second of under reaction. However there is no evidence against efficiency, in fact those
                                                                                                                         15
                       movements are unpredictable; hence the abnormal return of these strategies is still close to zero
                  o For company with low growth could be hard/impossible to recognize the ROIC contribution by using earnings multiple (com-
                       mon practice), hence it is suggest to use capital multiples


                        As we can see the earnings multiple is rescaled by the return ratio

Now we will dedicate ourselves on defining why market efficiency is important and how it is granted. It is possible to speak of efficiency since
on the long run the stock market follow underling valuation/criterions; this is allowed by the presence of informed investor which has the highest
long-t influence.
      Efficiency in the market will ensure that market price stays linked to ROIC and growth rate measures. There are several surveys to show the
      strong relation between ROIC spread and stock return, this is strong proof on the fact that the noise component usually creates distortion
      only in the short term.
      They can be classified into three classes:Intrinsic investor rigorous due diligence, they drive stock price; Traders bet on short term
      movements, they don’t have any view on the stock; &Mechanical investors use math to develop models or replicate index. Those class
      of investor look at whatdrives the stock value
      As a general rule Management should keep in mind that substance always prevails on form; hence either management or technical trading
      artificial policy don’t allow any excess return:
                  o On Managers’ side- the attitude to use account to manage earning doesn’t have any effect on the valuation
                                 Smooth or less volatile earnings don’t provide any extra return
                                 Treatment of goodwill doesn’t show any market impact, the market totally anticipated the decision and the lower
                                  benefits
                                 Different accounting standard doesn’t lead to different values (inventory, stock option, ...)
                  o On Technical trading side- those factors are irrelevant
                                 The decision of be traded in more the one stock doesn’t grant any extra return, however it isn’t true for emerging
                                  country firm, which will have a benefit of being listed in a more liquid market
                                 Belonging in an index doesn’t give any extra return (there is a small evidence of a positive trend) and be delisted
                                  doesn’t affect long term return

14
   The growth component (first one) is computed as the increase of earnings, this measure minus the period investment gave us the Growth of TRS from performance. The zero-growth
component is the past earnings over past equity value (it is a return). The multiple contribution is a short term benefit a company cannot increase TRS by exploiting this variable
15
  If management is aware of any deviation it is rational to expect to see them to implement tactics to exploit those deviations by repurchasing program.
                                                                                                                                                                                  10
Giulio Laudani                   #27                                                                                                                                        Cod. 20137
                                  Stock Split has a positive impact due to the positive signal impact, the management is confident of future perfor-
                                   mance, and this operation reduce the capital constrain, furthermore this operation is the consequence of past posi-
                                   tive performance
         In same eras/case some situation can bring the market to systematically trade far away from intrinsic value: small free float, or any kind of
         barriers which is lowering the market efficiency.
                   o The emotion and mispricing in the market are rare and not long lasting; they are caused by the predominance of irrationali-
                        ty from some individuals or group of investors.
                                  Long term Reversal may be due to investor overreaction on good news
                                  Momentum may be explain by some friction in the market, meaning investors are slow to correct their valuation
                   o The market will give too much attention on last result, overvaluing the last industry develops
                   o There is an intrinsic market asymmetry which reduces efficiency. Short position are much riskier than long one, hence there
                                                                                                                      16
                        is less corrective trade on the negative side, furthermore there exist limit on short selling

What information is important to know what to be sent to the market and which doesn’t?Any significant gap between intrinsic value and stock
price is a disadvantage to all the company’s stakeholders: too high valuation can lead to short term tactics aiming to maintain that unsustainable
level, while too low can reduce morale and create concern in the board.
Management from big corporation usually react to this problem by spending lots of time dealing with investors with an ad hoc way, but it is
highly suggested to implement systematic approach, so that the management can communicate better and in a less time consuming mode.
There are three areas in the communication field to be addressed:
     Understand if there is any discrepancy with the market communication, what are the market beliefs and implicit forecasting assump-
     tions.Often the executive doesn’t have a clear touch with reality, in fact they may not aware that their company is already valued at an high
     premium and the implied hp are incredibly aggressive or maybe they don’t understand that their hp are considered over optimistic by the
     market that is adopting a waiting strategy (they want numbers)
     Understand the investor base and focus the communication to each category. A common fallacy believed by executive is that they can
     change their price by marketing to different categories of investors, this is not the true
     Taylor the communication to those who mostly determine the stock price, which are intrinsic investor, they are not interested in short term
     tactics, but only in long term strategy
                                                                                                                                                17
                o Transparency is being a must in the principle for accounting, but there is a big room for decision regarding disclosure
                               The management should be honest on their communication, any “deviation” won’t last long, moreover the compa-
                                ny may gain to be transparent showing their project, it is like showing confidence on their strategy and the incapa-
                                bility of the competitor to replicate it
                               Since intrinsic investors are sophisticated, company should give more detailed information avoiding aggregate data,
                                as a rule of dumb they should disclosure for each business units down to the level of earnings before tax
                               Final note: Sometimes successful firms doesn’t disclosure their plan, exploiting their success as long as it lasts & Use
                                the same metric from quarter to quarter, avoid any kind of account magic
                o Guidance on future business evolution are useful, but there are some comments:
                               EPS evolution is not a good guidance; sophisticated investor doesn’t look at these numbers. Firms doesn’t suffer
                                any loss when they stop to communicate EPS evolution and doesn’t gain any extra earnings premium (paper)
                               Guidance on the short, median a long term on value driver are highly suggested, so that the investors can make
                                their valuation


16
      The so-called noisy trader risk, big short sell may hamper the efficiency the market favoring irrational behavior
17
     In some business like commodity is more important to disclosure production data not the revenue one, since the last oneis influenced by external factor (better dealt by investors)
                                                                                                                                                                                           11
Giulio Laudani                #27                                                                                                                                         Cod. 20137

Valuation methodologies are based on several variants:
Some general statements on valuation:A valuation isn’t an objective search of “true” value; in fact all valuations are biased. The only questionis
how much and in which direction; we can assess that the direction and the magnitude are directly proportional to whom is paying and how much
they are paying you. Hence, there isn’t any good valuation even if valuation models are quantitative, actually it is not true that the more quanti-
tative a model, the better the valuation: One’s understanding of a valuation model is inversely proportional to the number of inputs required
for the model, that’s why Simpler valuation models do much better than complex ones.Any kind of research, no matter how good they are, is
affected by firm-specific as well as market wide information and it will age quickly as new information is available. There exist five well known
            18
frameworks : enterprise DCF value, equity cash flow, economic profit, APV and Capital cash flow. In theory, each framework will generate the
same value. In practice, the ease of implementation and the interpretation of results the betterIt is suggested the first one.

DCF Model

DCF is the most accurate and the most flexible method for valuing project, division or companies. It requires four elements: WACC, OFCF, Con-
tinuing value and non-operating asset valuation. Here we will discuss about all the estimation issues and some suggestion on how set up a prop-
er framework to judge all possible issues.


WACC Estimation:

WACC will be used to discount the cash flow and it represents the cost of capital computed as the blended rate of return for all sources of capi-
                                                                                                          19
tal, specifically debt & equity. When performing Enterprise DCF, make sure to choose the cash flows and discount factor consistently. Since free
cash flows are the cash flows available to all investors, the discount factor for free cash flow must represent the risk faced by all investors
      To estimate the cost of equity, we must determine the expected rate of return of the company’s stock. Since expected rates of return are
      unobservable, we rely on asset-pricing models that translate risk into expected return.The three most common asset-pricing models differ
      primarily in how defining risk factors.
                 o The capital assets pricing model (CAPM) states that a stock’s expected return is driven by how sensitive its returns are to the
                      market portfolio. This sensitivity is measured using a term known as “beta.”
                 o The Fama-French three-factor model defines risk as a stock’s sensitivity to three portfolios: the stock market, a portfolio
                      based on firm size, and a portfolio based on book-to-market ratios.
                 o The Arbitrage Pricing Theory (APT) is a generalized multi-factor model, but unfortunately provides no guidance on the ap-
                      propriate factors that drive returns.
      To Estimate the cost of debt (kd) we need to check:
                 o If the firm trades bonds in the market and those bonds are liquid we can compute the implicit yield to maturity (YTM), in fact
                      although YTM represents a promised yield, it is a good approximation for expected return for investment grade companies.
                 o In the other case we will compute the yield-to-maturity indirectly by adding a default premium (based on company’s rating)
                      to the risk free.Yield to maturity is not an expected return. It is the return earned if the obligation is paid on time and in full.
                                                                                         20
                      Since distressed companies have a significant chance of default , the yield-to-maturity is a poor proxy for expected return.In
                      order to be compensated for default risk, lenders charge a premium over the default-free benchmark rate to risky custom-
                         21
                      ers .
                                Regardless of the maturity structure for the company’s debt, use a long-term risk free rate when estimating a com-
                                 pany’s cost of capital. Using short-term debt yields ignores the fact that future debt will have different yields
                                                                                    22
                 o One alternative for computing expected return is the CAPM . Since most bonds don’t trade enough to generate a reliable
                      beta, however, we can compute index betas instead
                 o The tax shield can simply be computed (1-t) as proxy
      To develop a target capital structure for a company:
                 o Estimate the company’s current market-value-based capital structure, if the company is not listed used an iterated formula
                 o Review the capital structure of comparable companies to place the company’s current capital structure in the proper context
                                Industries with heavy fixed investment in tangible assets tend to have higher debt levels.
                                High-growth industries, especially those with intangible investments, tend to use very little debt.


18
   A distinction between models: you can either value the cash flows generated by the company’s economic assets, or value each financial claim separately (debt & equity)
19
  It must be denominated in the same currency as free cash flow and in nominal terms when cash flows are stated in nominal terms; basically if any risk it is accounted in the numerator
the risk premium associated to that risk must be eliminated from the denominator
20
  Professional firms, such as S&P and Moody’s, rate the default risk of most bonds, Once a bond rating has been identified, convert the rating into a yield to maturity
21
  The higher the chance of default, the higher the premium will be.
22
  Empirical paper shows that high yield debt has only a slightly higher beta than investment grade debt, as an example if the market risk premium equals 5%; this difference translates to
only a 50 basis point differential in expected return!
                                                                                                                                                                                        12
Giulio Laudani        #27                                                                                                               Cod. 20137
             o     Review management’s implicit or explicit hp on how financing the business and on its implications for the targeted capital
                   structure.
   However, a time-varying WACC is appropriate if (1) the yield curve is sharply increasing or decreasing or (2) if significant changes are ex-
   pected in any of the following: the capital market weights for debt and equity, the cost of debt or the tax rate. For complex capital structure
   is better to specifically model the tax shield with an APV model


OFCF Estimation:
       1.   The second step in DCF is to forecast the Operating cash flow byforecasting each balance items, however before doing that we
            need to collect and rearrange/understand info
            o When analyzing historical performance, keep the following in mind:
                           Look back as far as possible (at least 10 years). Long term horizons will allow you to evaluate company and industry
                            trends and whether short-term trends will likely be permanent
                           Disaggregate value drivers, both ROIC and revenue growth, as far back as possible. If possible, link operational per-
                            formance measures with each key value driver.
                           Identify the source, when there are radical changes in performance. Determine whether the change is temporary
                            or permanent, or merely an accounting effect.
            o Understanding a company’s past is essential to forecast its future. Using historical analysis or analyzingoperating and financial
                 trends, we can test ifthe company is able to create value over time and to compete effectively within the company’s industry
            o A good historical analysis will focus on the drivers of value: return on invested capital (ROIC) and growth. ROIC and growth
                 drive free cash flow, which is the basis for enterprise value.
                           Rearranging the accounting statements,
                           Digging for new information in the footnotes,
                           Making informed assumptions where needed
            o Before you begin forecasting individual line items, you must determine how many years to be forecasted and how detailed
                 your forecast should be. [as a general rules]
                           A detailed 5 to 7year forecast, which develops complete balance sheets and income statements with as many links
                            to real variables (e.g., unit volumes, cost per unit), the explicit forecast period must be enough long to reach a
                            steady state, defined by the following characteristics
                                        The company grows at a constant rate and reinvests a constant proportion of its operating profits into the
                                        business each year.
                                        The company earns a constant rate of return on new capital invested.
                                        The company earns a constant return on its base level of invested capital.
                                        In general, we recommend using an explicit forecast period of 10 to 15 years perhaps longer for cyclical
                                        companies or those experiencing very rapid growth
                                        Using a short explicit forecast period, such as 5 years, typically results in a significant undervaluation of a
                                        company or requires heroic long-term growth assumptions in the continuing value
                           Sometimes above the detail forecast it is added asimplified forecast,which is focused on few important variables,
                            such as revenue growth, margins, and capital turnover, if we believe on company’s higher growth compared to the
                            terminal value hp
                           Value the Terminal years by using a perpetuity-based formula, such as the key value driver formula
            o At first we should find the NOPLAT and Invested capital from the historical trend, so that we will have an insight on the com-
                 pany performance. Usually account measure are not reliable:
                           ROE mixes operating performance with capital structure, making peer group analysis and trend analysis less mea-
                            ningful. ROE rises with leverage if ROIC is greater than the after-tax cost of debt.
                           ROA measures the numerator and denominator inconsistently (even when profit is computed on a pre-interest ba-
                            sis). For instance, ROA double counts implicit financing charged by suppliers – in the numerator as part of COGS and
                            in the denominator as part of total assets.
            o The valuation spreadsheet can easily become complex. Therefore, you need to design and structure your model before start-
                 ing to forecast, here there is a possible scheme to be followed:
                           Prepare and analyze historical financials. Before forecasting future financials, you must build and analyze historical
                            financials. In many cases, reported financials are overly simplistic. When this occurs, you have to rebuild financial
                            statements with the right balance of detail.


                                                                                                                                                   13
Giulio Laudani                 #27                                                                                                                                              Cod. 20137
                                                                           23
                                 Build the revenue forecast . Almost every line item will rely directly or indirectly on revenue. You can estimate fu-
                                  ture revenue by using either a top-down (market-based) or bottom-up (customer-based) approach. Forecasts
                                  should be consistent with historical evidence on growth.
                                 Forecast the income statement. Use the appropriate economic drivers to forecast operating expenses, deprecia-
                                  tion, interest income, interest expense, and reported taxes.
                                 Forecast the balance sheet: invested capital and non-operating assets. On the balance sheet, forecast operating
                                  working capital, net property, plant, & equipment, goodwill, and non-operating assets.
                                 Forecast the balance sheet: investor funds. Complete the balance sheet by computing retained earnings and fore-
                                  casting other equity accounts. Use cash and/or debt accounts to balance the cash flows and balance sheet.
                                 Calculate ROIC and FCF. Calculate ROIC to assure forecasts are consistent with economic principles, industry dy-
                                  namics, and the company’s competitive advantage. To complete the forecast, calculate free cash flow as the basis
                                  for valuation. Future FCF should be calculated the same way as historical FCF.
            2.     From this information we will compute the projection for the futurecash flow.
                   o One critical component of financial forecasting is your estimate of revenue growth, as almost every line item will rely directly
                       or indirectly on revenue, so any error in the revenue forecast will be carried through the entire model.
                                 You can estimate revenue using either a top-down (market-based) or bottom-up (customer-based) approach
                                             Extend short-term revenue forecasts to long-term
                                             Estimate new customer wins and turnover
                                             Project demand from existing customers
                                             Estimate market share and pricing strength based on competition and competitive advantage
                                             Estimate quantity and pricing of aggregate worldwide market
                   o With a revenue forecast in place, next forecast will be the individual line items related to the income statement. To forecast
                       a line item, use a three-step process:
                                 Decide what economically drives the line item. For most line items, forecasts will be tied directly to revenue.
                                 Estimate the forecast ratio. Since cost of goods sold is tied to revenue, estimate COGS as a percentage of revenue.
                                 Multiply the forecast ratio by an estimate of its driver. For instance, since most line items are driven by revenue,
                                  most forecast ratios, such as COGS to revenue, should be applied to estimate the needed variable.
                                 When forecasting balance sheet items, use the stock method. The relationship between balance sheet accounts
                                                                   24
                                  and revenue (the stock method ) is more stable than that between balance sheet change and change in revenues
                                                     25
                                  (the flow method ).
                   o The last five line items: excess cash, short-term debt, long-term debt, a new account titled newly issued debt, and common
                       stock. Some combination of these line items must make the balance sheet balance. For this reason, these items are often re-
                       ferred to as “the plug.” Simple models use newly issued debt as the plug, while advanced models use excess cash or newly is-
                       sued debt, to prevent debt from becoming negative.
                                 Step 1: Determine retained earnings using the clean surplus relation, forecast existing debt using contractual
                                  terms, and keep equity constant.
                                 Step 2: Test which is higher, assets excluding excess cash or liabilities and equity, excluding newly issued debt.


      23
          To ground our historical analysis, we need to separate operating performance from non-operating items and the financing to support the business. To prevent non-operating
       items and capital structure from distorting the company’s operating performance, we must reorganize the financial statements following this rules:
                    o      NOPLAT. The income statement will be reorganized to create NOPLAT, which represents the after-tax operating profit available to all financial investors.
                                        If the company has no tax credits, operating taxes can be computed by multiplying the adjusted EBITA by the tax rate
                                        If the company has tax credits, multiplying operating profits by statutory tax rate will overstate the company’s tax burden. In this case, start with re-
                                         ported taxes and remove any taxes related to non-operating items and financial structure
                                        Many financial analysts prefer to compute NOPLAT using cash taxes and treat deferred tax accounts as equity equivalents. To do this, computed re-
                                         ported operating taxes and subtract the increase in deferred tax liabilities
                    o      Capitalizing R&D If a company has significant long-term R&D, do not subtract the annual R&D expense. Instead, capitalize R&D on the balance sheet and sub-
                           tract an annualized amortization of this capitalized R&D.
                    o      Capitalizing Operating Leases If a company has significant operating leases, capitalized the operating lease on the balance sheet and adds back lease-based in-
                           terest to operating profit. Convert the remaining rental expense to depreciation.
                    o      Excluding Recognized Pension Gains & Losses. Pension gains & losses booked on the income statement are usually hidden within cost of goods sold. Remove
                           any recognized gains or losses from NOPLAT. Unrecognized gains do not flow through the income statement, so no change is required for unrecognized gains.
                    o      Invested Capital. The balance sheet will be reorganized to create invested capital, which equals the total capital required to fund operations, regardless of type
                           (debt or equity).
                    o      The reported tax rate can be misleading because companies can defer certain taxes for many years. In fact, a growing profitable company could defer a portion
                           of its taxes forever! Deferred taxes arise for a number of situations including:
                                        Accelerated depreciation schedules
                                        Pension accounting
                                        Goodwill amortization
24
   Basically compute the line as a % of the revenue (direct method)
25
   Basically compute the change of the items as a % of the & of the revenues over time (indirect method)
                                                                                                                                                                                              14
Giulio Laudani       #27                                                                                                            Cod. 20137
                           Step 3: If assets excluding excess cash are higher, set excess cash equal to zero and plug the difference with newly
                            issued debt. Otherwise, plug with excess cash.
       3.   When forecasting you are likely to come across three additional issues:
            o Nonfinancial operating drivers. In industries where prices or technology are changing dramatically, your forecast should in-
                 corporate operating drivers like volume and productivity.
                           Consider the airline industry, where labor and fuel has been rising as a percentage of revenue– but for different
                            reasons. Fuel is a greater percentage because oil prices have been rising. Conversely, labor is a greater percentage
                            because revenue per seat mile has been dropping.
            o Currency Changes. Foreign revenues must be consolidated into domestic financial statements. If foreign currencies are rising
                 in value relative to the company’s home currency, this translation, at better rates, will lead to higher revenue.
            o Changes in accounting policies. When a company changes its revenue recognition policies, comparing year-to-year revenue
                 can be misleading (examples provided in slides)
            o Fixed versus variable costs. The distinction between fixed and variable costs at the company level is usually unimportant be-
                 cause most costs are variable. For individual production facilities or retail stores, this is not the case, most costs are fixed.
            o Inflation. Often, the cost of capital is estimated using nominal terms. If this is the case, forecast in nominal terms. Be careful,
                 however, high inflation will distort historical analyses.
       4.   Estimate a Continuing/terminal Value by forecasting cash flows in the long-term future, using a perpetuity that focuses on the
            company’s key value drivers, specifically ROIC and growth. A thoughtful estimate of continuing value is essential to any valuation
            because continuing value often accounts for a large percentage of a company’s total value. 56% to 125% of total value.
            o Although many continuing-value models exist, we prefer the key value driver model. The key value driver formula is superior
                 to alternative methodologies because it is based on cash flow and links cash flow to growth and ROIC


                                           If RONIC=WACC
                    Continuing value can be highly sensitive to changes in the continuing value parameters
                    While the length of the explicit forecast period you choose is important, it does not affect the value of the company; it
                     only affects the distribution of the company’s value between the explicit forecast period and the years that follow
                    In the formula, if you assume RONIC equals WACC. It implies that new projects don’t create value and existing projects
                     continue to perform at their base-year level.
                    By computing alternative approaches, we can generate insight into the timing of cash flows, where value is created
                     (across business units), or even how value is created (derived from invested capital or future economic profits).
                    Regardless of the method chosen, the resulting valuation should be the same
       o    Other Methods:
                    Liquidation Value and Replacement Cost Liquidation values and replacement costs are usually far different from the
                     value of the company as a going concern. In a growing, profitable industry, a company’s liquidation value is probably
                     well below the going-concern value.
                    Exit Multiples (such as P/E and EV/EBITA) Multiples approaches assume that a company will be worth some multiple of
                     future earnings or book value in the continuing period. But multiples from today’s industry can be misleading. Industry
                     economics will change over time and so will their multiples!
       o    A common error in forecasting the base level of FCF is to assume a constant re-investment rate, which impliesthat NOPLAT, in-
            vestment, and FCF will grow at the same rate
                    The assumption that RONIC equals WACC is often faulty because strong brands, plants and other human capital can
                     generate economic profits for sustained periods of time, as is the case for pharmaceutical companies, consumer prod-
                     ucts companies and some software companies.
                    Many analysts’ errors are due to excessive caution when estimating continuing value because of uncertainty, but to of-
                     fer an unbiased estimate of value, use the best estimate available. The risk of uncertainty will already be captured by
                     the weighted average cost of capital.An effective alternative to revising estimates downward is to model uncertainty
                     with scenarios and then examine their impact on valuation
                    Several estimation approaches are available, but recommended models (such as the key value driver and economic prof-
                     it models) explicitly consider:
                                Profits at the end of the explicit forecast period - NOPLATt+1
                                The rate of return for new investment projects - RONIC
                                Expected long-run growth - g
                                Cost of capital - WACC
                     A large continuing value does not necessarily imply a noisy valuation. Other methods, such as business components and
                      economic profit can provide meaningful perspective on how aggressive (or conservative) the continuing value is.

                                                                                                                                               15
Schema cf
Schema cf
Schema cf
Schema cf
Schema cf
Schema cf
Schema cf
Schema cf
Schema cf
Schema cf
Schema cf
Schema cf

More Related Content

What's hot

Ernst & Young - Competing for growth
Ernst & Young - Competing for growthErnst & Young - Competing for growth
Ernst & Young - Competing for growthLaura Hodges
 
Entry Strategy for New Entry Exploitation
Entry Strategy for New Entry ExploitationEntry Strategy for New Entry Exploitation
Entry Strategy for New Entry Exploitationfariha chaudhary
 
Generic strategy & competative advantage
Generic strategy & competative advantageGeneric strategy & competative advantage
Generic strategy & competative advantageiipmff2
 
Article The Strategy Accelerator - Which businessmodels and strategies are va...
Article The Strategy Accelerator - Which businessmodels and strategies are va...Article The Strategy Accelerator - Which businessmodels and strategies are va...
Article The Strategy Accelerator - Which businessmodels and strategies are va...Alfred Griffioen
 
MNC funds & Opportunity and Special Situations funds : Are they worth a look?
MNC funds & Opportunity and Special Situations funds : Are they worth a look?MNC funds & Opportunity and Special Situations funds : Are they worth a look?
MNC funds & Opportunity and Special Situations funds : Are they worth a look?Dhuraivel Gunasekaran
 
10 principles of monetary brand valuation
10 principles of monetary brand valuation10 principles of monetary brand valuation
10 principles of monetary brand valuationamitbbidaye
 
Marketing strategy india inc.
Marketing strategy india inc.Marketing strategy india inc.
Marketing strategy india inc.Naveen Sarpal ✔
 
Chemical Compounds Q2 2010
Chemical Compounds Q2 2010Chemical Compounds Q2 2010
Chemical Compounds Q2 2010gaffneysean
 
STRATEGIES FOR MANAGING TODAYS BUSINESS
STRATEGIES FOR MANAGING TODAYS BUSINESSSTRATEGIES FOR MANAGING TODAYS BUSINESS
STRATEGIES FOR MANAGING TODAYS BUSINESSInayatkhan Bihari
 

What's hot (14)

Ernst & Young - Competing for growth
Ernst & Young - Competing for growthErnst & Young - Competing for growth
Ernst & Young - Competing for growth
 
Ey Competing For Growth
Ey Competing For GrowthEy Competing For Growth
Ey Competing For Growth
 
Entry Strategy for New Entry Exploitation
Entry Strategy for New Entry ExploitationEntry Strategy for New Entry Exploitation
Entry Strategy for New Entry Exploitation
 
SKM
SKM SKM
SKM
 
Enews 09-28-06
Enews 09-28-06Enews 09-28-06
Enews 09-28-06
 
ADIT C
ADIT CADIT C
ADIT C
 
Generic strategy & competative advantage
Generic strategy & competative advantageGeneric strategy & competative advantage
Generic strategy & competative advantage
 
Article The Strategy Accelerator - Which businessmodels and strategies are va...
Article The Strategy Accelerator - Which businessmodels and strategies are va...Article The Strategy Accelerator - Which businessmodels and strategies are va...
Article The Strategy Accelerator - Which businessmodels and strategies are va...
 
MNC funds & Opportunity and Special Situations funds : Are they worth a look?
MNC funds & Opportunity and Special Situations funds : Are they worth a look?MNC funds & Opportunity and Special Situations funds : Are they worth a look?
MNC funds & Opportunity and Special Situations funds : Are they worth a look?
 
10 principles of monetary brand valuation
10 principles of monetary brand valuation10 principles of monetary brand valuation
10 principles of monetary brand valuation
 
Marketing strategy india inc.
Marketing strategy india inc.Marketing strategy india inc.
Marketing strategy india inc.
 
Ch007
Ch007Ch007
Ch007
 
Chemical Compounds Q2 2010
Chemical Compounds Q2 2010Chemical Compounds Q2 2010
Chemical Compounds Q2 2010
 
STRATEGIES FOR MANAGING TODAYS BUSINESS
STRATEGIES FOR MANAGING TODAYS BUSINESSSTRATEGIES FOR MANAGING TODAYS BUSINESS
STRATEGIES FOR MANAGING TODAYS BUSINESS
 

Viewers also liked

1. understanding the financial markets
1. understanding the financial markets1. understanding the financial markets
1. understanding the financial marketsrealsharetraders
 
CDS and Loss function: CDO Tranches
CDS and Loss function: CDO TranchesCDS and Loss function: CDO Tranches
CDS and Loss function: CDO TranchesBank Industry
 
Community participaion community participation1
Community participaion community participation1Community participaion community participation1
Community participaion community participation1Subramaniam Jeyachandran
 
Final fathimanew[1]
Final fathimanew[1]Final fathimanew[1]
Final fathimanew[1]Rohina Banu
 
Innovation & Creativity - Innovation Hotspots & The Six Thinking Hats
Innovation & Creativity - Innovation Hotspots & The Six Thinking HatsInnovation & Creativity - Innovation Hotspots & The Six Thinking Hats
Innovation & Creativity - Innovation Hotspots & The Six Thinking HatsShubhada Jambhekar
 
2011년 KTH H3 컨퍼런스 Track B, 세션4 "Advanced Git" by A.J
2011년 KTH H3 컨퍼런스 Track B, 세션4 "Advanced Git" by A.J2011년 KTH H3 컨퍼런스 Track B, 세션4 "Advanced Git" by A.J
2011년 KTH H3 컨퍼런스 Track B, 세션4 "Advanced Git" by A.JAndrew J. Kim
 
Animal Bioacoustics by Steve Sens
Animal Bioacoustics by Steve SensAnimal Bioacoustics by Steve Sens
Animal Bioacoustics by Steve SensCDPUG
 
Making Joyful Noise With Your Computer For Fun and Profit
Making Joyful Noise With Your Computer For Fun and ProfitMaking Joyful Noise With Your Computer For Fun and Profit
Making Joyful Noise With Your Computer For Fun and ProfitCDPUG
 
On The Prophet
On The  ProphetOn The  Prophet
On The Prophethakimose
 

Viewers also liked (18)

1. understanding the financial markets
1. understanding the financial markets1. understanding the financial markets
1. understanding the financial markets
 
CDS and Loss function: CDO Tranches
CDS and Loss function: CDO TranchesCDS and Loss function: CDO Tranches
CDS and Loss function: CDO Tranches
 
Margrabe option
Margrabe optionMargrabe option
Margrabe option
 
IELTS Vocabulary 2
IELTS Vocabulary 2IELTS Vocabulary 2
IELTS Vocabulary 2
 
Schema fr
Schema frSchema fr
Schema fr
 
Community participaion community participation1
Community participaion community participation1Community participaion community participation1
Community participaion community participation1
 
Schema econ ii
Schema econ iiSchema econ ii
Schema econ ii
 
Riassunto risk
Riassunto riskRiassunto risk
Riassunto risk
 
Final fathimanew[1]
Final fathimanew[1]Final fathimanew[1]
Final fathimanew[1]
 
Innovation & Creativity - Innovation Hotspots & The Six Thinking Hats
Innovation & Creativity - Innovation Hotspots & The Six Thinking HatsInnovation & Creativity - Innovation Hotspots & The Six Thinking Hats
Innovation & Creativity - Innovation Hotspots & The Six Thinking Hats
 
Video Games Market
Video Games MarketVideo Games Market
Video Games Market
 
network storage
network storagenetwork storage
network storage
 
Business Ideas for Housewives
Business Ideas for HousewivesBusiness Ideas for Housewives
Business Ideas for Housewives
 
IELTS Vocabulary 1
IELTS Vocabulary 1IELTS Vocabulary 1
IELTS Vocabulary 1
 
2011년 KTH H3 컨퍼런스 Track B, 세션4 "Advanced Git" by A.J
2011년 KTH H3 컨퍼런스 Track B, 세션4 "Advanced Git" by A.J2011년 KTH H3 컨퍼런스 Track B, 세션4 "Advanced Git" by A.J
2011년 KTH H3 컨퍼런스 Track B, 세션4 "Advanced Git" by A.J
 
Animal Bioacoustics by Steve Sens
Animal Bioacoustics by Steve SensAnimal Bioacoustics by Steve Sens
Animal Bioacoustics by Steve Sens
 
Making Joyful Noise With Your Computer For Fun and Profit
Making Joyful Noise With Your Computer For Fun and ProfitMaking Joyful Noise With Your Computer For Fun and Profit
Making Joyful Noise With Your Computer For Fun and Profit
 
On The Prophet
On The  ProphetOn The  Prophet
On The Prophet
 

Similar to Schema cf

Phea ch.06(seminar 08.08.2017)
Phea ch.06(seminar 08.08.2017)Phea ch.06(seminar 08.08.2017)
Phea ch.06(seminar 08.08.2017)DavinMon
 
A note on Mergers & Acquisitions.pdf
A note on Mergers & Acquisitions.pdfA note on Mergers & Acquisitions.pdf
A note on Mergers & Acquisitions.pdfSachinGhodke7
 
Week 4 Discussion_ BUS 599A Rotten Apple  Please respond.docx
Week 4 Discussion_ BUS 599A Rotten Apple  Please respond.docxWeek 4 Discussion_ BUS 599A Rotten Apple  Please respond.docx
Week 4 Discussion_ BUS 599A Rotten Apple  Please respond.docxcockekeshia
 
Chapter2 strategyandcapitalallocation
Chapter2 strategyandcapitalallocationChapter2 strategyandcapitalallocation
Chapter2 strategyandcapitalallocationAKSHAYA0000
 
Barrier to entryThe government intervention to the barriers to en.pdf
Barrier to entryThe government intervention to the barriers to en.pdfBarrier to entryThe government intervention to the barriers to en.pdf
Barrier to entryThe government intervention to the barriers to en.pdfinbox5
 
Tools of Mergers and Acquisitions.pdf
Tools of  Mergers and Acquisitions.pdfTools of  Mergers and Acquisitions.pdf
Tools of Mergers and Acquisitions.pdfMaithriPRao
 
CROSS BORDER M&A AND COPERATE RESTRUCTURING
CROSS BORDER M&A AND COPERATE RESTRUCTURINGCROSS BORDER M&A AND COPERATE RESTRUCTURING
CROSS BORDER M&A AND COPERATE RESTRUCTURINGAjeesh Mk
 
Based on everything you know then, what is Bezos singular grand s.docx
Based on everything you know then, what is Bezos singular grand s.docxBased on everything you know then, what is Bezos singular grand s.docx
Based on everything you know then, what is Bezos singular grand s.docxikirkton
 
Chemical companies in india
Chemical companies in indiaChemical companies in india
Chemical companies in indiaZahidmmm
 
Pricing Seminar Speaker Notes April 2013
Pricing Seminar Speaker Notes   April 2013Pricing Seminar Speaker Notes   April 2013
Pricing Seminar Speaker Notes April 2013Dave Litwiller
 
Imperatives for market driven strategy
Imperatives for market driven strategyImperatives for market driven strategy
Imperatives for market driven strategyraju07a
 
Cost Management A Strategic Emphasis 8th Edition Blocher Solutions Manual
Cost Management A Strategic Emphasis 8th Edition Blocher Solutions ManualCost Management A Strategic Emphasis 8th Edition Blocher Solutions Manual
Cost Management A Strategic Emphasis 8th Edition Blocher Solutions ManualAyannaban
 
STRATEGIC COST MANAGEMENT-TOPIC 5 (1).ppt
STRATEGIC COST MANAGEMENT-TOPIC 5 (1).pptSTRATEGIC COST MANAGEMENT-TOPIC 5 (1).ppt
STRATEGIC COST MANAGEMENT-TOPIC 5 (1).pptRenvic
 
Strategic Management:Business Level Strategies, Corporate level Analysis,
Strategic Management:Business Level Strategies, Corporate level Analysis,Strategic Management:Business Level Strategies, Corporate level Analysis,
Strategic Management:Business Level Strategies, Corporate level Analysis,Kishor Deka
 

Similar to Schema cf (20)

Phea ch.06(seminar 08.08.2017)
Phea ch.06(seminar 08.08.2017)Phea ch.06(seminar 08.08.2017)
Phea ch.06(seminar 08.08.2017)
 
A note on Mergers & Acquisitions.pdf
A note on Mergers & Acquisitions.pdfA note on Mergers & Acquisitions.pdf
A note on Mergers & Acquisitions.pdf
 
Week 4 Discussion_ BUS 599A Rotten Apple  Please respond.docx
Week 4 Discussion_ BUS 599A Rotten Apple  Please respond.docxWeek 4 Discussion_ BUS 599A Rotten Apple  Please respond.docx
Week 4 Discussion_ BUS 599A Rotten Apple  Please respond.docx
 
Chapter2 strategyandcapitalallocation
Chapter2 strategyandcapitalallocationChapter2 strategyandcapitalallocation
Chapter2 strategyandcapitalallocation
 
Barrier to entryThe government intervention to the barriers to en.pdf
Barrier to entryThe government intervention to the barriers to en.pdfBarrier to entryThe government intervention to the barriers to en.pdf
Barrier to entryThe government intervention to the barriers to en.pdf
 
Tools of Mergers and Acquisitions.pdf
Tools of  Mergers and Acquisitions.pdfTools of  Mergers and Acquisitions.pdf
Tools of Mergers and Acquisitions.pdf
 
Operations strategy
Operations strategyOperations strategy
Operations strategy
 
CROSS BORDER M&A AND COPERATE RESTRUCTURING
CROSS BORDER M&A AND COPERATE RESTRUCTURINGCROSS BORDER M&A AND COPERATE RESTRUCTURING
CROSS BORDER M&A AND COPERATE RESTRUCTURING
 
Based on everything you know then, what is Bezos singular grand s.docx
Based on everything you know then, what is Bezos singular grand s.docxBased on everything you know then, what is Bezos singular grand s.docx
Based on everything you know then, what is Bezos singular grand s.docx
 
mergers and acquisitions
 mergers and acquisitions  mergers and acquisitions
mergers and acquisitions
 
Chemical companies in india
Chemical companies in indiaChemical companies in india
Chemical companies in india
 
27022
2702227022
27022
 
27022
2702227022
27022
 
Pricing Seminar Speaker Notes April 2013
Pricing Seminar Speaker Notes   April 2013Pricing Seminar Speaker Notes   April 2013
Pricing Seminar Speaker Notes April 2013
 
Imperatives for market driven strategy
Imperatives for market driven strategyImperatives for market driven strategy
Imperatives for market driven strategy
 
Cost Management A Strategic Emphasis 8th Edition Blocher Solutions Manual
Cost Management A Strategic Emphasis 8th Edition Blocher Solutions ManualCost Management A Strategic Emphasis 8th Edition Blocher Solutions Manual
Cost Management A Strategic Emphasis 8th Edition Blocher Solutions Manual
 
The Northpoint Value Stack
The Northpoint Value StackThe Northpoint Value Stack
The Northpoint Value Stack
 
STRATEGIC COST MANAGEMENT-TOPIC 5 (1).ppt
STRATEGIC COST MANAGEMENT-TOPIC 5 (1).pptSTRATEGIC COST MANAGEMENT-TOPIC 5 (1).ppt
STRATEGIC COST MANAGEMENT-TOPIC 5 (1).ppt
 
Strategic Management:Business Level Strategies, Corporate level Analysis,
Strategic Management:Business Level Strategies, Corporate level Analysis,Strategic Management:Business Level Strategies, Corporate level Analysis,
Strategic Management:Business Level Strategies, Corporate level Analysis,
 
Bs 9arr
Bs 9arrBs 9arr
Bs 9arr
 

Recently uploaded

Ensure the security of your HCL environment by applying the Zero Trust princi...
Ensure the security of your HCL environment by applying the Zero Trust princi...Ensure the security of your HCL environment by applying the Zero Trust princi...
Ensure the security of your HCL environment by applying the Zero Trust princi...Roland Driesen
 
Russian Faridabad Call Girls(Badarpur) : ☎ 8168257667, @4999
Russian Faridabad Call Girls(Badarpur) : ☎ 8168257667, @4999Russian Faridabad Call Girls(Badarpur) : ☎ 8168257667, @4999
Russian Faridabad Call Girls(Badarpur) : ☎ 8168257667, @4999Tina Ji
 
Sales & Marketing Alignment: How to Synergize for Success
Sales & Marketing Alignment: How to Synergize for SuccessSales & Marketing Alignment: How to Synergize for Success
Sales & Marketing Alignment: How to Synergize for SuccessAggregage
 
Enhancing and Restoring Safety & Quality Cultures - Dave Litwiller - May 2024...
Enhancing and Restoring Safety & Quality Cultures - Dave Litwiller - May 2024...Enhancing and Restoring Safety & Quality Cultures - Dave Litwiller - May 2024...
Enhancing and Restoring Safety & Quality Cultures - Dave Litwiller - May 2024...Dave Litwiller
 
GD Birla and his contribution in management
GD Birla and his contribution in managementGD Birla and his contribution in management
GD Birla and his contribution in managementchhavia330
 
0183760ssssssssssssssssssssssssssss00101011 (27).pdf
0183760ssssssssssssssssssssssssssss00101011 (27).pdf0183760ssssssssssssssssssssssssssss00101011 (27).pdf
0183760ssssssssssssssssssssssssssss00101011 (27).pdfRenandantas16
 
Grateful 7 speech thanking everyone that has helped.pdf
Grateful 7 speech thanking everyone that has helped.pdfGrateful 7 speech thanking everyone that has helped.pdf
Grateful 7 speech thanking everyone that has helped.pdfPaul Menig
 
Catalogue ONG NƯỚC uPVC - HDPE DE NHAT.pdf
Catalogue ONG NƯỚC uPVC - HDPE DE NHAT.pdfCatalogue ONG NƯỚC uPVC - HDPE DE NHAT.pdf
Catalogue ONG NƯỚC uPVC - HDPE DE NHAT.pdfOrient Homes
 
Socio-economic-Impact-of-business-consumers-suppliers-and.pptx
Socio-economic-Impact-of-business-consumers-suppliers-and.pptxSocio-economic-Impact-of-business-consumers-suppliers-and.pptx
Socio-economic-Impact-of-business-consumers-suppliers-and.pptxtrishalcan8
 
MONA 98765-12871 CALL GIRLS IN LUDHIANA LUDHIANA CALL GIRL
MONA 98765-12871 CALL GIRLS IN LUDHIANA LUDHIANA CALL GIRLMONA 98765-12871 CALL GIRLS IN LUDHIANA LUDHIANA CALL GIRL
MONA 98765-12871 CALL GIRLS IN LUDHIANA LUDHIANA CALL GIRLSeo
 
Catalogue ONG NUOC PPR DE NHAT .pdf
Catalogue ONG NUOC PPR DE NHAT      .pdfCatalogue ONG NUOC PPR DE NHAT      .pdf
Catalogue ONG NUOC PPR DE NHAT .pdfOrient Homes
 
Insurers' journeys to build a mastery in the IoT usage
Insurers' journeys to build a mastery in the IoT usageInsurers' journeys to build a mastery in the IoT usage
Insurers' journeys to build a mastery in the IoT usageMatteo Carbone
 
Keppel Ltd. 1Q 2024 Business Update Presentation Slides
Keppel Ltd. 1Q 2024 Business Update  Presentation SlidesKeppel Ltd. 1Q 2024 Business Update  Presentation Slides
Keppel Ltd. 1Q 2024 Business Update Presentation SlidesKeppelCorporation
 
Mysore Call Girls 8617370543 WhatsApp Number 24x7 Best Services
Mysore Call Girls 8617370543 WhatsApp Number 24x7 Best ServicesMysore Call Girls 8617370543 WhatsApp Number 24x7 Best Services
Mysore Call Girls 8617370543 WhatsApp Number 24x7 Best ServicesDipal Arora
 
The CMO Survey - Highlights and Insights Report - Spring 2024
The CMO Survey - Highlights and Insights Report - Spring 2024The CMO Survey - Highlights and Insights Report - Spring 2024
The CMO Survey - Highlights and Insights Report - Spring 2024christinemoorman
 
Lucknow 💋 Escorts in Lucknow - 450+ Call Girl Cash Payment 8923113531 Neha Th...
Lucknow 💋 Escorts in Lucknow - 450+ Call Girl Cash Payment 8923113531 Neha Th...Lucknow 💋 Escorts in Lucknow - 450+ Call Girl Cash Payment 8923113531 Neha Th...
Lucknow 💋 Escorts in Lucknow - 450+ Call Girl Cash Payment 8923113531 Neha Th...anilsa9823
 
VIP Call Girls In Saharaganj ( Lucknow ) 🔝 8923113531 🔝 Cash Payment (COD) 👒
VIP Call Girls In Saharaganj ( Lucknow  ) 🔝 8923113531 🔝  Cash Payment (COD) 👒VIP Call Girls In Saharaganj ( Lucknow  ) 🔝 8923113531 🔝  Cash Payment (COD) 👒
VIP Call Girls In Saharaganj ( Lucknow ) 🔝 8923113531 🔝 Cash Payment (COD) 👒anilsa9823
 

Recently uploaded (20)

Ensure the security of your HCL environment by applying the Zero Trust princi...
Ensure the security of your HCL environment by applying the Zero Trust princi...Ensure the security of your HCL environment by applying the Zero Trust princi...
Ensure the security of your HCL environment by applying the Zero Trust princi...
 
Russian Faridabad Call Girls(Badarpur) : ☎ 8168257667, @4999
Russian Faridabad Call Girls(Badarpur) : ☎ 8168257667, @4999Russian Faridabad Call Girls(Badarpur) : ☎ 8168257667, @4999
Russian Faridabad Call Girls(Badarpur) : ☎ 8168257667, @4999
 
Sales & Marketing Alignment: How to Synergize for Success
Sales & Marketing Alignment: How to Synergize for SuccessSales & Marketing Alignment: How to Synergize for Success
Sales & Marketing Alignment: How to Synergize for Success
 
Enhancing and Restoring Safety & Quality Cultures - Dave Litwiller - May 2024...
Enhancing and Restoring Safety & Quality Cultures - Dave Litwiller - May 2024...Enhancing and Restoring Safety & Quality Cultures - Dave Litwiller - May 2024...
Enhancing and Restoring Safety & Quality Cultures - Dave Litwiller - May 2024...
 
GD Birla and his contribution in management
GD Birla and his contribution in managementGD Birla and his contribution in management
GD Birla and his contribution in management
 
0183760ssssssssssssssssssssssssssss00101011 (27).pdf
0183760ssssssssssssssssssssssssssss00101011 (27).pdf0183760ssssssssssssssssssssssssssss00101011 (27).pdf
0183760ssssssssssssssssssssssssssss00101011 (27).pdf
 
Grateful 7 speech thanking everyone that has helped.pdf
Grateful 7 speech thanking everyone that has helped.pdfGrateful 7 speech thanking everyone that has helped.pdf
Grateful 7 speech thanking everyone that has helped.pdf
 
Catalogue ONG NƯỚC uPVC - HDPE DE NHAT.pdf
Catalogue ONG NƯỚC uPVC - HDPE DE NHAT.pdfCatalogue ONG NƯỚC uPVC - HDPE DE NHAT.pdf
Catalogue ONG NƯỚC uPVC - HDPE DE NHAT.pdf
 
Socio-economic-Impact-of-business-consumers-suppliers-and.pptx
Socio-economic-Impact-of-business-consumers-suppliers-and.pptxSocio-economic-Impact-of-business-consumers-suppliers-and.pptx
Socio-economic-Impact-of-business-consumers-suppliers-and.pptx
 
MONA 98765-12871 CALL GIRLS IN LUDHIANA LUDHIANA CALL GIRL
MONA 98765-12871 CALL GIRLS IN LUDHIANA LUDHIANA CALL GIRLMONA 98765-12871 CALL GIRLS IN LUDHIANA LUDHIANA CALL GIRL
MONA 98765-12871 CALL GIRLS IN LUDHIANA LUDHIANA CALL GIRL
 
Catalogue ONG NUOC PPR DE NHAT .pdf
Catalogue ONG NUOC PPR DE NHAT      .pdfCatalogue ONG NUOC PPR DE NHAT      .pdf
Catalogue ONG NUOC PPR DE NHAT .pdf
 
Nepali Escort Girl Kakori \ 9548273370 Indian Call Girls Service Lucknow ₹,9517
Nepali Escort Girl Kakori \ 9548273370 Indian Call Girls Service Lucknow ₹,9517Nepali Escort Girl Kakori \ 9548273370 Indian Call Girls Service Lucknow ₹,9517
Nepali Escort Girl Kakori \ 9548273370 Indian Call Girls Service Lucknow ₹,9517
 
Insurers' journeys to build a mastery in the IoT usage
Insurers' journeys to build a mastery in the IoT usageInsurers' journeys to build a mastery in the IoT usage
Insurers' journeys to build a mastery in the IoT usage
 
Keppel Ltd. 1Q 2024 Business Update Presentation Slides
Keppel Ltd. 1Q 2024 Business Update  Presentation SlidesKeppel Ltd. 1Q 2024 Business Update  Presentation Slides
Keppel Ltd. 1Q 2024 Business Update Presentation Slides
 
Mysore Call Girls 8617370543 WhatsApp Number 24x7 Best Services
Mysore Call Girls 8617370543 WhatsApp Number 24x7 Best ServicesMysore Call Girls 8617370543 WhatsApp Number 24x7 Best Services
Mysore Call Girls 8617370543 WhatsApp Number 24x7 Best Services
 
The CMO Survey - Highlights and Insights Report - Spring 2024
The CMO Survey - Highlights and Insights Report - Spring 2024The CMO Survey - Highlights and Insights Report - Spring 2024
The CMO Survey - Highlights and Insights Report - Spring 2024
 
Lucknow 💋 Escorts in Lucknow - 450+ Call Girl Cash Payment 8923113531 Neha Th...
Lucknow 💋 Escorts in Lucknow - 450+ Call Girl Cash Payment 8923113531 Neha Th...Lucknow 💋 Escorts in Lucknow - 450+ Call Girl Cash Payment 8923113531 Neha Th...
Lucknow 💋 Escorts in Lucknow - 450+ Call Girl Cash Payment 8923113531 Neha Th...
 
Forklift Operations: Safety through Cartoons
Forklift Operations: Safety through CartoonsForklift Operations: Safety through Cartoons
Forklift Operations: Safety through Cartoons
 
VIP Call Girls In Saharaganj ( Lucknow ) 🔝 8923113531 🔝 Cash Payment (COD) 👒
VIP Call Girls In Saharaganj ( Lucknow  ) 🔝 8923113531 🔝  Cash Payment (COD) 👒VIP Call Girls In Saharaganj ( Lucknow  ) 🔝 8923113531 🔝  Cash Payment (COD) 👒
VIP Call Girls In Saharaganj ( Lucknow ) 🔝 8923113531 🔝 Cash Payment (COD) 👒
 
Best Practices for Implementing an External Recruiting Partnership
Best Practices for Implementing an External Recruiting PartnershipBest Practices for Implementing an External Recruiting Partnership
Best Practices for Implementing an External Recruiting Partnership
 

Schema cf

  • 1. Giulio Laudani #27 Cod. 20137 Corporate Finance General concept on Value and its implication: ____________________________________________________ 1 Understand the company positioning in the market ________________________________________________________ 1 What we need to do to boost value creation: ______________________________________________________________ 4 The cycle of business and the perfect owner theory ____________________________________________________________________ 4 M&A Transaction _______________________________________________________________________________________________ 5 Disinvest from business __________________________________________________________________________________________ 6 Capital structure ________________________________________________________________________________________________ 7 How to implement value enhancing strategies and how to ensure management to recognize them: _________________ 8 Governance & compensation scheme _______________________________________________________________________________ 9 Information gave by the market and managerial implication ____________________________________________________________ 10 Valuation methodologies are based on several variants: ___________________________________________ 12 DCF Model _________________________________________________________________________________________ 12 WACC Estimation: ______________________________________________________________________________________________ 12 OFCF Estimation: _______________________________________________________________________________________________ 13 Final remark and ending procedure ________________________________________________________________________________ 18 The CAPM approach needs: ______________________________________________________________________________________ 19 Multiples model _____________________________________________________________________________________ 20 Economic Profit (EVA) Model __________________________________________________________________________ 23 APV Model: ________________________________________________________________________________________ 23 Equity DCF Model [Used for banks]:_____________________________________________________________________ 23 Special valuation case: _______________________________________________________________________________ 24 Emerging market valuation: ______________________________________________________________________________________ 24 High growth industry ____________________________________________________________________________________________ 25 Cyclical industry valuation both from a managerial prospective and a financial one __________________________________________ 25 Bank industry __________________________________________________________________________________________________ 25 Insurers: ______________________________________________________________________________________________________ 26 General concept on Value and its implication: Value is a broad measure well expressed by cash flow trend, and it reassumes the healthiness of a company, since itrepresents the interest of all the stakeholders, granting prosperity to all the community/business. Furthermore it is a long time measureused to assess fundamental driver for stock price and it is not biased by short term deviation which are consequence of bubbles. Measure of value creation,expressing the- 1 firms’competitive advantage, are ROIC spread and Growth . There is a direct link between future cash flow and competitive advantage, the higher the second the higher will be the first. This relation is the reason behind the value reasoning, in fact increasing value is equal to ask the business to increase its competitive advantage.The investment rate is given by it clearly shows the relationship between cash flow and value Understand the company positioning in the market The first task to be performed when valuing a firm is to define if there is any competitive advantage and itsweakness and strength compared to benchmark peers and their cause. We could implement several models/scheme to properly address the value sources: The first three to be presented are qualitative models and they are focus on understanding the positioning of the firms’ goods (the first), the firm’market placementwith a dynamic approach(the second one) while the last one is a qualitative representation on where the com- petitive advantage has been manifested:  The Porter Model outline the mixtures of internal and external factor to define profitability: 1. The less intense is the rivalry in its industry the better, higher margin are possible; 2. The less danger of potential entrants& the higher the barriers to entry;the higher is theretentions of extra profit o Tangible barriers – anything that would put a potential entrant at a competitive disadvantage after entryi.e. 1 Note that an higher growth is positive only in the case of a positive spread between ROIC and WACC otherwise the company will increase the value destruction, however investing in growth will lower the ROIC, since the marginal value contribution of new added project will decrease as well [many companies decide to not invest due to the fear of decreasing their ROIC] 1
  • 2. Giulio Laudani #27 Cod. 20137  Scale-based cost advantages, scope-based cost advantages: when fixed costs can be shared among different products,  Knowledge-based cost advantages: when experience is an important factor in knowing how to do things efficiently,  Financial resources: when firms are able to fight off new entrants by cutting prices as a result of hav- ing significant financial resources available,  Favored access to particular resources: when existing firms control resources that are useful or es- sential to efficient operation (For example, airlines may control landing slots at favorable times.),  Favored access to distribution channels: when existing firms can more easily reach the customers  Customer goodwill and reputation: when a firm has built up a loyal customer base, but new en- trants have to win those loyal customers away or convince new customers who were not buying the product to do so  Customer lock-in: when customers tend to continue with the original firm because of issues such as compatibility with existing equipment, economies in maintenance & repair, etc.  Legal & political restrictions: when firms are protected against entry by legal restrictions such as government certification or licenses (Existing firms may also encourage the government to ban for- eign competitors from entering the industry.) o Psychological barriers – beliefs on the part of potential entrants that, if they enter, firms already in the busi- ness will react aggressively, and are even willing to incur short-term losses, to force out the new entrant  Fighting offan entrant or two is one way for a firm to gain a reputation for being willing & able to fight off new entrants.  Maintaining excess capacity for production or distribution  Keeping patents & products on the shelf ready for use if needed can also send a strong signal 3. Theless numerous and less aggressive the firms that sell substitute products, and the more numerous and more ag- gressive the firms that sell complementary products; o If there are many good substitutes for a product, the elasticity of demand for that product will be high. This will limit the ability of the firm to raise prices and will consequently lower potential profits. 4. The weaker the bargaining power of clients/customers; o The client industry is highly concentrated. (The firms buying the product are in an industry in which there are just a few companies and they are large.) o One particular client industry buys a very large share of the products o The item is not essential to the clients; there are lots of possible substitute in the clients’ production process. o The cost of the item is a large fraction of the clients’ costs/budget. The client is then likely to resist attempts to push up prices. 5. The weaker the bargaining power of suppliers o The supplier has a franchise or patent on a particular item that is required by firms in the industry. o The supplier is not restrained by any clause substitutes for its product. o The supplier industry is concentrated and the firms are not aggressive rivals with each other  Another technique to represent the competitive positioning is the SWOT analysis: It divides the success mixture in internal factor: Strength and weakness: related to brand, management or any other va- riables related to the goods or firms’ business model And those who are external: Opportunities and threats, such as geographical barrier, market evolution or any variables related to macro change in the society/ countries  Consequence and reasons of the presence of competitive advantage is measured by the firm's profitability: it can be above or be- low the industry average. This is a consequence of: Price premium side:  Innovative product are difficult to copy or are protected by patent  Quality: the customer are willing to pay more for a better goods  Brand: differently to quality the costumer are willing to pay more even if there is no quality difference  Client lock-in: clients are unable or unwilling to change goods Cost and capital efficiency side: o Innovative business method: hard to be copy since it isn’t directly observable o Unique resource, Economies of scale o Scalable product: any new clients have a low margin cost (common in IT industry) The higher profitability can be preserved in the long term only if it is sustainable Other possible schemes to be use are those inside the quantitative family. These models consist of computing specific value driver measure, which are ROIC and Growth: 2
  • 3. Giulio Laudani #27 Cod. 20137 o High ROIC companies should search for higher growth, and the opposite strategy should be pursued by low or negative ROIC- WACC spread companies, those companiesshould operate on their efficiency and value creation before looking to growth  We should reorganized the financial statements in effort to have a clean measure of total invested capital and its related after-tax operating income, needed to compute ROIC  To better understand ROIC, we can decompose the ratio as follows As the formula demonstrates, a company’s ROIC is driven by its ability to (1) maximize profitability, (2) optimize capital efficiency, or (3) minimize taxes We can further decompose ROIC as much as we want, if you are working inside a company or if the com- pany releases operating data, you should link operating drivers directly to ROIC. All this work will give you 2 a better insight  It is hard to retain for long period high level of ROIC. There are several empirical research to demonstrate those trends divided by company quintile ROIC is easier to preserve than growth rate by continuing introducing new product and by pursuing inno- vation, there is an empirical evidence that best player will be able to preserve those advantages Any goods portfolio will go toward a common base line after tot years Every sector has a typical average ROIC level, however there is a large range within the same sector and the difference among industries Nowadays the trends are positive for Health care equipment and Aerospace defense, while it is trending down for Auto, Tracking, Advertisement and health care facilities Size do not matter o Organic Growth can be pursueby introducing new product, expanding the market share,while the inorganic one by acquisi- tion, all of them show a marginal decreasing value contribution  The ability to grow cash flows over the long-term depends on a company’s ability to organically grow its revenues Calculating revenue growth directly from the income statement will suffice for most companies. However the year-to-year revenue growth numbers sometimes can be misleading. It is also useful to decompose the Growth rate using the information on the business characteristic to as- sess subunits/divisions expectation  Growth compared to ROIC is harder to sustain, even if both ultimately depends on the underling product’s life cycle, since market dimension is caped and mature growth rate is basicallythe economic underling. Hence, the three prime culprits affecting revenue growth are: 3 Introduce new product: higher value creation but longer and harder to implement; Expand the market size:it can be made by attracting new customers or by pushing the existing one to buy more Increase its own market share: it isn’t a long term strategy, any movement in the market will trigger a reaction form the competitors. It is a winner strategy only for big players which are bale to force out smaller competitors entirely Mergers and Acquisitions. When one company purchases another, the bidding company may not restate historical financial statements;this will bias one-year growth rates upwards. There could be two types o Bolt-on wherethe bidder will acquire small business to increase its portfolio or filling gap distri- bution channel o Large acquisition where the bidder try to acquire same size business, those strategy shows poorer value creation and are focus only on the cost side, revenue do not increase  It is hard to grow since the base level on which growth it’s computed increase over time, hence the firms should in- troduce new products at an increasing rate. Some empirical papers show: Big company has lower growth High “g” business will rapidly loss power There is an higher dispersion value in the market than ROIC Business tends to grow at an higher rate than home economy due to: o Based sample(public company are better than other) o Growth is usually carry out in other economy o Outsourcing strategy do not increase GDP, but business in that high specialized sector will grow 2 We can desegregate by units, by division, by stores, which can be divided in # transaction and in amountof transaction, where # transaction by square feet/store and transaction/store 3 However this measure doesn’t account of the risk of the project, there is no risk correction [fuzzy comparison] 3
  • 4. Giulio Laudani #27 Cod. 20137 The last angle to be understand, besides the value/competitive advantage side, is theintrinsic riskbeard by the company, since future cash flow are affected by the strategies that have granted to achieve those market positioning(any policy aiming to enhance this units will in- crease both the cash flow, but even the risk/volatility of these flows). o Companies must decide between the tradeoff of bearing too high risk (survivorship is challenged) and higher profit/margin, and theymust internally decide which risk is going to be hedged, considering the marginal cost against its benefit, which are granted by the more favorable market judgment on more stable cash flow o To understand if the business is sustainable, to assess the aggressiveness of a company’s capital structure, we examine:  Liquidity – the ability to meet short-term obligations. We measure liquidity by examining the interest coverage ra- tio defines as: EBITDA / interest measures the ability to meet short-term financial commitments using both profits, as well as depreciation dollars earmarked for replacement capital. EBITA / interest ratio measures the ability to pay interest without having to cut expenditures intended to replace depreciating equipment.  Leverage – the ability to meet long-term obligations. Leverage is measured by computing the market-based debt- to-value ratio The use of leverage magnifies the effect of operating performance. Specifically, with a high leverage ratio (a very steep line), the smallest change in operating performance, can lead to enormous changes in ROE The higher the leverage ratio (IC/E), the greater the risk, since fixed asset are financed by redeemable What we need to do to boost valu e creation: After understating the firm’s competitive advantage and market positioning we should study how to Boost value creation, we should aim to solve the weakness discovered in the preliminary phase to increase either ROIC or Growth depending on their relative value. We will speak about the perfect owner theory which will allow us to understand how properly run a business by identifying when we need to reallocate/allocate re- sources and how to set up a proper capital structure depending on the business’s life cycle . The cycle of business and the perfect owner theory The scope of this theory is to explain and justified how ownership matter in creating value. The main idea is that any goods/business has a life cycle and each of these phases should be run by a specific type of shareholder/management. Hence the best owner is not static, it is dynamic moving from large institution to venture capital: First phases are suitable for founder to stimu- late entrepreneurship, When the company starts to develop there will be the entrance of angel or venture, providing more capital and mana- gerial skills; Go public to rise more money, and create governance control to align managers interest with investors; Go in M&A or fusion to in- crease in size & Go in private equity transaction to reconstructing or refocusing the business Executive have to think about their business as a portfolio of different asset, where any of them have an economic cycle, so to obtain the maximum value they need to be managed using specific skills that can provided by specific owners’ class, such as: o Unique links with other business o Distinctive skills (managerial or functional) o Better governance, for a specific time there is the best business form o Better insight and foresight (be able to capitalize on innovation) o Influence on critical stakeholder (it is crucial in emerging market) 4 Hence, the correct approach is to create a corporate strategic team focus on constructingthe perfect portfolio by : o Determining the market value of the company as whole and comparing it by the management expectation to see if there ex- ist any gap o Identifying and valuing new opportunityinternally o Evaluating if it is the case to disinvest form some business o Identifying potential acquisition or other initiatives; the best investment for high performing management is usually a com- pany in a financial distress or poor return o Value how much the company may gain from a changing in the capital structure The tool used to maximize the value creation are: M&A, Disinvestment and capital structure strategiesled by this theory 4 Remember that the diversification for a company is not a source of value, investor can do the same with lower cost, and hence conglomerate strategy doesn’t add value. the management doesn’t have confidence to properly finance the different business to anticipate cycle and they don’t use their more stable cash flow to increase leverage compared to their peers, moreo- ver the different division usually performs less than standing alone business line due to lack of focus 4
  • 5. Giulio Laudani #27 Cod. 20137 M&A Transaction M&A are an important element in a dynamic economy, in fact it is the best (and sometimes the only) way to sensibly reallocate resources. M&A aims to create value both for the whole economy and for the investors; in fact better ownership is more probable to increase the profitability of the business itself.Since Value “amount” creation in M&A is not sure and it must be share between the bidder and the target and the usual pay- ment methods consists of an up-front premium payment to the target by the bidder, we can easily assess that this value distribution is favoring 5 the target shareholders . M&A deal shows some peculiar features: theyhappen in waves[a pre signal the beginning of the phase is the lowering of the interest rate, allowing big leverage buyout]; Favorable elements to the bidder are: if the acquirer has strong performance, low transaction premium and being the sole bidder helps. There are some myths on success or failing: size relative to target, accounting magic (like change in EPS dilution) and the relationship between SIC code of the players. There are several possible value source in the M&A transaction, they can be classified as synergy and control one, here there is a list: o Improving the target performance by working on possible improvement on the revenue side either by reducing cost or by managing the company more efficiently o Consolidate or remove excess capacity from the market (even less tangible like reducing sale force, not only factories) o Create market access to geographical area (sometimes it is a prerequisite) o Acquire new technologies more quickly and cheaper than develop them internally o Roll up strategy, when a business as a group can realize substantial cost savings or achieve higher revenue than the individual o Consolidate to improve competitor behavior, meaning create oligopoly, which is hard both because of country legislation against monopoly and because of the difficulty bear by companies to avoid new entrance in the market o Enter into a transformational merger, to totally modifying the underlying business, refocusing the business o Buy cheap business in down economy and restructuring them o Pick winnersearly and develop them, by exploit the so called cash slap problem, meaning bigger company have more availa- ble cash to be implemented in costly project retain by the target who cannot implement them due to cash constrain o Tax benefits (loss on the target or specific benefits that cannot be exploit by the actual owner, or by write up asset, increas- ing future depreciation) together with all the other financial benefits: Lower capital cost, Better capital structure and Differ- ent seasoning evolution [use of internal cash flow] The synergy component is estimated by looking after possible operating and financial improvements (higher cash flow or lower discount rate) achievable only thanks to the merger with an industrial partner. o Estimating cost saving must be structured using a disciplined methodologies, meaning we should allocate any improvement to a specific items, being clear and focus on how to achieve it. It is crucial to involve the experienced line management, and to compare the combined result with the comparable benchmark to avoid unrealistic plan o Estimating revenue improvement must consider the possible loss of clients and value manger in the operation and the pos- sibility to incur in additional cost to uniform the business model. Be explicit about where any revenue growth is going to be obtained. This estimation is harder o EstimatingFinancial synergies is worked out by trying to assess the ex-post firm structure, valuing the additional value o A final comment on the implementation and timing:  It is important to understand that any value source are not be on the table forever after the merger, hence it is cru- cial to capture all of it as soon as possible  The M&A transaction must be led by a detailed plan to be implemented at day one  Empirical result shows that companies are quite good in assessing the cost saving, while they are too optimistic on the revenue improvement side The control component is related to the possibility to increase value by properly/efficiently manage the business, this kind of value is totally linked to the target own business and should be paid entirely to the target. How to value this lack of efficiency: o At first we should estimate the as-usual value (business run by the old management).Then we will perform another valuation assuming to solve all the inefficiency, the difference (if any) with the base value is the control value o A final comment on the implementation of this strategy:Even if it is an “easy task” to improve management efficiency it is rare/hard to run an M&A transaction lead by this motivation, since the target management will strongly react against this operation and it’s not obvious that target shareholder will accept the bidder offer, so since the legislation on defensive tactics is quite open it is hard to run hostile takeover, unfortunately this is a decrement for the wholeeconomy (lack of value en- hancement) There are different ways to pay, each of those present different advantage and disadvantage: 6 o Cash payment [assuming no financial constrain for the buyer] can result in a lower premium compared with stock one and can testify the bidder’s confidence on the deal, since in case of future loss (due to misleading valuation) there is no possible ex post correction on the price paid, furthermorethere is a tax issue since the old investor must paid tax on capital gain 5 Proved by empirical results which demonstrate that the winner part is always the target (however the overall aggregated value is higher than before) 6 Do not do this for high growth companies 5
  • 6. Giulio Laudani #27 Cod. 20137 o Stock payment (the Bidder will exchange own stock (newly issued) with those of the Target one) is a little bit more expensive, but there is the sharing of risk, so if you are not confident enough confident this method is the better, otherwise cash. o There are other mean of payments to solve specific problems:  Vendor loan: sometimes Bidder doesn’t have enough resource (multimedia case), hence the Target can help by providing a loan (usually really cheap condition)  Convertible: it is a compromise between cash and equity 7  Earn-out : it is more complicated and it is a sort of postponed payment related to the Target performance without issuing equity. It is a good compromise The Target will lock in a base value, and will participate in the upper side The transaction can be speed up thanks to this clause 8 The parties must decide how will be settled the compensation and the measurements of performance It is possible to hedge this risk by using a collaroption to avoid downside by forgo the upper side. This may be good for the Target to reduce the volatility  Squeeze-out: the option to force minority with less 5% if the OPA reach 95% to sell  Sell-outright: sell the reaming 10% at the same condition o Some final comments  The concept of accretive: it is a misleading one and it doesn’t put in evidence the economic ratio behind the lower market multiple of the target (something must be wrong), that problem can drop the bidder value down, or by the presence of some distortion on the P/E  The synergy sharing process depends on the bargain power of the bidder (the synergy can be achieve only by him) on the offer typology (private placement or auction) and on relative dimension Defensive tactics allowed for Target are country/area specific. There is the conflict of two principles: the efficiency of the market and the protection of national or valuable situation. In EU the new Takeover bid clearly define which tactics can be implement by Targets and Bid- ders, here there is a list of the most famous and used one: o White knights the Target will ask to another firm, which is consider friendly, to bid for the transaction o Golden parachute or silver one the Target grants to top management big compensation in case of hostile takeover, this rules is usually set to protect executive that will be fire after the transaction o Poison pillow the board will issue new stock at discount to increase the cost for the Bidder o Crown jewel the Target will sell all the valuable asset to other and will cash out o Labor agreements  they can hamper the Bidder possibility to effectively change production Disinvest from business Even if divestures create value and there are several empirical evidence that companies employing balanced portfolio approach perform better than companies that rarely disinvest, this procedure is undergo only due to external pressure not for a proactive program, and tends to happen in wave as M&A, and nowadays public ownership transaction has become the principal mean for disinvesting. This behavior is mainly due to two circumstance: The management typical adverse perception of divesture due to the general idea that disinvest means failing, furthermore reduc- ing the size of the company is a negative prospective for Executive salary and maybe difficult to find an alternative investment, in fact either 1)holding cash will lower the performance, or 2)repaying debt will be the same of invest at the debt cost, which is usually by far lower than asset return or 3)buying back stock can be problematic as well since the market can react negatively (the company doesn’t have future project) However this strategy allows companies to create value form these sources of value: o Disinvest form a underperforming business avoids the direct costs of bearing deteriorating results o The subsidiary can be morecompetitive or better managed under other ownership o There is the possibility to take advantage of asymmetric information o The possibility to focus on the core business o Problems solved by divesture:  There could be the case of an incompatible culture or of a possible conflict of interest with the subsidiary business  The parent could not have the experience and skill to develop properly the business  Underperforming business brings down the value of the entire corporation To properly set up a disinvest strategya company must spend regular and dedicated session for exit review meeting, forcing the manage- ment to evaluate all businesses: o The first step is to understand the entity of synergies and shared asset, services and system, in this way the management can understand which is the cost of the operation o The mixture of different type of business allows to reduce the operating risk, and this will grant an higher financial capacity 7 It can be set on the overall business (warrants) or just to the Target one (contingent payment), each of them have its own advantage and cons 8 There could be problems on monitoring, external events and rise of conflict of interest. That’s way it is crucial to properly address all the possible situations/problems 6
  • 7. Giulio Laudani #27 Cod. 20137 oIf the operation is undergo is really important to understand and well define the legal aspect of the operation to avoid any slow down during the transaction or unpleasant surprise after the transaction o Consider the market valuation to discover if there is a significant mismatch between intrinsic value and current valuation (ex- ploiting asymmetric info). In a sense liquidity in the market allows divesture to be more attractive Type of transaction can be private or public, the first one is better if you can identify a proper bidder, not all the transaction bring a cash proceeds, many create long term value by giving new share to existing shareholder: o Equity curve out: in this way the parent doesn’t give up control on subsidiary, to maintain same synergies  However, the separation is typically irreversible, due to possible dilution of parent ownership, hence it is important that parent executive need to plan a full separation since the beginning of the transaction  The risk of unclear governance is present in this type of transaction, and this can destroy the benefits that were supposed to happen. Any subsequent reacquisition is typical a negative sign and empirical research shows that any blend strategy doesn’t grant positive return for the shareholders o Spin off: the parent gives up the control of the subsidiary, which shares will be divided through parent shareholders, allowing 9 the maximum strategic flexibility for the subsidiary . Sometimes this transaction is done with a two-step: at first a partial IPO followed by the spin off, this typology allows the existence of a market for the parent shareholder in the case they want to li- quidate their stake o Split off is an offer to parent shareholder to exchange their shares with those of the subsidiary, so the equity will be divided o Tracking stock is a new possibility that allows the parent to retain control, but create severe problem of governance, in fact the board will be the same  Each entity will liable to all the group debt, hence there is no financial advantage, furthermore empirical research have proven that there is no value creation for this transaction o IPO is the way the new share are issue in the market to new investors o Joint venture and Trade sale are the private transaction Capital structure 10 Consequences of the capital structure and the typical tradeoffs in defining the optimal structure : o Tax savings is granted by the possibility to reduce the taxable income, and therefore increase the value of the company. However there is an important consideration to be made: usually taxation on interest income is higher than on capital gains for investors, hence with a 100% debt funding the investor tax rate could be higher o Reduction of corporate overinvestment: debt can help impose discipline on mangers; therefore the management is forced to pay back the debt interest expense before making another investment. This is quite crucial for highly fragment ownership o Cost of business erosion and bankruptcy: highly levered company could forgo good investment opportunity or reduce R&D (loss of flexibility), moreover they can lose client, employers and suppliers due to the risk of a financial distress o Cost of investor conflicts may become crucial, the two main investors categories can have different view on how to run the business (different risk appetite, moral hazard problem) o Besides all this consideration there isn’t any analytical formula for the optimal choice, because every business have different needs and characteristic, which will require different level of flexibility and robustness form the financial side The tools used by firms to finance their business are (form the most preferred to the less one):Internal resources, in other world reinvest- ing the income; issuing debt, which is the more common practice. Thereexist several possible instruments to be issue; &issuing equity which is the last resort because it can cause the share price to fall. Some empirical data: o Firms ends to react to regain their target capital structure after a change only after two years rather than immediately after each change; continuously adjustment are too costly and impracticable o Firms are likely to issue equity when they are overleveraged compered to their target How to set an effective capital structure: o Look at the peer group is a good approach; at least firms are not giving away any competitive advantage derived by the capi- tal structure. This problem is quite severe when competitors can use their financial robustness to start a war of price o Credit rating analysis is suggested when peer group is far away from their optimal structure due to wave change in the mar- ket. In doing this the executives must understand the key driver in rating: The size is an external factor and it is determinant only for blue chips segment, it is a prerequisite to achieve high rating (above AA) 9 The subsidiaries show the higher performance improvement (empirical test) 10 Debt leverage matter less than we have expected, in fact firm’s structure is usually set up more in a negative way, by trying to avoid losing value more than achieving higher value with a prospective attitude  The cost of an error is more costly than any possible advantages. Market surveys have proven that the firms prefer a rating range between A+ and BBB-, for struc- ture outside this range the loss of value or the cost are too high in fact among this range the value of the tax shield difference is really slim 7
  • 8. Giulio Laudani #27 Cod. 20137 Coverage ratiogives a measure on how many times the firm is able to repay interest by using cash flow. It is more relevant together with the underling volatility of the revenues (risk proxy measurement) Leverage ratio measures the samething of coverage, but over different time horizons (long term), hence it is complementary to the first Solvency is not critical, besides for financial distress prospective  The Credit spread doesn’t increase linearly according to the default probability, in fact there is much more differ- ence in the default probability between BBB and B than between AAA and BBB  Another approach to value rating is the market based one, it consists on extrapolate from the current price the im- plied risk, instead of computing the firm ratios. This methodologies is a nice measure because consider all the in- formation, but it is sensible to short term fluctuation o Cash flow analysis is the best one to understand the specific needs of the own business in terms of flexibility and robustness For any capital adjustment on the short term Management is facingasignal problem and a transaction cost, the first one is difficult to esti- mate, while the second is clear since it is an explicit cost o Commonly the higher transaction cost is associated with the IPO, followed by SEO, Bond convertible and bond. o The signal problem is the typical reaction of the market to management action, besides any other consideration:  Dividend cut is a really strong negative signal, so any change in the dividend policy must be carefully taken  Issuing equity is taken as an executives’ belief about overvaluation of stock price  Issuing debt gives less negatively signal  Redeemingexcess fund is controversial, it is a positive signal because the company is able to produce extra cash, but it could the case of losing future benefit due to lack of investment opportunity  Share repurchase is a better choice if the management doesn’t want a long term commitment and furthermore this strategy do not force the investors to choose between capital gains or dividends  Debt repayment have different drawback the market will think that stock are overvalue (otherwise the company should have buy it), that future cash flow are not enough to repay debt or a lack of investment opportunity. It is dif- ferent in the case of financial distress, in this situation it is a positive signal  Increase dividend must be undertaken consciously, any increase must be sustainable (long term commitment). In general it is viewed as positive by investors, however can be a signal for future low return (less Investment) Business plan must represent all the Management issues regarding the long term horizon, hence it should determine: o At first we have to estimate the surplus and deficit, and this is crucial, in fact CFO spend more time on it to grant enough flexibility and robustness o Estimate expected operating and investment cash flow, so that is possible to plan the requirement of capital for the capital expenditure and acquisition o Analyze exposure to business risk to understand any possible fluctuation to assess the robustness requirement o Make assumption on unexpected investment opportunity, to assess the flexibility o Project as-if financing surplus or deficit assuming not changing structure o Set target capital structure, management help themselves with setting controlling ratio, (enforce them if there are any cove- nants on past debt). It must follow the business cycle o Decide the tactical measure to implement in order to move toward the target (short term tactics) Create value from financial engineering o Derivate instruments can transfer some risk to a third party, but management must be aware of their complexity and they have to avoid error o Off balance sheet is a good instrument to raise fund without affecting the balance sheet outlook, however the market is aware of it, hence it must be used to create special vehicles to boost or securities asset to receive debt o Hybrid financing like convertible bond must be understand by management, in fact given up ownership for a low coupon can be a misleading strategy How to implement value enhancing strategies and how to ensure management to recognize them: When we have recognized some possible initiatives we need to assess a proper internal management organizational scheme to implement them. We need to work simultaneously on the governance, compensation and market relationship side. At first we will describe an innovative gover- nance scheme proposed by McKinsey to deal with increasing complexity then we will reconcile governance with compensation, enlarging our discussion to market linked instruments. The second section is entirely dedicated on Market information stream both from a management pros- pective (how to deal with investors and how to avoid mistake) and from an investors one (try to understand the stock price movements) 8
  • 9. Giulio Laudani #27 Cod. 20137 Governance& compensation scheme Firms have to face continuously with decision, trade off and operational issue on how to value performance and consequently decide how to al- locate resources. Therefore is crucial to definea new approach which works on several variables: It is crucial for a company to ensure that all decision affecting value are consistent with objectives, to ensure thisit is important to develop a reliable management performance system to see clearly the impact of those decisions The ultimate solution proposed by McKensey is Value Managerwhich is an useful tool to make easier the decision process in case of trade off, helpingin defining priority among actions and in setting priorities (ensuringmulti-dimensional improvements) and to better allocate time resource, in fact 40% of time resource is dedicated to this task, and moreover one of the main role of the CFO is to properly implement those performance measurement ; this situation has been steam up by a greater external pressure/scrutiny on companies and by the in- creasing business complexity Choose the right metrics to ensure value creation and organizational health: o First of all we should identifying value drivers by dividing from internal (controllable) factor and those who are external (take as given) and by focusing on the first one:  Short term driver are: sales (market share, price premium), operating cost and capital (working capital) productivity index/ratio  Medium-t: Commercial (brand, pipeline, customer satisfaction), cost structure (ability to have to manage its cost relative to competitors) and asset health  Long term: define and measure the opportunities and the threats it is a more qualitative milestones 11 12 o Secondly develop a value drivers tree diagram to increase the company insight (be company specific ); we can assess the difference by characteristic, ROIC-growth profile, so that it is possible to understand where company is doing well and where not. To create BU we need to identify:  The overhead cost to be allocate in the center cost units which must be value separately: To properly compare BU with peer that don’t have those cost To assess how much resources are dragged by overhead  Do not off-set internal transactions, but rather left them in the FCF  The BU’s debt cost, in case of miss reconciliation allocate the difference as a corporate item  The BU’s NOPLAT and IC and reconcile them with the company’s one o Thirdly we need to ensure the ability of the company of retaining valuable human resource by providing a good work envi- ronment (value, satisfaction) o Lastly chose effective targets, that need to be both realistic and challenging  Use benchmark from competitors or other cells/ Business units parameters, often senior executives will bench- mark performance not against BU’s peer, but rather to other BU within the firm, even if they have different fea- tures  Set range is better than single point by dividing the target in base and in stretch one Organizational support for corrective action: o Buy-in to performance managementat all levels:it means to involve all management level by enforcing the perception of value creation in all the communications, link value creation with reward process o Properly define target, be specific (explain interrelation) and motivating 13 o Fact-based performancereviews : using more than financial report to make decision, use brain storming or meeting to dis- cuss of the problem to better inform all the parts The compensation is a crucial element, highly linked with Organizational and Governance. We are going to describe the TRS relation with salary. At first we need to address that short term movement are meaningless, and that there exists a possible distortion in using TRS, which is the treadmill. Management shouldn’t pay attention on short term movement, as a general rule management should start to be worry for any movement greater than 2% daily or 10% quarterly not justified by peers’ co-movement Market expectation translates themselves into value creation and can easily become a treadmill, which means that successful company al- ready discount extremely future positive return, so it becomes really hard to further improve those expectations, and (hence) the market price. An appropriate rewardwill aim to long term/sustainable growth pursuing : o Stock based stripping out broad macro or industry effects o Postpone bonus compensation o Long term company health metricslike ROIC, Growth measure relative to peers 11 The higher is the disaggregation the better, under those simple rules: Each cells should be enough big to be independent and should not share too many activity or link (limited synergy) with other cells 12 By branch, by division/geographical area, by custom types 13 It’s common practice to use scorecards, since they allow fast and easy comparison between units, however it is important to address the unique characteristic of each units 9
  • 10. Giulio Laudani #27 Cod. 20137 o Use more holist system, less math o Harnessing the power of non-financial incentives like career progression o Understand the market expectation to properly set up stock linked compensation to overcome the treadmill problems, thus fru- strating the management Information gave by the market and managerialimplication Now we will speak about the relation between stock price and their intrinsic value. At first we will understand the source of TRS by decompos- ing it, using two possible ways: The traditional decomposition defines the TRS as the linear summation of % increase in earnings, % change in P/E and dividend yield. This methodology has three limits: o Not all type of earnings lead to value creation o The dividend yield can be increased without affecting future earnings, just modifying the payout ratio o It doesn’t consider the financial leverage of the company 14 The McKinsey approach consists on breaking down the TRS into 4 parts, it will allow management to have a better insight : o Value generating from revenue growth net of capital required to sustain that grow o What TRS would have been without the growth part o Change in P/E or other earnings multiple between period o The impact of leverage on TRS It isn’t always a good measure of intrinsic value; however it has been proven by many papers the existence of the relationship between key value drivers and stock price, thus TRS o ROICstrong relationship o Growth high relations only for company with a positive ROIC spread, the higher the higher the impact of g o Expectationinitial expectation plays a big role in assessing the TRS, and any change in expectation has big market effect o There are empirical evidences of the existence of long term reversal and short term momentum. The first one is a direct con- sequence of overreaction, while the second of under reaction. However there is no evidence against efficiency, in fact those 15 movements are unpredictable; hence the abnormal return of these strategies is still close to zero o For company with low growth could be hard/impossible to recognize the ROIC contribution by using earnings multiple (com- mon practice), hence it is suggest to use capital multiples As we can see the earnings multiple is rescaled by the return ratio Now we will dedicate ourselves on defining why market efficiency is important and how it is granted. It is possible to speak of efficiency since on the long run the stock market follow underling valuation/criterions; this is allowed by the presence of informed investor which has the highest long-t influence. Efficiency in the market will ensure that market price stays linked to ROIC and growth rate measures. There are several surveys to show the strong relation between ROIC spread and stock return, this is strong proof on the fact that the noise component usually creates distortion only in the short term. They can be classified into three classes:Intrinsic investor rigorous due diligence, they drive stock price; Traders bet on short term movements, they don’t have any view on the stock; &Mechanical investors use math to develop models or replicate index. Those class of investor look at whatdrives the stock value As a general rule Management should keep in mind that substance always prevails on form; hence either management or technical trading artificial policy don’t allow any excess return: o On Managers’ side- the attitude to use account to manage earning doesn’t have any effect on the valuation  Smooth or less volatile earnings don’t provide any extra return  Treatment of goodwill doesn’t show any market impact, the market totally anticipated the decision and the lower benefits  Different accounting standard doesn’t lead to different values (inventory, stock option, ...) o On Technical trading side- those factors are irrelevant  The decision of be traded in more the one stock doesn’t grant any extra return, however it isn’t true for emerging country firm, which will have a benefit of being listed in a more liquid market  Belonging in an index doesn’t give any extra return (there is a small evidence of a positive trend) and be delisted doesn’t affect long term return 14 The growth component (first one) is computed as the increase of earnings, this measure minus the period investment gave us the Growth of TRS from performance. The zero-growth component is the past earnings over past equity value (it is a return). The multiple contribution is a short term benefit a company cannot increase TRS by exploiting this variable 15 If management is aware of any deviation it is rational to expect to see them to implement tactics to exploit those deviations by repurchasing program. 10
  • 11. Giulio Laudani #27 Cod. 20137 Stock Split has a positive impact due to the positive signal impact, the management is confident of future perfor- mance, and this operation reduce the capital constrain, furthermore this operation is the consequence of past posi- tive performance In same eras/case some situation can bring the market to systematically trade far away from intrinsic value: small free float, or any kind of barriers which is lowering the market efficiency. o The emotion and mispricing in the market are rare and not long lasting; they are caused by the predominance of irrationali- ty from some individuals or group of investors.  Long term Reversal may be due to investor overreaction on good news  Momentum may be explain by some friction in the market, meaning investors are slow to correct their valuation o The market will give too much attention on last result, overvaluing the last industry develops o There is an intrinsic market asymmetry which reduces efficiency. Short position are much riskier than long one, hence there 16 is less corrective trade on the negative side, furthermore there exist limit on short selling What information is important to know what to be sent to the market and which doesn’t?Any significant gap between intrinsic value and stock price is a disadvantage to all the company’s stakeholders: too high valuation can lead to short term tactics aiming to maintain that unsustainable level, while too low can reduce morale and create concern in the board. Management from big corporation usually react to this problem by spending lots of time dealing with investors with an ad hoc way, but it is highly suggested to implement systematic approach, so that the management can communicate better and in a less time consuming mode. There are three areas in the communication field to be addressed: Understand if there is any discrepancy with the market communication, what are the market beliefs and implicit forecasting assump- tions.Often the executive doesn’t have a clear touch with reality, in fact they may not aware that their company is already valued at an high premium and the implied hp are incredibly aggressive or maybe they don’t understand that their hp are considered over optimistic by the market that is adopting a waiting strategy (they want numbers) Understand the investor base and focus the communication to each category. A common fallacy believed by executive is that they can change their price by marketing to different categories of investors, this is not the true Taylor the communication to those who mostly determine the stock price, which are intrinsic investor, they are not interested in short term tactics, but only in long term strategy 17 o Transparency is being a must in the principle for accounting, but there is a big room for decision regarding disclosure  The management should be honest on their communication, any “deviation” won’t last long, moreover the compa- ny may gain to be transparent showing their project, it is like showing confidence on their strategy and the incapa- bility of the competitor to replicate it  Since intrinsic investors are sophisticated, company should give more detailed information avoiding aggregate data, as a rule of dumb they should disclosure for each business units down to the level of earnings before tax  Final note: Sometimes successful firms doesn’t disclosure their plan, exploiting their success as long as it lasts & Use the same metric from quarter to quarter, avoid any kind of account magic o Guidance on future business evolution are useful, but there are some comments:  EPS evolution is not a good guidance; sophisticated investor doesn’t look at these numbers. Firms doesn’t suffer any loss when they stop to communicate EPS evolution and doesn’t gain any extra earnings premium (paper)  Guidance on the short, median a long term on value driver are highly suggested, so that the investors can make their valuation 16 The so-called noisy trader risk, big short sell may hamper the efficiency the market favoring irrational behavior 17 In some business like commodity is more important to disclosure production data not the revenue one, since the last oneis influenced by external factor (better dealt by investors) 11
  • 12. Giulio Laudani #27 Cod. 20137 Valuation methodologies are based on several variants: Some general statements on valuation:A valuation isn’t an objective search of “true” value; in fact all valuations are biased. The only questionis how much and in which direction; we can assess that the direction and the magnitude are directly proportional to whom is paying and how much they are paying you. Hence, there isn’t any good valuation even if valuation models are quantitative, actually it is not true that the more quanti- tative a model, the better the valuation: One’s understanding of a valuation model is inversely proportional to the number of inputs required for the model, that’s why Simpler valuation models do much better than complex ones.Any kind of research, no matter how good they are, is affected by firm-specific as well as market wide information and it will age quickly as new information is available. There exist five well known 18 frameworks : enterprise DCF value, equity cash flow, economic profit, APV and Capital cash flow. In theory, each framework will generate the same value. In practice, the ease of implementation and the interpretation of results the betterIt is suggested the first one. DCF Model DCF is the most accurate and the most flexible method for valuing project, division or companies. It requires four elements: WACC, OFCF, Con- tinuing value and non-operating asset valuation. Here we will discuss about all the estimation issues and some suggestion on how set up a prop- er framework to judge all possible issues. WACC Estimation: WACC will be used to discount the cash flow and it represents the cost of capital computed as the blended rate of return for all sources of capi- 19 tal, specifically debt & equity. When performing Enterprise DCF, make sure to choose the cash flows and discount factor consistently. Since free cash flows are the cash flows available to all investors, the discount factor for free cash flow must represent the risk faced by all investors To estimate the cost of equity, we must determine the expected rate of return of the company’s stock. Since expected rates of return are unobservable, we rely on asset-pricing models that translate risk into expected return.The three most common asset-pricing models differ primarily in how defining risk factors. o The capital assets pricing model (CAPM) states that a stock’s expected return is driven by how sensitive its returns are to the market portfolio. This sensitivity is measured using a term known as “beta.” o The Fama-French three-factor model defines risk as a stock’s sensitivity to three portfolios: the stock market, a portfolio based on firm size, and a portfolio based on book-to-market ratios. o The Arbitrage Pricing Theory (APT) is a generalized multi-factor model, but unfortunately provides no guidance on the ap- propriate factors that drive returns. To Estimate the cost of debt (kd) we need to check: o If the firm trades bonds in the market and those bonds are liquid we can compute the implicit yield to maturity (YTM), in fact although YTM represents a promised yield, it is a good approximation for expected return for investment grade companies. o In the other case we will compute the yield-to-maturity indirectly by adding a default premium (based on company’s rating) to the risk free.Yield to maturity is not an expected return. It is the return earned if the obligation is paid on time and in full. 20 Since distressed companies have a significant chance of default , the yield-to-maturity is a poor proxy for expected return.In order to be compensated for default risk, lenders charge a premium over the default-free benchmark rate to risky custom- 21 ers .  Regardless of the maturity structure for the company’s debt, use a long-term risk free rate when estimating a com- pany’s cost of capital. Using short-term debt yields ignores the fact that future debt will have different yields 22 o One alternative for computing expected return is the CAPM . Since most bonds don’t trade enough to generate a reliable beta, however, we can compute index betas instead o The tax shield can simply be computed (1-t) as proxy To develop a target capital structure for a company: o Estimate the company’s current market-value-based capital structure, if the company is not listed used an iterated formula o Review the capital structure of comparable companies to place the company’s current capital structure in the proper context  Industries with heavy fixed investment in tangible assets tend to have higher debt levels.  High-growth industries, especially those with intangible investments, tend to use very little debt. 18 A distinction between models: you can either value the cash flows generated by the company’s economic assets, or value each financial claim separately (debt & equity) 19 It must be denominated in the same currency as free cash flow and in nominal terms when cash flows are stated in nominal terms; basically if any risk it is accounted in the numerator the risk premium associated to that risk must be eliminated from the denominator 20 Professional firms, such as S&P and Moody’s, rate the default risk of most bonds, Once a bond rating has been identified, convert the rating into a yield to maturity 21 The higher the chance of default, the higher the premium will be. 22 Empirical paper shows that high yield debt has only a slightly higher beta than investment grade debt, as an example if the market risk premium equals 5%; this difference translates to only a 50 basis point differential in expected return! 12
  • 13. Giulio Laudani #27 Cod. 20137 o Review management’s implicit or explicit hp on how financing the business and on its implications for the targeted capital structure. However, a time-varying WACC is appropriate if (1) the yield curve is sharply increasing or decreasing or (2) if significant changes are ex- pected in any of the following: the capital market weights for debt and equity, the cost of debt or the tax rate. For complex capital structure is better to specifically model the tax shield with an APV model OFCF Estimation: 1. The second step in DCF is to forecast the Operating cash flow byforecasting each balance items, however before doing that we need to collect and rearrange/understand info o When analyzing historical performance, keep the following in mind:  Look back as far as possible (at least 10 years). Long term horizons will allow you to evaluate company and industry trends and whether short-term trends will likely be permanent  Disaggregate value drivers, both ROIC and revenue growth, as far back as possible. If possible, link operational per- formance measures with each key value driver.  Identify the source, when there are radical changes in performance. Determine whether the change is temporary or permanent, or merely an accounting effect. o Understanding a company’s past is essential to forecast its future. Using historical analysis or analyzingoperating and financial trends, we can test ifthe company is able to create value over time and to compete effectively within the company’s industry o A good historical analysis will focus on the drivers of value: return on invested capital (ROIC) and growth. ROIC and growth drive free cash flow, which is the basis for enterprise value.  Rearranging the accounting statements,  Digging for new information in the footnotes,  Making informed assumptions where needed o Before you begin forecasting individual line items, you must determine how many years to be forecasted and how detailed your forecast should be. [as a general rules]  A detailed 5 to 7year forecast, which develops complete balance sheets and income statements with as many links to real variables (e.g., unit volumes, cost per unit), the explicit forecast period must be enough long to reach a steady state, defined by the following characteristics The company grows at a constant rate and reinvests a constant proportion of its operating profits into the business each year. The company earns a constant rate of return on new capital invested. The company earns a constant return on its base level of invested capital. In general, we recommend using an explicit forecast period of 10 to 15 years perhaps longer for cyclical companies or those experiencing very rapid growth Using a short explicit forecast period, such as 5 years, typically results in a significant undervaluation of a company or requires heroic long-term growth assumptions in the continuing value  Sometimes above the detail forecast it is added asimplified forecast,which is focused on few important variables, such as revenue growth, margins, and capital turnover, if we believe on company’s higher growth compared to the terminal value hp  Value the Terminal years by using a perpetuity-based formula, such as the key value driver formula o At first we should find the NOPLAT and Invested capital from the historical trend, so that we will have an insight on the com- pany performance. Usually account measure are not reliable:  ROE mixes operating performance with capital structure, making peer group analysis and trend analysis less mea- ningful. ROE rises with leverage if ROIC is greater than the after-tax cost of debt.  ROA measures the numerator and denominator inconsistently (even when profit is computed on a pre-interest ba- sis). For instance, ROA double counts implicit financing charged by suppliers – in the numerator as part of COGS and in the denominator as part of total assets. o The valuation spreadsheet can easily become complex. Therefore, you need to design and structure your model before start- ing to forecast, here there is a possible scheme to be followed:  Prepare and analyze historical financials. Before forecasting future financials, you must build and analyze historical financials. In many cases, reported financials are overly simplistic. When this occurs, you have to rebuild financial statements with the right balance of detail. 13
  • 14. Giulio Laudani #27 Cod. 20137 23  Build the revenue forecast . Almost every line item will rely directly or indirectly on revenue. You can estimate fu- ture revenue by using either a top-down (market-based) or bottom-up (customer-based) approach. Forecasts should be consistent with historical evidence on growth.  Forecast the income statement. Use the appropriate economic drivers to forecast operating expenses, deprecia- tion, interest income, interest expense, and reported taxes.  Forecast the balance sheet: invested capital and non-operating assets. On the balance sheet, forecast operating working capital, net property, plant, & equipment, goodwill, and non-operating assets.  Forecast the balance sheet: investor funds. Complete the balance sheet by computing retained earnings and fore- casting other equity accounts. Use cash and/or debt accounts to balance the cash flows and balance sheet.  Calculate ROIC and FCF. Calculate ROIC to assure forecasts are consistent with economic principles, industry dy- namics, and the company’s competitive advantage. To complete the forecast, calculate free cash flow as the basis for valuation. Future FCF should be calculated the same way as historical FCF. 2. From this information we will compute the projection for the futurecash flow. o One critical component of financial forecasting is your estimate of revenue growth, as almost every line item will rely directly or indirectly on revenue, so any error in the revenue forecast will be carried through the entire model.  You can estimate revenue using either a top-down (market-based) or bottom-up (customer-based) approach Extend short-term revenue forecasts to long-term Estimate new customer wins and turnover Project demand from existing customers Estimate market share and pricing strength based on competition and competitive advantage Estimate quantity and pricing of aggregate worldwide market o With a revenue forecast in place, next forecast will be the individual line items related to the income statement. To forecast a line item, use a three-step process:  Decide what economically drives the line item. For most line items, forecasts will be tied directly to revenue.  Estimate the forecast ratio. Since cost of goods sold is tied to revenue, estimate COGS as a percentage of revenue.  Multiply the forecast ratio by an estimate of its driver. For instance, since most line items are driven by revenue, most forecast ratios, such as COGS to revenue, should be applied to estimate the needed variable.  When forecasting balance sheet items, use the stock method. The relationship between balance sheet accounts 24 and revenue (the stock method ) is more stable than that between balance sheet change and change in revenues 25 (the flow method ). o The last five line items: excess cash, short-term debt, long-term debt, a new account titled newly issued debt, and common stock. Some combination of these line items must make the balance sheet balance. For this reason, these items are often re- ferred to as “the plug.” Simple models use newly issued debt as the plug, while advanced models use excess cash or newly is- sued debt, to prevent debt from becoming negative.  Step 1: Determine retained earnings using the clean surplus relation, forecast existing debt using contractual terms, and keep equity constant.  Step 2: Test which is higher, assets excluding excess cash or liabilities and equity, excluding newly issued debt. 23 To ground our historical analysis, we need to separate operating performance from non-operating items and the financing to support the business. To prevent non-operating items and capital structure from distorting the company’s operating performance, we must reorganize the financial statements following this rules: o NOPLAT. The income statement will be reorganized to create NOPLAT, which represents the after-tax operating profit available to all financial investors.  If the company has no tax credits, operating taxes can be computed by multiplying the adjusted EBITA by the tax rate  If the company has tax credits, multiplying operating profits by statutory tax rate will overstate the company’s tax burden. In this case, start with re- ported taxes and remove any taxes related to non-operating items and financial structure  Many financial analysts prefer to compute NOPLAT using cash taxes and treat deferred tax accounts as equity equivalents. To do this, computed re- ported operating taxes and subtract the increase in deferred tax liabilities o Capitalizing R&D If a company has significant long-term R&D, do not subtract the annual R&D expense. Instead, capitalize R&D on the balance sheet and sub- tract an annualized amortization of this capitalized R&D. o Capitalizing Operating Leases If a company has significant operating leases, capitalized the operating lease on the balance sheet and adds back lease-based in- terest to operating profit. Convert the remaining rental expense to depreciation. o Excluding Recognized Pension Gains & Losses. Pension gains & losses booked on the income statement are usually hidden within cost of goods sold. Remove any recognized gains or losses from NOPLAT. Unrecognized gains do not flow through the income statement, so no change is required for unrecognized gains. o Invested Capital. The balance sheet will be reorganized to create invested capital, which equals the total capital required to fund operations, regardless of type (debt or equity). o The reported tax rate can be misleading because companies can defer certain taxes for many years. In fact, a growing profitable company could defer a portion of its taxes forever! Deferred taxes arise for a number of situations including:  Accelerated depreciation schedules  Pension accounting  Goodwill amortization 24 Basically compute the line as a % of the revenue (direct method) 25 Basically compute the change of the items as a % of the & of the revenues over time (indirect method) 14
  • 15. Giulio Laudani #27 Cod. 20137  Step 3: If assets excluding excess cash are higher, set excess cash equal to zero and plug the difference with newly issued debt. Otherwise, plug with excess cash. 3. When forecasting you are likely to come across three additional issues: o Nonfinancial operating drivers. In industries where prices or technology are changing dramatically, your forecast should in- corporate operating drivers like volume and productivity.  Consider the airline industry, where labor and fuel has been rising as a percentage of revenue– but for different reasons. Fuel is a greater percentage because oil prices have been rising. Conversely, labor is a greater percentage because revenue per seat mile has been dropping. o Currency Changes. Foreign revenues must be consolidated into domestic financial statements. If foreign currencies are rising in value relative to the company’s home currency, this translation, at better rates, will lead to higher revenue. o Changes in accounting policies. When a company changes its revenue recognition policies, comparing year-to-year revenue can be misleading (examples provided in slides) o Fixed versus variable costs. The distinction between fixed and variable costs at the company level is usually unimportant be- cause most costs are variable. For individual production facilities or retail stores, this is not the case, most costs are fixed. o Inflation. Often, the cost of capital is estimated using nominal terms. If this is the case, forecast in nominal terms. Be careful, however, high inflation will distort historical analyses. 4. Estimate a Continuing/terminal Value by forecasting cash flows in the long-term future, using a perpetuity that focuses on the company’s key value drivers, specifically ROIC and growth. A thoughtful estimate of continuing value is essential to any valuation because continuing value often accounts for a large percentage of a company’s total value. 56% to 125% of total value. o Although many continuing-value models exist, we prefer the key value driver model. The key value driver formula is superior to alternative methodologies because it is based on cash flow and links cash flow to growth and ROIC If RONIC=WACC  Continuing value can be highly sensitive to changes in the continuing value parameters  While the length of the explicit forecast period you choose is important, it does not affect the value of the company; it only affects the distribution of the company’s value between the explicit forecast period and the years that follow  In the formula, if you assume RONIC equals WACC. It implies that new projects don’t create value and existing projects continue to perform at their base-year level.  By computing alternative approaches, we can generate insight into the timing of cash flows, where value is created (across business units), or even how value is created (derived from invested capital or future economic profits).  Regardless of the method chosen, the resulting valuation should be the same o Other Methods:  Liquidation Value and Replacement Cost Liquidation values and replacement costs are usually far different from the value of the company as a going concern. In a growing, profitable industry, a company’s liquidation value is probably well below the going-concern value.  Exit Multiples (such as P/E and EV/EBITA) Multiples approaches assume that a company will be worth some multiple of future earnings or book value in the continuing period. But multiples from today’s industry can be misleading. Industry economics will change over time and so will their multiples! o A common error in forecasting the base level of FCF is to assume a constant re-investment rate, which impliesthat NOPLAT, in- vestment, and FCF will grow at the same rate  The assumption that RONIC equals WACC is often faulty because strong brands, plants and other human capital can generate economic profits for sustained periods of time, as is the case for pharmaceutical companies, consumer prod- ucts companies and some software companies.  Many analysts’ errors are due to excessive caution when estimating continuing value because of uncertainty, but to of- fer an unbiased estimate of value, use the best estimate available. The risk of uncertainty will already be captured by the weighted average cost of capital.An effective alternative to revising estimates downward is to model uncertainty with scenarios and then examine their impact on valuation  Several estimation approaches are available, but recommended models (such as the key value driver and economic prof- it models) explicitly consider: Profits at the end of the explicit forecast period - NOPLATt+1 The rate of return for new investment projects - RONIC Expected long-run growth - g Cost of capital - WACC  A large continuing value does not necessarily imply a noisy valuation. Other methods, such as business components and economic profit can provide meaningful perspective on how aggressive (or conservative) the continuing value is. 15