Downloaded 151 times


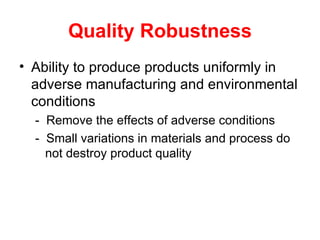

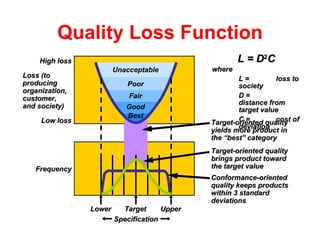


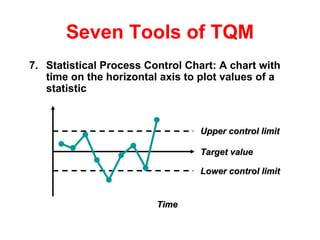


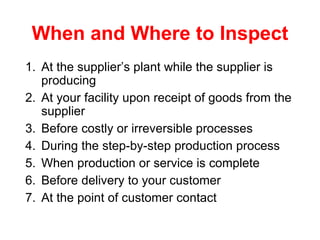


The document discusses quality management concepts including Taguchi concepts, quality robustness, quality loss functions, and the seven tools of total quality management (TQM). It explains that Taguchi concepts aim to improve product and process design through experimental design methods. The seven tools of TQM are described as check sheets, scatter diagrams, cause-and-effect diagrams, Pareto charts, flowcharts, histograms, and statistical process control charts. Inspection methods and determining when and where to inspect are also summarized.