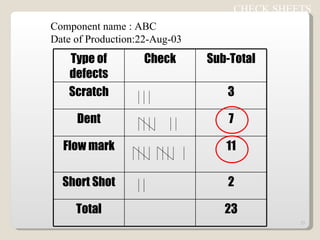
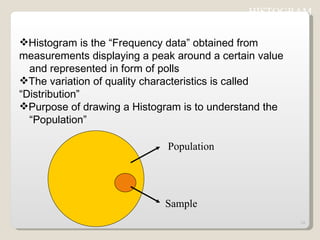
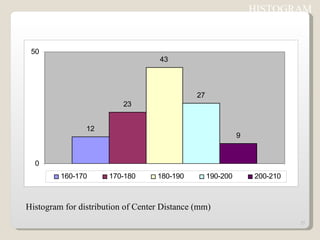
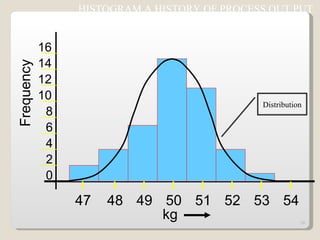
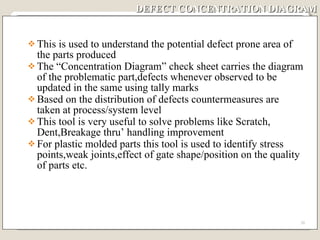
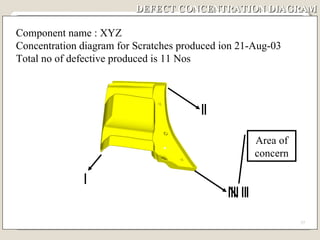
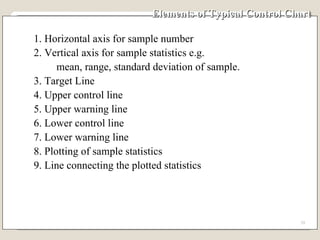
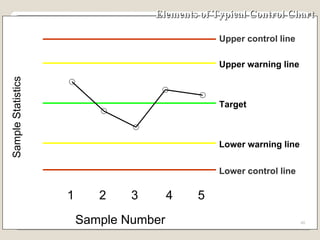
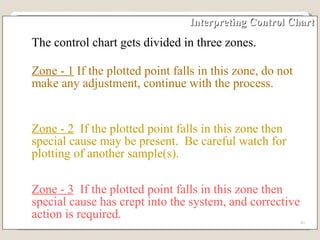
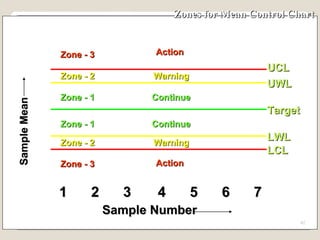
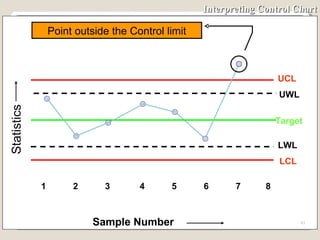
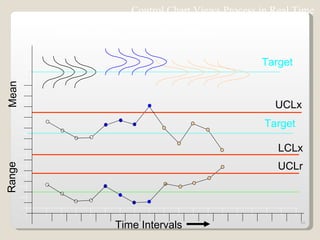
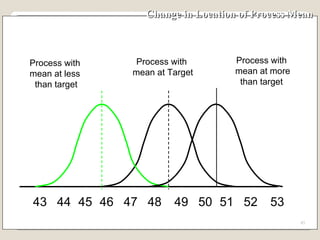
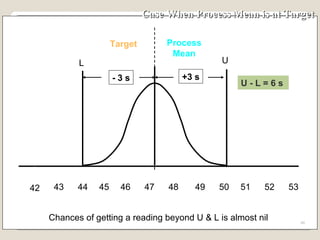
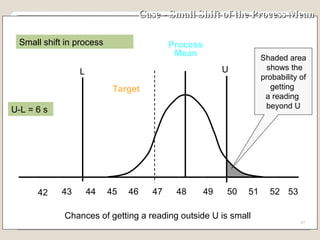
The document discusses 7 quality control tools used to identify, analyze, and resolve problems in a systematic manner. The tools include check sheets, histograms, Pareto charts, cause-and-effect diagrams, scatter plots, defect concentration diagrams, and control charts. These simple but powerful tools can help solve day-to-day work problems and identify solutions by collecting and analyzing process data.
Quality Improvement Of Fan Manufacturing Industry By Using Basic Seven Tools ...IJERA Editor
Research was carried out in a Fan manufacturing industry to address the quality related problems and improve their quality level by implementing basic seven tools of quality. These are important tools used worldwide in manufacturing industries for continual improvement. Flow chart, Check sheet, Histogram, Cause & Effect diagram, Pareto chart, Scatter diagram & Control charts were implemented in different steps of manufacturing process to define the problem, measure its impact, finding out its root cause and its removal to ensure the production of non defective items. The case study was carried out in “FECTO FAN” Gujranwala, Pakistan.
#The 7 Basic Quality Tools For Process Improvement - By SN PanigrahiSN Panigrahi, PMP
#The 7 Basic Quality Tools For Process Improvement - By SN Panigrahi,
Essenpee Business Solutions,
7 QC Tools,
Flowchart,
Check Sheet,
Histograms,
Pareto Diagram,
Cause & Effect Diagram,
Scatter Diagram,
Control Chart,
QCI
7 QC and New 7 QC Comparison & Applicabilityaksahu4u
Comparison of Application & Applicability
Problem Solving by 7 New QC Tools
7 New QC Tools help the managers address Strategic and Managerial Problems in 3 Stages
Stage 1 - Clarifying the "Actual Problem" by (1) Affinity Diagram and (2) Matrix Data Analysis
Stage 2 - Finding the "Real Root Cause" by (3) Relationship Diagram and (4) Matrix Diagram
Stage 3 - Implementation Plan and "Risk Mitigation" by (5)Tree Diagram, (6) Arrow Diagram and (7) PDPC
The 7 QC Tools (Basic) helps in problem solving when one deals with Quantitative / Numeric Data, where as 7 New QC Tools helps where there is Qualitative / Non-Numeric Data. Another major difference is that in 7 QC Tools (Basic) the problem is defined after collection of Data where as 7 New QC Tools helps to define the problem before data collection
Mastering seven tools of quality are very important for PMP examination as well as in managing real life projects. This presentation will provide great details about these tools to help you mastering them.
Seven tools of quality control.slideshareraiaryan448
7 tools of quality control help identify potential problem root cause and then target them for improvements and process optimization. These are widely used in all kind of manufacturing industries along with service industry as well.
Quality Journey -Introduction to 7QC Tools2.0.pdfNileshJajoo2
7QC Tool - Quality Journey , Myth about Quality :- Cost of Quality
Check Sheet
Histogram
Pareto Chart
Cause and Effect Diagram
Control Charts
Scatter Diagram
Process Flow Diagram
EFFECT is “WHAT?” Happens
CAUSE is “WHY?” it Happens
EFFECT = RESULT OR OUTCOME
CAUSE = REASON(S) OR FACTOR(S) CONTRIBUTING TO THE EFFECT
Quality Definition :- Doing the right thing , right at first time and every time, meeting
customer’s & investor’s expectations .
Statistical quality control applied industrial and manufacturing operations. Case study regarding the use of these tools. Description of statistical tools used in quality control and inspection.
Allowing BYOD brings risk, but it also brings productivity and cost-saving benefits when compared to supplying all external workers with company technology. BYOD brings new and varied devices into an organization’s network. The days of fixed workstations protected by internal security within one company building are long gone
In a post-perimeter world, organizations must rely on managed endpoint detection and response (MEDR) as a service from a managed security service provider to provide the first line of defense against a cyber attack.Yet, existing solutions require advanced expertise and time to use effectively. We have come up with Modern EDR that is built for speed for organizations of all sizes that values simplicitly and efficiency.
Privileged Access Management (PAM) is a solution that helps organizations restrict privileged access within an existing Active Directory environment. Privileged Access Management accomplishes two goals: ... Isolate the use of privileged accounts to reduce the risk of those credentials being stolen
Mechsoft technologies is a leading IT solution provider based in Dubai specializing in ERP implementation, Backup solutions and Cybersecurity solutions.
Iraje PIM is an Identity and Access Governance solution for managing privileged identities within the enterprise. It helps prevents insider frauds and improves the overall Governance, Risk and Compliance of the organization.
Redconic Technologies is a leading Information Technology (IT) service company based in Doha-Qatar. We have demonstrated experience in providing IT services to our customers in various domains. As a Software Development company Redconic specializes in the areas of Website Design, Mobile Application Development, Web Application Design and Development, E-commerce Solutions, Custom Software Development, Software re-engineering, SEO services, and IT consulting service. We are currently the employer’s choice for IT solutions in various geographies that we operate.
31. The problem categories considered are : Man, Machine, Method, Materials, Equipments & Environmental. EFFECT MACHINE METHOD ENVIRONMENT MAN MATERIAL EQUIPMENT CAUSE n EFFECT (FISH BONE) DIAGRAM
37. DEFECT CONCENTRATION DIAGRAM Component name : XYZ Concentration diagram for Scratches produced ion 21-Aug-03 Total no of defective produced is 11 Nos Area of concern
38.
39.
40. Elements of Typical Control Chart Target Lower control line Upper warning line Lower warning line Upper control line Lower control line 1 2 3 4 5 Sample Number Sample Statistics
41.
42. Zones for Mean Control Chart 1 2 3 4 5 6 7 Sample Number UCL Target LCL UWL LWL Zone - 3 Sample Mean Zone - 2 Zone - 3 Zone - 2 Zone - 1 Action Action Warning Warning Continue Continue Zone - 1
43. Interpreting Control Chart UCL 1 2 3 4 5 6 7 8 Sample Number Statistics UWL LCL Target LWL Point outside the Control limit
44. Control Chart Views Process in Real Time Time Intervals Range Mean LCLx Output of the process in real time Target Target UCLx UCLr
45. Change in Location of Process Mean 43 48 49 50 51 52 53 44 45 46 47 Process with mean at Target Process with mean at more than target Process with mean at less than target
46. Case When Process Mean is at Target 48 49 50 51 52 53 44 45 46 47 Target Process Mean Chances of getting a reading beyond U & L is almost nil 42 U L - 3 s +3 s U - L = 6 s 43
47. Case - Small Shift of the Process Mean 43 48 49 50 51 52 53 44 45 46 47 Target Process Mean Chances of getting a reading outside U is small Small shift in process 42 Shaded area shows the probability of getting a reading beyond U U L U-L = 6 s
48. Case - Large Shift of the Process Mean Process Mean 43 48 49 50 51 52 53 44 45 46 47 Target Chances of getting a reading outside U is large Large shift in process 42 Shaded area shows the probability of getting a reading beyond U U L U-L = 6 s
49. Change in Spread of Process 43 48 49 50 51 52 53 44 45 46 47 Larger spread due to special causes Spread due to common causes
65. Establishing Control Chart In our case Calculate Mean Range, R R = Sum of ranges of subgroups Total number of subgroups R = (7 + 5 +4 3 + 5 + 4 + 6 + 4 + 3 + 3 ) Total number of subgroups
66.
67.
68.
69.
70.
71.
72.
73.
74.
75.
76. Action and Warning Limits for Mean Control chart 1 2 3 4 5 6 7 Sample Number Mean UCLx LCLx UWLx LWLx Target
77. Action and Warning Limits for Mean Control Chart for Example 1 2 3 4 5 6 7 Sample Number Mean UCLx=52.5 LCLx= 47.5 UWLx=51.7 LWLx=48.3 Target=50
82. Action and Warning Limits for Control Chart 1 2 3 4 5 6 7 Mean UCLx = 52.5 LCLx = 47.5 UCLr = 9.3 Range UWLr = 8 LWLr = 1.6 Target = 50 R = 4.4 Sample Number LWLx = 48.3 UWLx = 51.7
83. Flow Chart for Establishing Control Chart Decide subgroup size Record observations Find mean and range of each subgroup Start Calculate mean range, R
84. Is any sub-group mean or range out side the control limit ? Drop that Group Yes No Flow Chart for Establishing Control Chart UCLx = T + A2 x R LCLx = T - A2 x R UCLr = D4 x R LCLr = D3 x R
85. Select suitable scale for mean control chart and range control chart Draw Lines for Target, UCL, UWL, LCL & LWL for mean Mean range, UCL , UWL, LCL & LWL for range Stop Flow Chart for Establishing Control Chart
86.
87.
88.
89.
90. Interpreting Control Chart UCL 1 2 3 4 5 6 7 8 Sample Number Statistics UWL LCL LWL One point outside control limit
91. Interpreting Control Chart UCL 1 2 3 4 5 6 7 8 Sample Number Statistics UWL LCL LWL Two points out of three consecutive points between warning limit and corresponding control limit
92. Interpreting Control Chart UCL 1 2 3 4 5 6 7 8 Sample Number Statistics UWL LCL LWL Two consecutive points between warning limit and corresponding control limit
93. Interpreting Control Chart UCL 1 2 3 4 5 6 7 8 UWL LCL LWL Seven consecutive points on one side of the centre line Sample Number Statistics
94. Interpreting Control Chart UCL 1 2 3 4 5 6 7 8 Sample Number Statistics UWL LCL LWL Seven consecutive points having upward trend
95. Interpreting Control Chart UCL 1 2 3 4 5 6 7 8 Sample Number Statistics UWL LCL LWL Seven consecutive points having downward trend