Download as PDF, PPTX

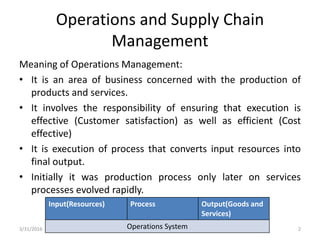
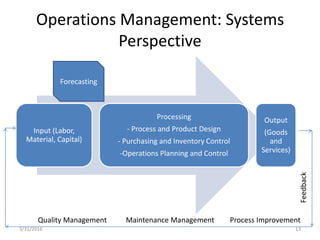
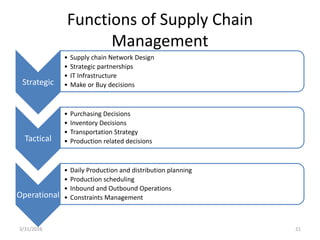
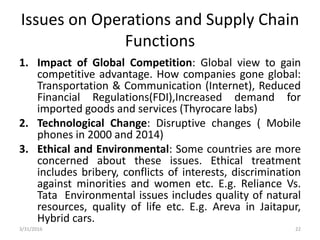
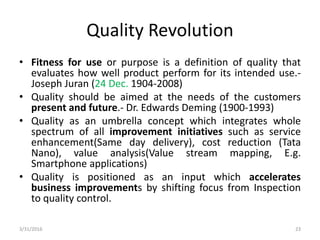
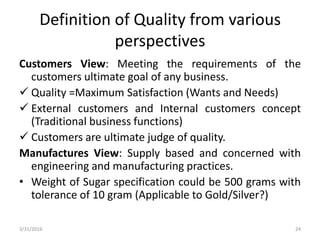

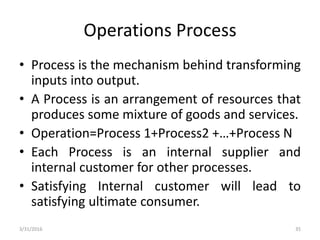
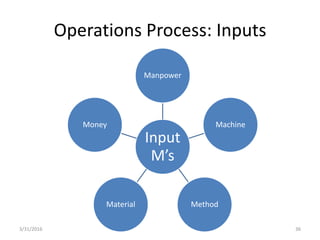
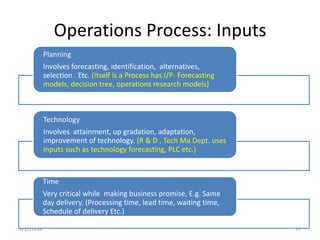


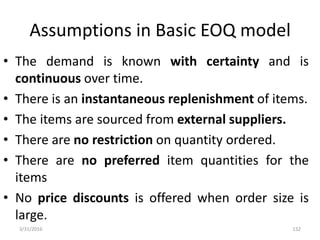
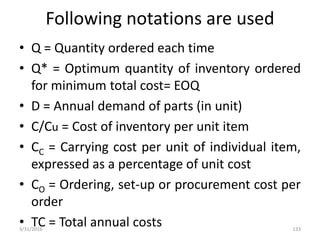
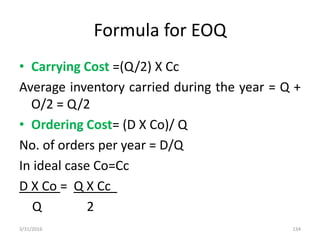
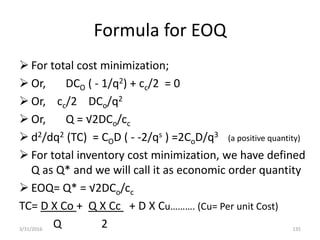

The document discusses operations and supply chain management, detailing the significado and scope of operations management, its objectives, significance, and functions. It elaborates on supply chain management (SCM), including its development, objectives, features, and its impact on efficiency and customer service. Key themes include the importance of quality management, total quality management (TQM), facility layout, and the process dynamics involved in transforming inputs into outputs.


