Downloaded 323 times
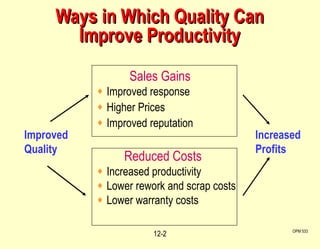
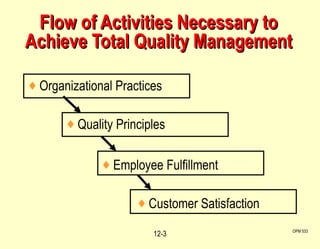
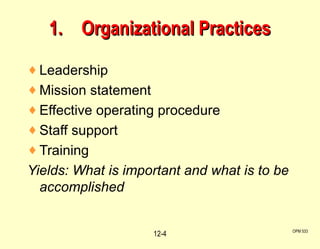
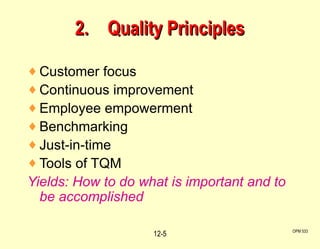
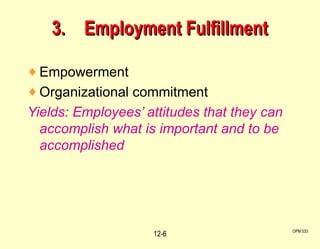
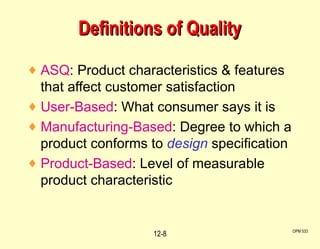
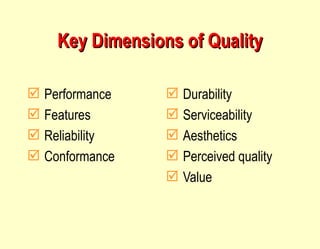
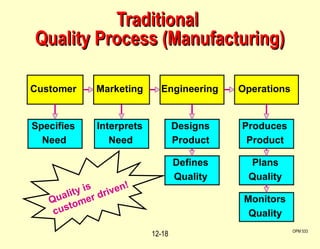
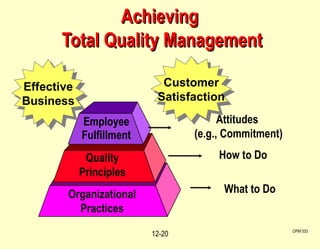
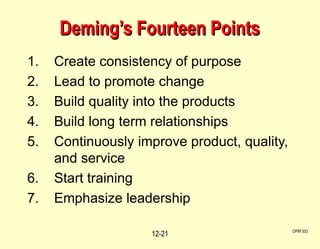
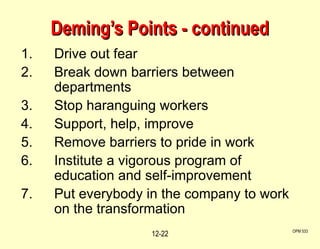
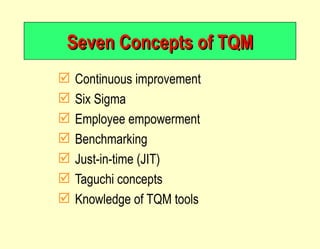
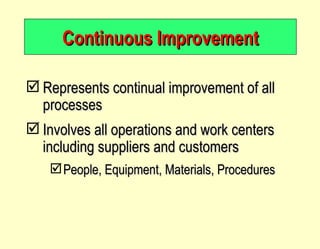
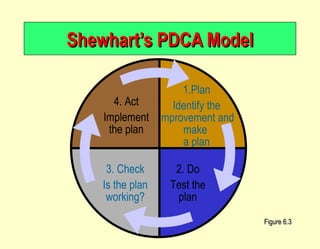
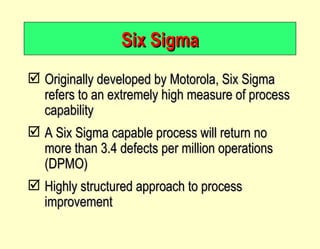
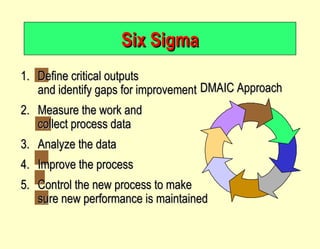
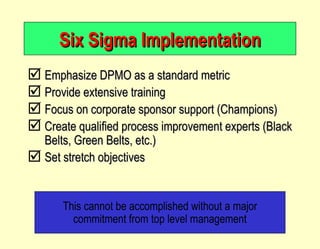
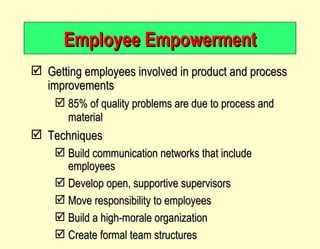
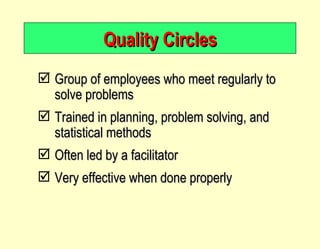
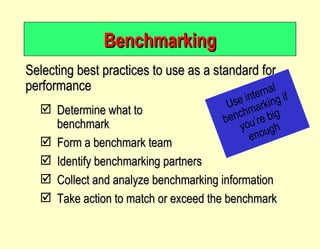
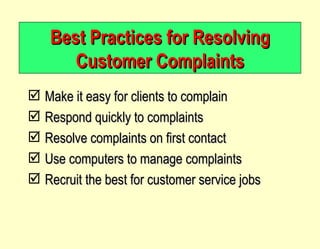
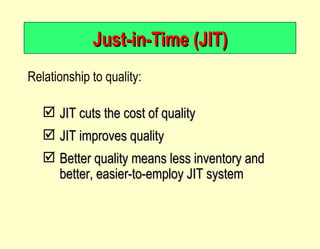
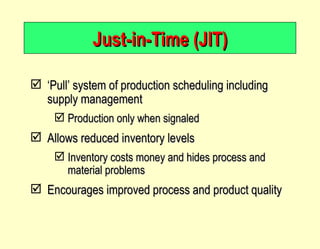
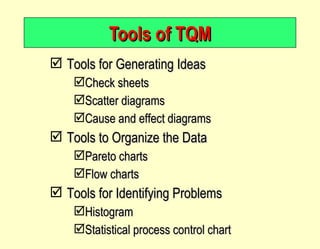
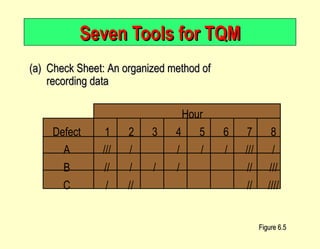
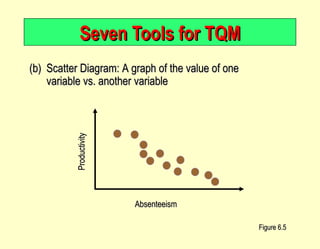
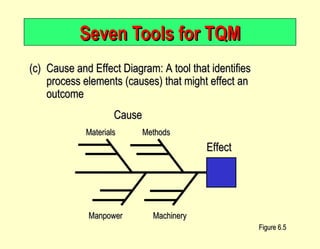
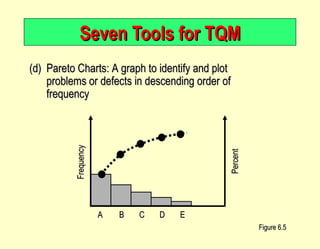
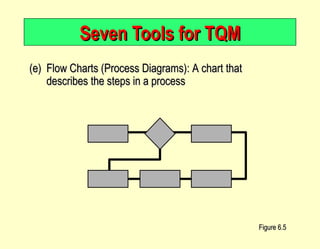
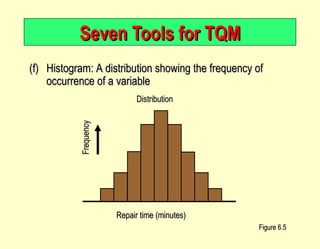
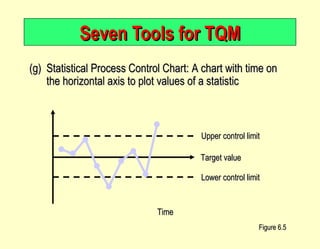
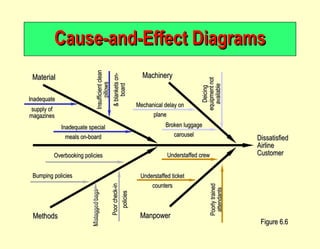
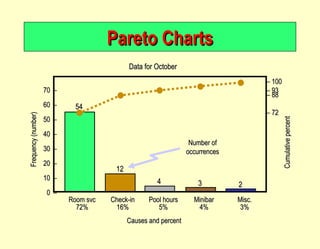
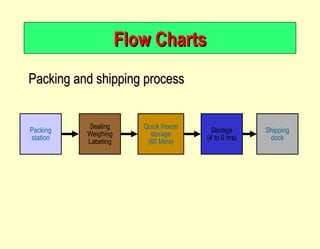
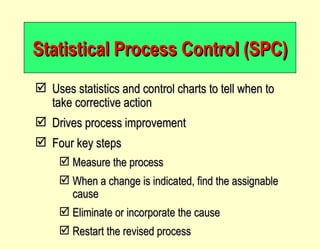
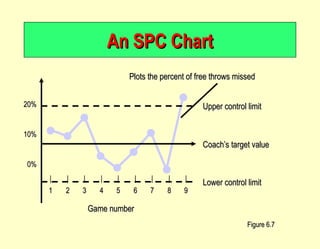

The document discusses various aspects of quality management including ways that quality can improve productivity, the flow of activities necessary to achieve total quality management, definitions of quality, key dimensions of quality, and tools used in total quality management such as continuous improvement, six sigma, employee empowerment, benchmarking, just-in-time, and statistical process control charts. It provides details on quality costs, Deming's fourteen points, concepts of TQM, and seven tools used in TQM including check sheets, scatter diagrams, cause and effect diagrams, Pareto charts, flow charts, histograms, and control charts.