Download as PDF, PPTX


![Model Performance Measurements
F1Score (fscore)
• = 2 * (PR/ [P + R])
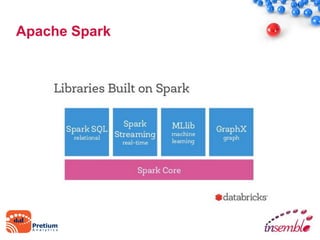
• Fscore is like taking the average of precision and recall
giving a higher weight to the lower value](https://image.slidesharecdn.com/machinelearningwithspark-150401081552-conversion-gate01/85/Machine-Learning-with-Big-Data-using-Apache-Spark-26-320.jpg)


The document discusses machine learning principles and applications, focusing on how Apache Spark can be utilized for data processing and predictive modeling in various fields like economics, healthcare, and advertising. It outlines types of machine learning, prevalent use cases, and specific model implementations such as logistic regression and random forests, along with performance metrics for evaluating models. Additionally, it highlights challenges faced in real-world applications and emphasizes the importance of data transformation and model training techniques.


![ict_presentation_final_final_final[1].pptx](https://cdn.slidesharecdn.com/ss_thumbnails/ictpresentationfinalfinalfinal1-251230145259-2b4839bd-thumbnail.jpg?width=640&height=640&fit=bounds)


