Download as PDF, PPTX

![TUG | Machine Learning with R and Tableau
Calculated Fields
Tableau Calculated Fields for R
18
SCRIPT_INT("
## Sets the seed
set.seed( .arg7[1])
## Studentizes the variables
day <- ( .arg1 - mean(.arg1) )/ sd(.arg1)
mos <- ( .arg2 - mean(.arg2) )/ sd(.arg2)
dis <- ( .arg3 - mean(.arg3) )/ sd(.arg3)
inc <- ( .arg4 - mean(.arg4) )/ sd(.arg4)
age <- ( .arg5 - mean(.arg5) )/ sd(.arg5)
dat <- cbind(day, mos, dis, inc, age)
day <- .arg6[1]
## Creates the clusters
kmeans(dat, day)$cluster
",
MIN([Days Since Last Order]),
[Months as Customer],
AVG([Discount]),
MAX([Income]),
MAX([Age]),
[clusters],
[seed]
)
K-means cluster for customer segmentation
SCRIPT_STR('hello <- "Hello TUG!"', ATTR([R
Result]))
Pass string to R with a parameter
SCRIPT_INT("as.integer(.arg1 * 2)", [R Variable])
Pass calculation to R based on parameter
SCRIPT_BOOL("
print('******************************************
*********************')
print('the vector sent was')
print(.arg1)
print('with length')
print(length(.arg1))
TRUE
",
SUM([Sales])
)
Print to console R arguments](https://image.slidesharecdn.com/machine-learning-r-tableau-160302225743/85/Machine-Learning-with-R-and-Tableau-18-320.jpg)

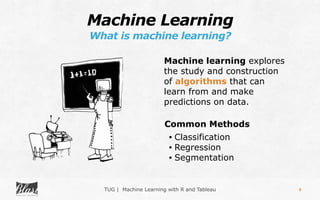
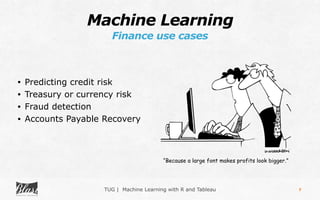
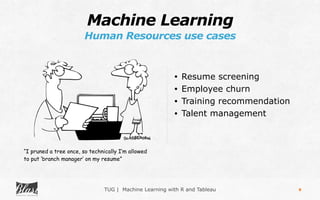
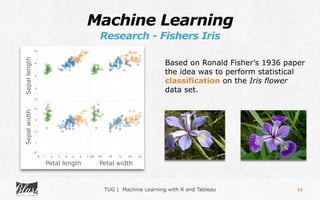
This document outlines a presentation on machine learning with R and Tableau. It discusses machine learning concepts and use cases in marketing, finance, and human resources. It then provides an introduction to R and how it can be used with Tableau for tasks like customer segmentation, forecasting, and calculating fields. The presentation concludes with questions.


![Conquering the perfect storm share[1]](https://cdn.slidesharecdn.com/ss_thumbnails/conqueringtheperfectstormshare1-170713124720-thumbnail.jpg?width=640&height=640&fit=bounds)