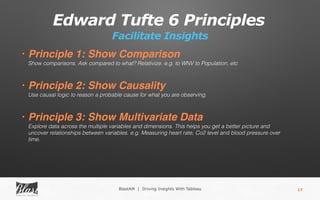
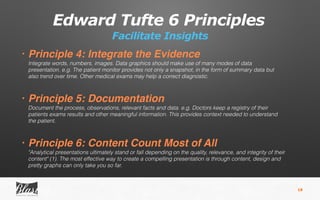
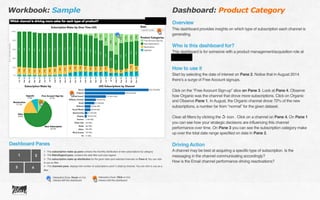
Driving Insights With Tableau
Blast Analytics & Marketing
Sacramento Tableau User Group
João Correia


@joaocorreia
Visual Insights
Change The Brain
2
• Many complex problems requires them
• Learning: Insights are more memorable than linear solutions
• Engagement: Insights activate deep engagement
• Systemic change: Insights change the brain
BlastAM | Driving Insights With Tableau
3BlastAM | Driving Insights With Tableau
4BlastAM | Driving Insights With Tableau
Visual Insights
Haha Moments
5
“Holy crap. This is the motherlode. This is going to be extraordinarily valuable in lots of
ways.
 
But after 5 minutes I can see that people who come to the 1-page guide want information
about and . People on our income/household page need information on
deductions.
 
This is a real breakthrough for us. Thanks so much for doing this, Joao!
 
I will share this with the rest of the content team.”
BlastAM | Driving Insights With Tableau
6
Executive ≠ Operational
BlastAM | Driving Insights With Tableau
Driving Tableau Adoption
BlastAM | Tableau & Data Analysis DTA
Data Analysis
7
EXECUTIVE
Executive
Driving Strategy
8
70,000 ft
• Broader Questions
• Monthly/Quarterly/Yearly resolution (drive strategy)
• Longer Range (identify medium/long term trends)
• Lower Granularity (high level metrics, less detail)
Observation & Strategic Role
BlastAM | Driving Insights With Tableau
Driving Tableau Adoption
BlastAM | Tableau & Data Analysis DTA
Data Analysis
9
OPERATIONAL
Operational
Driving Action
10
15,000 ft
Operational Role
• More Specific Questions
• Weekly and Daily time resolution (drive action through hypothesis)
• Shorter Range (identify what works and what doesn’t)
• Higher Granularity (more detail)
0 ft
BlastAM | Driving Insights With Tableau
Executive ≠ Operational
Driving Action with Tableau
11
Information should only be shared to whoever is
relevant and can take action.
Identify homogeneous groups, their questions and their goals. Where can they take action?

• Understand the company business and high-level goals
• Current reporting structure
• Company organizational chart
• Stakeholder interviews or informal conversations
BlastAM | Driving Insights With Tableau
The foundation: Questions
BlastAM | Driving Insights With Tableau
Driving Action with Tableau
12
• The most important thing in Data Science is the question
• Often data will limit or enable questions
• Having data can’t save you if you don’t have a question
"The data may not contain the answer. The combination of some data
and an aching desire for an answer does not ensure that a reasonable
answer can be extracted from a given body of data."
John Tukey
13
How are we doing on {metric}?
How fast is {metric} growing?
Is {metric} growing equally across regions?
Which regions most contributed to {metric}?
Which product categories most contributed to {metric}?
Which channels drive more/less {metric}?
Which campaigns drive less {metric}?
Which emails drive most {metric}?
70,000 ft
15,000 ft
0 ft
BlastAM | Driving Insights With Tableau
14
Do more of what works
and less of what doesn’t
BlastAM | Driving Insights With Tableau
BlastAM | Tableau & Data Analysis DTA 15
Drive Action
16
Design Principles
BlastAM | Driving Insights With Tableau
Edward Tufte 6 Principles
Facilitate Insights
17
• Principle 1: Show Comparison

Show comparisons. Ask compared to what? Relativize. e.g. to WNV to Population, etc 

• Principle 2: Show Causality

Use causal logic to reason a probable cause for what you are observing.

• Principle 3: Show Multivariate Data

Explore data across the multiple variables and dimensions. This helps you get a better picture and
uncover relationships between variables. e.g. Measuring heart rate, Co2 level and blood pressure over
time.

BlastAM | Driving Insights With Tableau
Edward Tufte 6 Principles
Facilitate Insights
18
• Principle 4: Integrate the Evidence

Integrate words, numbers, images. Data graphics should make use of many modes of data
presentation. e.g. The patient monitor provides not only a snapshot, in the form of summary data but
also trend over time. Other medical exams may help a correct diagnostic.

• Principle 5: Documentation

Document the process, observations, relevant facts and data. e.g. Doctors keep a registry of their
patients exams results and other meaningful information. This provides context needed to understand
the patient.

• Principle 6: Content Count Most of All

"Analytical presentations ultimately stand or fall depending on the quality, relevance, and integrity of their
content" (1). The most effective way to create a compelling presentation is through content, design and
pretty graphs can only take you so far.
Document & Educate
BlastAM | Tableau & Data Analysis DTA
Driving Action with Tableau
19
Takeaways
Driving Tableau Adoption
20
1. Get an executive sponsor
2. Identify executive and operational stakeholders
3. Identify goals and questions for each stakeholder
4. Relate questions to main goals
5. Get data
6. Create dashboards
7. Present insights as opportunities
8. Simplify Simplify Simplify
9. Document your visualizations
BlastAM | Driving Insights With Tableau
Phone (888) 252-7866 Email sales@blastam.comWeb www.blastam.com
Rocklin Office
6020 West Oaks Blvd., Ste. 260
Rocklin, CA 95765
San Francisco Office
625 Second Street, Suite 280
San Francisco, CA 94107
New York Office
261 Madison Ave, 9th Floor
New York, NY 10016
Seattle Office
500 Yale Avenue North
Seattle, WA 98109
Los Angeles Office
7083 Hollywood Boulevard
Los Angeles, CA 90028
@joaocorreia

Driving Insights with Tableau

  • 1.
    Driving Insights WithTableau Blast Analytics & Marketing Sacramento Tableau User Group João Correia
 
 @joaocorreia
  • 2.
    Visual Insights Change TheBrain 2 • Many complex problems requires them • Learning: Insights are more memorable than linear solutions • Engagement: Insights activate deep engagement • Systemic change: Insights change the brain BlastAM | Driving Insights With Tableau
  • 3.
    3BlastAM | DrivingInsights With Tableau
  • 4.
    4BlastAM | DrivingInsights With Tableau
  • 5.
    Visual Insights Haha Moments 5 “Holycrap. This is the motherlode. This is going to be extraordinarily valuable in lots of ways.   But after 5 minutes I can see that people who come to the 1-page guide want information about and . People on our income/household page need information on deductions.   This is a real breakthrough for us. Thanks so much for doing this, Joao!   I will share this with the rest of the content team.” BlastAM | Driving Insights With Tableau
  • 6.
    6 Executive ≠ Operational BlastAM| Driving Insights With Tableau
  • 7.
    Driving Tableau Adoption BlastAM| Tableau & Data Analysis DTA Data Analysis 7 EXECUTIVE
  • 8.
    Executive Driving Strategy 8 70,000 ft •Broader Questions • Monthly/Quarterly/Yearly resolution (drive strategy) • Longer Range (identify medium/long term trends) • Lower Granularity (high level metrics, less detail) Observation & Strategic Role BlastAM | Driving Insights With Tableau
  • 9.
    Driving Tableau Adoption BlastAM| Tableau & Data Analysis DTA Data Analysis 9 OPERATIONAL
  • 10.
    Operational Driving Action 10 15,000 ft OperationalRole • More Specific Questions • Weekly and Daily time resolution (drive action through hypothesis) • Shorter Range (identify what works and what doesn’t) • Higher Granularity (more detail) 0 ft BlastAM | Driving Insights With Tableau
  • 11.
    Executive ≠ Operational DrivingAction with Tableau 11 Information should only be shared to whoever is relevant and can take action. Identify homogeneous groups, their questions and their goals. Where can they take action?
 • Understand the company business and high-level goals • Current reporting structure • Company organizational chart • Stakeholder interviews or informal conversations BlastAM | Driving Insights With Tableau
  • 12.
    The foundation: Questions BlastAM| Driving Insights With Tableau Driving Action with Tableau 12 • The most important thing in Data Science is the question • Often data will limit or enable questions • Having data can’t save you if you don’t have a question "The data may not contain the answer. The combination of some data and an aching desire for an answer does not ensure that a reasonable answer can be extracted from a given body of data." John Tukey
  • 13.
    13 How are wedoing on {metric}? How fast is {metric} growing? Is {metric} growing equally across regions? Which regions most contributed to {metric}? Which product categories most contributed to {metric}? Which channels drive more/less {metric}? Which campaigns drive less {metric}? Which emails drive most {metric}? 70,000 ft 15,000 ft 0 ft BlastAM | Driving Insights With Tableau
  • 14.
    14 Do more ofwhat works and less of what doesn’t BlastAM | Driving Insights With Tableau
  • 15.
    BlastAM | Tableau& Data Analysis DTA 15 Drive Action
  • 16.
    16 Design Principles BlastAM |Driving Insights With Tableau
  • 17.
    Edward Tufte 6Principles Facilitate Insights 17 • Principle 1: Show Comparison
 Show comparisons. Ask compared to what? Relativize. e.g. to WNV to Population, etc 
 • Principle 2: Show Causality
 Use causal logic to reason a probable cause for what you are observing.
 • Principle 3: Show Multivariate Data
 Explore data across the multiple variables and dimensions. This helps you get a better picture and uncover relationships between variables. e.g. Measuring heart rate, Co2 level and blood pressure over time.
 BlastAM | Driving Insights With Tableau
  • 18.
    Edward Tufte 6Principles Facilitate Insights 18 • Principle 4: Integrate the Evidence
 Integrate words, numbers, images. Data graphics should make use of many modes of data presentation. e.g. The patient monitor provides not only a snapshot, in the form of summary data but also trend over time. Other medical exams may help a correct diagnostic.
 • Principle 5: Documentation
 Document the process, observations, relevant facts and data. e.g. Doctors keep a registry of their patients exams results and other meaningful information. This provides context needed to understand the patient.
 • Principle 6: Content Count Most of All
 "Analytical presentations ultimately stand or fall depending on the quality, relevance, and integrity of their content" (1). The most effective way to create a compelling presentation is through content, design and pretty graphs can only take you so far.
  • 19.
    Document & Educate BlastAM| Tableau & Data Analysis DTA Driving Action with Tableau 19
  • 20.
    Takeaways Driving Tableau Adoption 20 1.Get an executive sponsor 2. Identify executive and operational stakeholders 3. Identify goals and questions for each stakeholder 4. Relate questions to main goals 5. Get data 6. Create dashboards 7. Present insights as opportunities 8. Simplify Simplify Simplify 9. Document your visualizations BlastAM | Driving Insights With Tableau
  • 21.
    Phone (888) 252-7866Email sales@blastam.comWeb www.blastam.com Rocklin Office 6020 West Oaks Blvd., Ste. 260 Rocklin, CA 95765 San Francisco Office 625 Second Street, Suite 280 San Francisco, CA 94107 New York Office 261 Madison Ave, 9th Floor New York, NY 10016 Seattle Office 500 Yale Avenue North Seattle, WA 98109 Los Angeles Office 7083 Hollywood Boulevard Los Angeles, CA 90028 @joaocorreia