Download to read offline
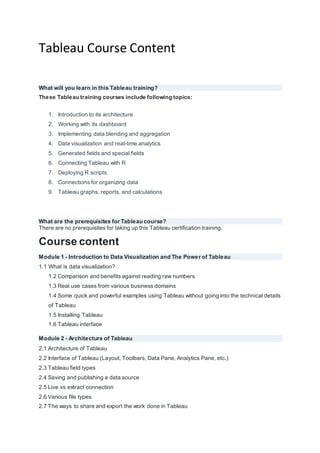
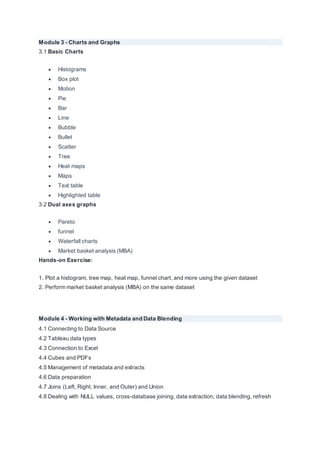

This document outlines the course content for a Tableau certification training program. The 13-module course covers topics such as Tableau architecture, dashboards, data visualization, data blending, mapping, calculations, parameters, and integrating Tableau with R. Students will learn various chart types, data preparation techniques, and how to build interactive dashboards and stories. Hands-on exercises are included to help students practice the skills learned. There are no prerequisites for taking the course.


![Data first with Tableau [FutureStack16]](https://cdn.slidesharecdn.com/ss_thumbnails/datafirsttableau-161201204510-thumbnail.jpg?width=640&height=640&fit=bounds)