Download as PDF, PPTX


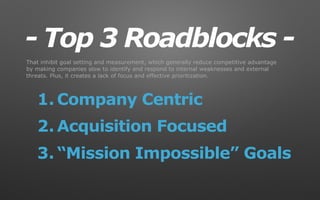


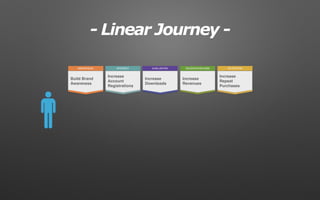
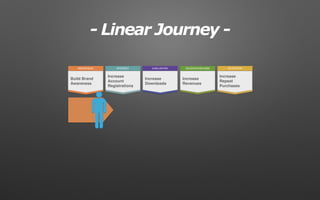
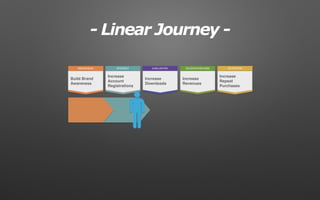
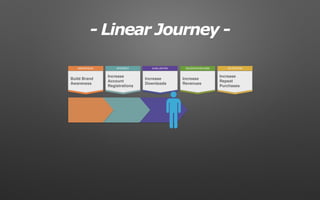
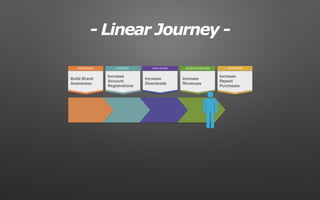
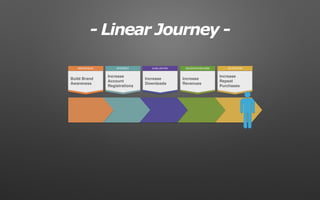
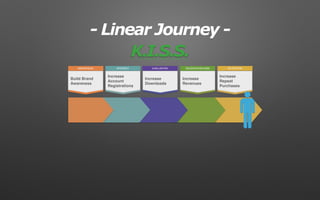

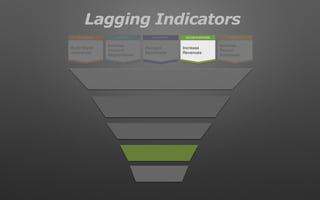
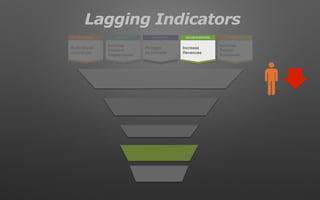
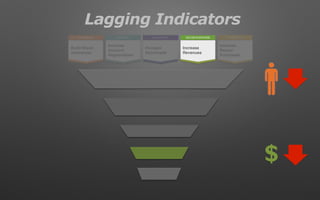
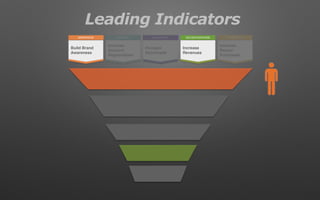
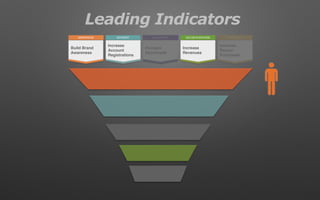
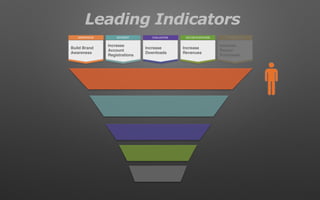
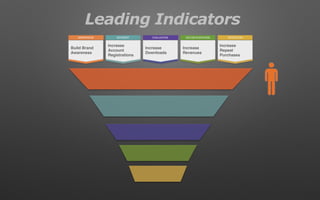


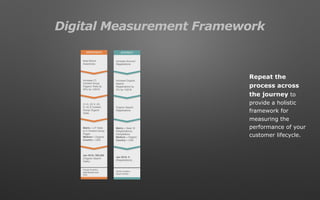
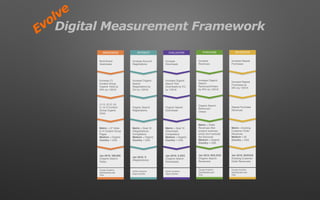
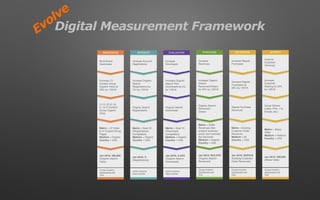
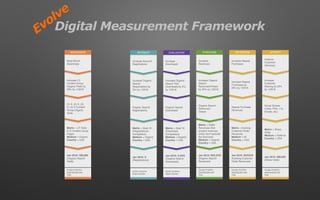
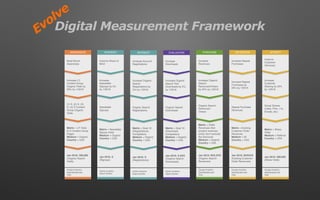
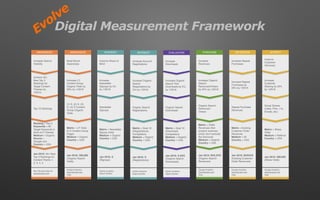


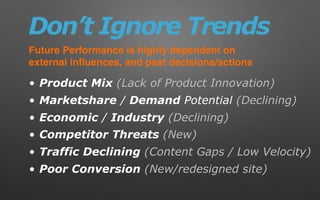
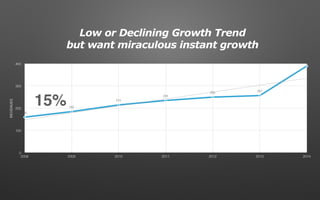
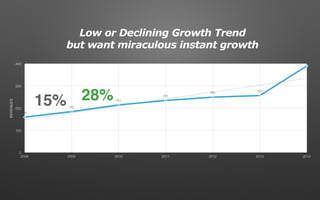
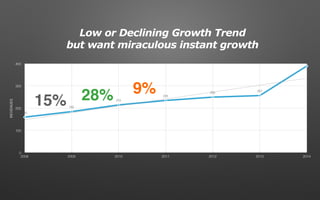
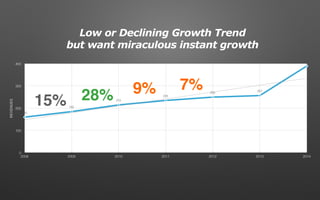
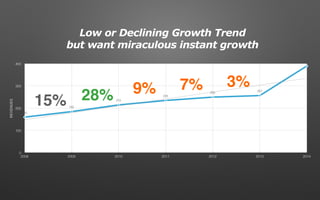
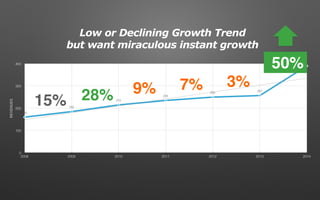
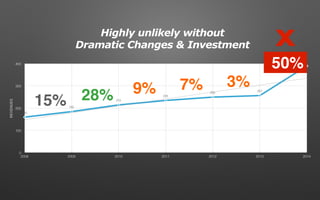
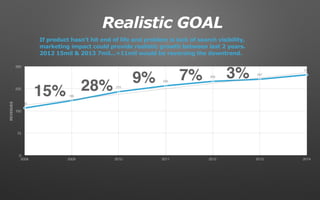
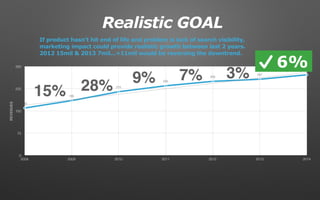

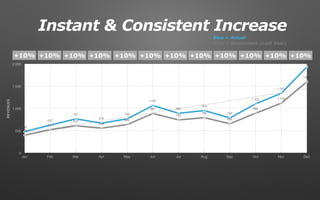


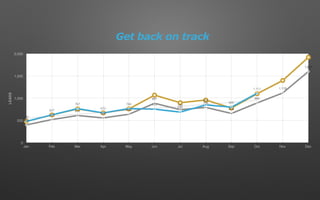
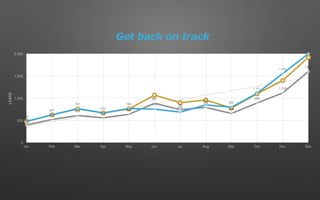

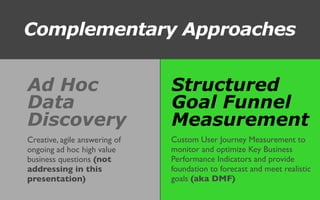

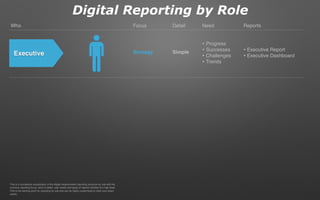


The document discusses goal setting in digital marketing, identifying key roadblocks such as company-centricity and unrealistic goals that hinder performance. It emphasizes the importance of focusing on the customer journey, utilizing both leading and lagging indicators to set realistic, measurable goals. The document promotes a structured approach to defining SMART goals across all stages of the customer lifecycle, ensuring alignment with broader business objectives.


