Downloaded 19 times
![Custom Variables
Take your analysis to the next level
Custom Variables in GA are name-value pair tags that you can use to refine GA tracking
and segment your traffic
Async Syntax:!_gaq.push(['_setCustomVar', slot_index, name, value, opt_scope]);
A few use-cases:
• Track logged-in users and what they do on your site in comparison to anonymous users.
• Track visitors that have signed up for your newsletter across multiple sessions to see how their
behavior compares to everyone else.
• Hook into Google Website Optimizer or other A/B and multi-variate testing tools to perform deeper
conversion analysis on tested changes.
• Increment a variable for each transaction and track behavior of first transaction versus multiple
transactions completed.
!](https://image.slidesharecdn.com/google-analytics-segmentation-visualization-customization-blastam-111026105557-phpapp01/85/Google-Analytics-Segmentation-Visualization-Customization-GA-Event-San-Francisco-2011-2-320.jpg)
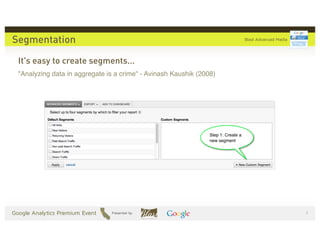
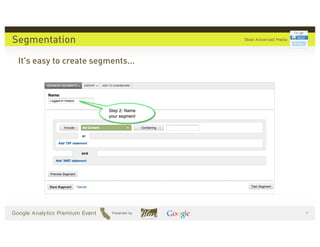
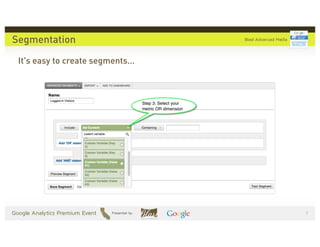
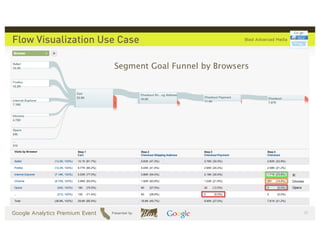
![Segmentation
Why Segment?
“Donʼt just log into [GA] and go on a fishing expedition...” - Avinash Kaushik
Acquisition Behavior Outcome
How are your efforts to acquire traffic Are visitors doing what you want
What are people doing on your site?
performing? them to do?
Examples
• Acquisition: Social media traffic
Tip: Mix and match these and segment the inverse.
• Behavior: Count of visits > 4
• Outcome: Visits with an average order value > $120
Result: Actionable Insight
Source: Avinash Kaushik - www.kaushik.net
(](https://image.slidesharecdn.com/google-analytics-segmentation-visualization-customization-blastam-111026105557-phpapp01/85/Google-Analytics-Segmentation-Visualization-Customization-GA-Event-San-Francisco-2011-9-320.jpg)
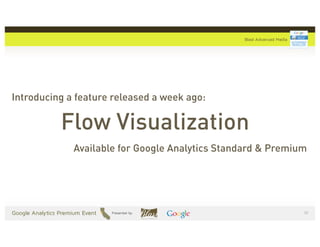
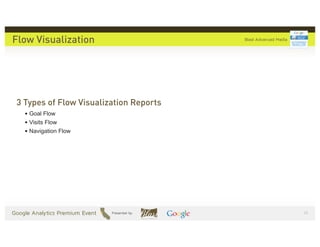
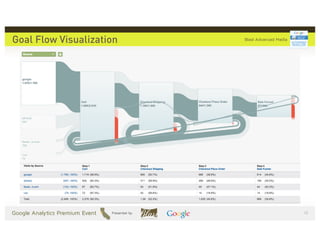
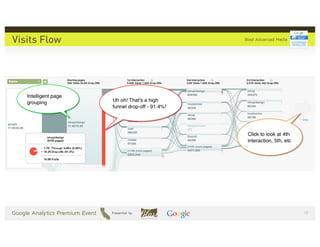
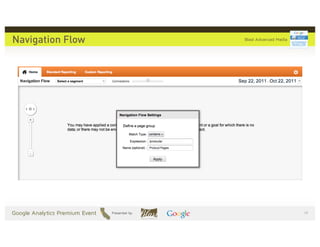
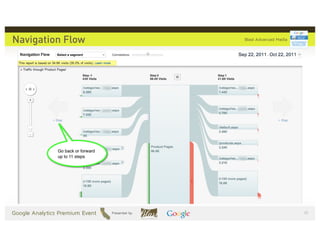
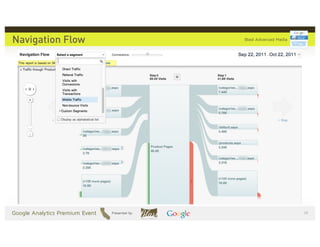

The document discusses the use of custom variables in Google Analytics (GA) to enhance tracking and segmentation of website traffic through name-value pair tags. It highlights various use cases such as tracking user behavior, analyzing newsletter sign-ups, and integrating with A/B testing tools for conversion analysis. Additionally, it emphasizes the importance of segmentation for actionable insights and introduces flow visualization as a new feature in GA.


