Download as PDF, PPTX


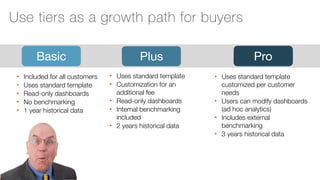

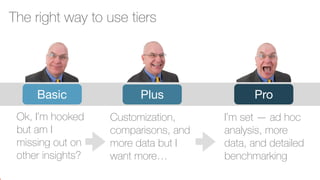


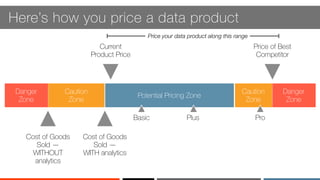


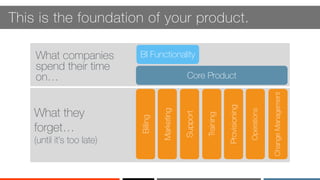


The document outlines the essential steps for building a data product, emphasizing the need for alignment among team members and understanding user needs. It details a structured approach that includes defining user personas, determining analytic tools, and establishing pricing strategies. Additionally, it stresses the importance of a robust support system and the iterative nature of the product development process.