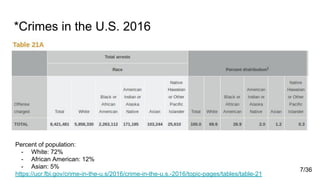
The document discusses interpretability in machine learning, emphasizing the challenges of black box models in providing transparency for predictions in fields such as credit scoring and medical diagnostics. It outlines the importance of understanding model decisions to prevent biases, improve models, and comply with regulations like GDPR, which grants rights to explanation for data subjects. Various methods for interpreting model predictions, including LIME and SHAP, are presented as tools to enhance model accountability and explainability.


![Confusions
A black box model may have a systematic bias or poor generalization
Is this a husky or wolf?
Example from [7]
8/36](https://image.slidesharecdn.com/dc02-180709154619/85/DC02-Interpretation-of-predictions-8-320.jpg)
![Global feature importance (tree ensembles)
This values are calculated for an entire dataset
● Gain -- total reduction of loss or impurity contributed by all splits for a given
feature [1]
● Split Count -- how many times a feature is used to split [2]
● Permutation is to randomly permute the values of a feature in the dataset and
then observe how the model quality change
● Cover represents the number of instances in tree node
[1] L. Breiman, J. Friedman and other. Classification and regression trees. CRC press, 1984.
[2] T. Chen, C. Guestrin. XGBoost: A scalable tree boosting system. ACM, 2016.
11/36](https://image.slidesharecdn.com/dc02-180709154619/85/DC02-Interpretation-of-predictions-11-320.jpg)
![Individualized (Local) methods
Computing feature importance values for each individual prediction
● LIME [7] (see also ELI5)
● SHAP [1,2]
● DeepLIFT [5] (Recursive prediction explanation method for deep learning)
● Layer-Wise Relevance Propagation [6] (predictions interpretation of deep networks)
● Attention-Based RNNs [8]
12/36](https://image.slidesharecdn.com/dc02-180709154619/85/DC02-Interpretation-of-predictions-12-320.jpg)

![SHAP: Additive feature attribution method
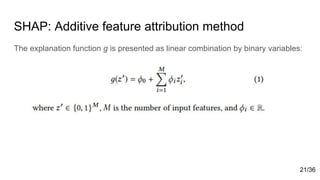
The explanation function g is presented as linear combination by binary variables[2]:
22/36](https://image.slidesharecdn.com/dc02-180709154619/85/DC02-Interpretation-of-predictions-22-320.jpg)
![SHAP values
For calculating SHAP values we combine conditional expectations of function
given variables and with Shapley values from the game theory
- S is the set of non-zero indexes in z`
- fx(S) = f(hx(z`)) = E[f(x) | xS] is expected value of the function conditioned on a
subset S of the input features
25/36](https://image.slidesharecdn.com/dc02-180709154619/85/DC02-Interpretation-of-predictions-25-320.jpg)
![SHAP: Theoretical proof
Methods not based on Shapley values
violate local accuracy and/or consistency
Authors[1] refer to Young(1985) paper, where demonstrated that Shapley values are the only set of values that
satisfy three axioms similar to Property 1 and 3. 26/36](https://image.slidesharecdn.com/dc02-180709154619/85/DC02-Interpretation-of-predictions-26-320.jpg)
![Kernel SHAP: Linear LIME + Shapley values
We can recover Shapley values using following equation
but we should pick specific form for , and [1]
27/36](https://image.slidesharecdn.com/dc02-180709154619/85/DC02-Interpretation-of-predictions-27-320.jpg)

![Sources
[1] A Unified Approach to Interpreting Model Predictions. – arXiv, 2017.
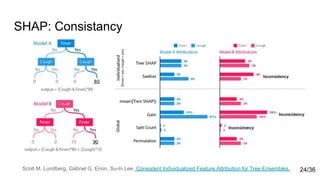
[2] Scott M. Lundberg, Gabriel G. Erion, Su-In Lee. Consistent Individualized Feature Attribution for Tree
Ensembles. – arXiv, 2018.
[3] B. Goodman, S. Flaxman. European Union regulations on algorithmic decision-making and a "right to
explanation". -- arXiv, 2016.
[4] P. Wu. GDPR and its impacts on machine learning applications. -- Medium, 2017.
[5] Shrikumar, P. Greenside, A. Kundaje. Learning important features through propagating activation
differences. arXiv preprint arXiv:1704.02685 (2017).
[6] Bach, Sebastian, et al. On pixel-wise explanations for non-linear classifier decisions by layer-wise
relevance propagation. PloS one 10.7 (2015): e0130140.
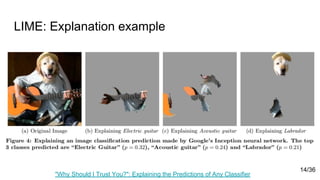
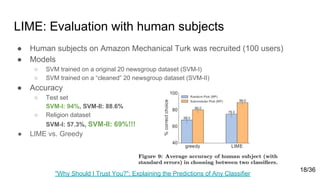
[7] M.T. Ribeiro, M. Tulio, S. Singh, C. Guestrin. "Why should i trust you?": Explaining the predictions
of any classifier. ACM, 2016.
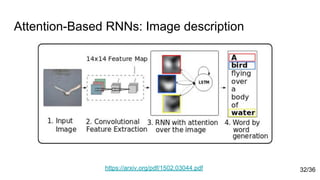
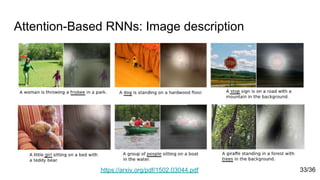
[8] K. Xu, J. Lei Ba, R. Kiros and other. Show, Attend and Tell: Neural Image Caption Generation with
Visual Attention. – arXiv, 2016.
36/36](https://image.slidesharecdn.com/dc02-180709154619/85/DC02-Interpretation-of-predictions-36-320.jpg)