Download to read offline


![Cost and Management Accounting
Notes
62 LOVELY PROFESSIONAL UNIVERSITY
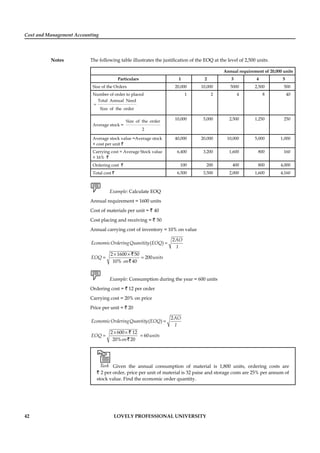
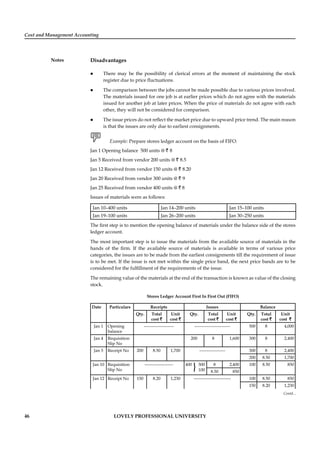
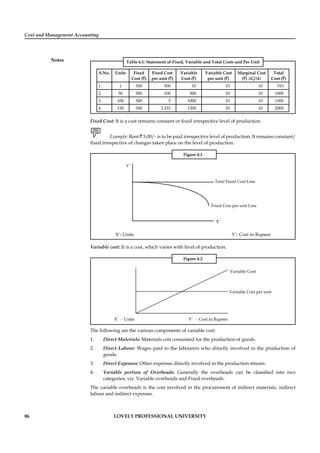
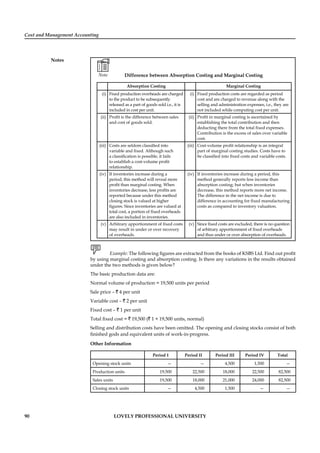
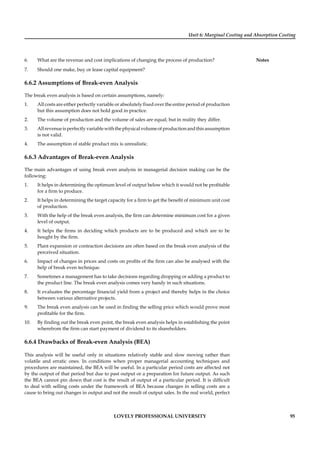
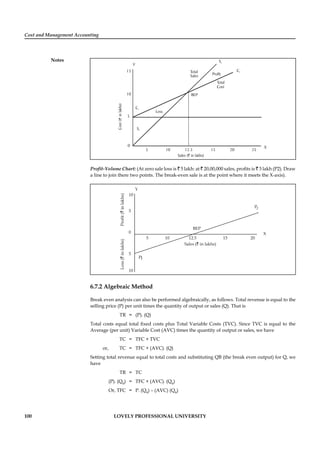
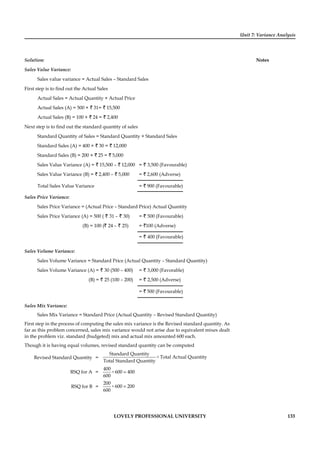
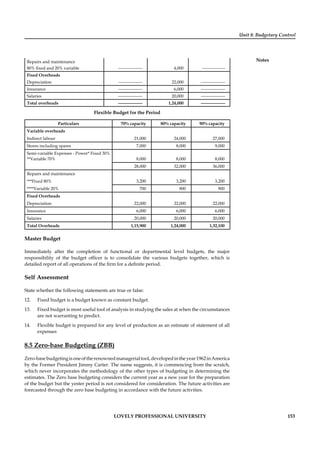
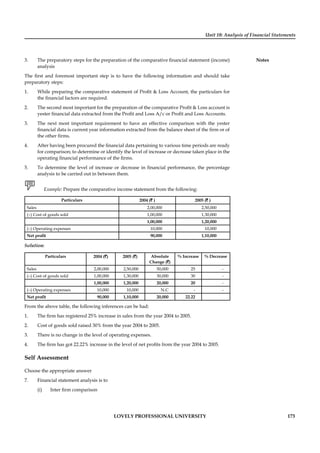
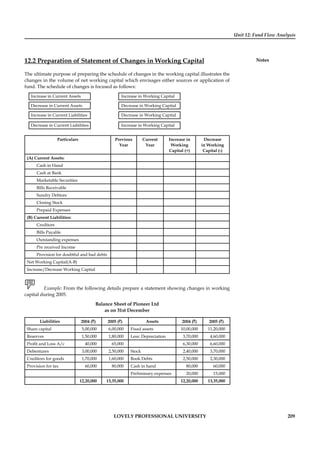
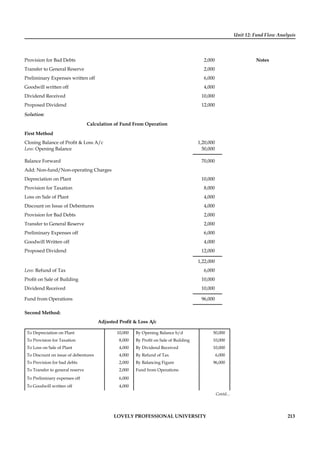
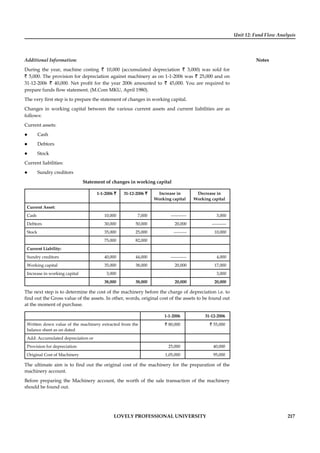
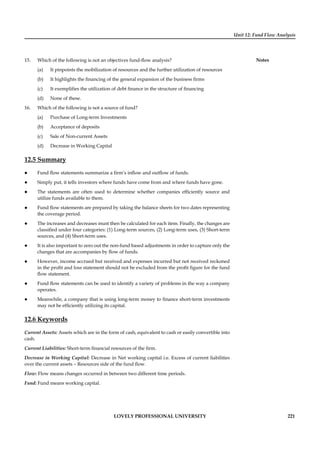
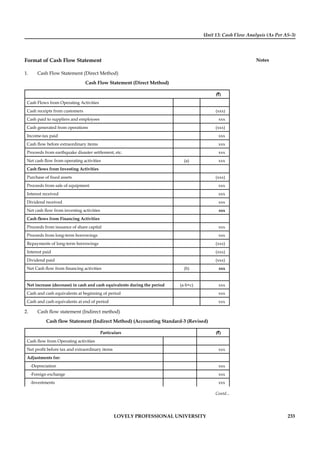
Halsey Premium Plan
Under this method, standard time for doing each job or operation is fixed and the worker is given
wages for the actual time to be taken to complete the job or operation at the agreed rate per hour,
plus a bonus equal to one half of the time saved. In practice, the bonus may vary from
1
33 %
3
to
2
62 %
3
of the wages of the time saved. Total earnings of the worker will be
TT × HR + ½ × TS × HR
TT = Time Taken
HR = Hourly Rate
TS = Time Saved
Time saved is the difference between Time Allowed (Standard Time) and Time Taken. Normal
wages may be ascertained and bonus may be added to arrive at total earnings.
Rowan Plan
Under this method, the worker is again guaranteed wages at the ordinary rate for the time taken
by him to complete the job or operation. The difference between Halsey plan and Rowan plan is
only in the calculation of the bonus. Bonus under this system will be calculated as:
TS/TA × Time Taken × Hourly Rate
The total earnings will be
TT × HR + [ (TA – TT) / TA] × TT × HR
TT = Time Taken
HR = Hourly Rate
TA = Time Allowed
Alternatively:
Normal wages + Bonus will be total earnings.
Therefore, Normal wages = Time Taken × Hourly Rate
Bonus = (Time Saved / Time allowed) × Normal Wages
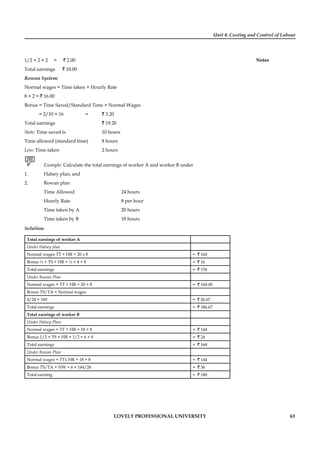
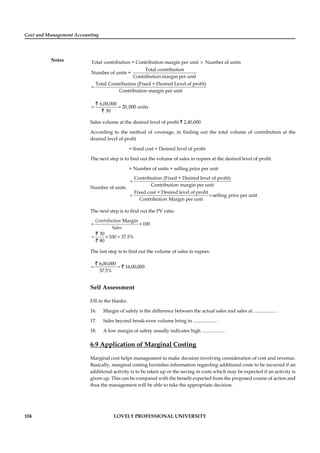
Example: From the following particulars, workout the earnings of a worker under:
1. Halsey premium system and
2. Rowan system
Standard time 10 hours
Standard Rate ` 2 per hour
Time Taken 8 hours
Solution:
Halsey Premium System:
Normal wages = Time taken × Hourly Rate
= 8 × 2 = ` 16.00
Bonus 50% of time saved.
1/2 × Time saved × Hourly Rate](https://image.slidesharecdn.com/lputextcostandmanagementaccounting-201030094135/85/Lpu-Text-cost-and-management_accounting-68-320.jpg)


![Unit 6: Marginal Costing and Absorption Costing
Notes
LOVELY PROFESSIONAL UNIVERSITY 97
6.7 Methods Decisions Involving Alternative Choices
The break even analysis can be performed by the following two methods:
1. Break Even Charts
2. Algebraic Method.
6.7.1 Break Even Chart
The difference between Price and Average Variable Cost (P – AVC) is defined as ‘profit
contribution’. That is, revenue on the sale of a unit of output after variable costs are covered
represents a contribution toward profit. At low rates of output, the firm may be losing money
because fixed costs have not yet been covered by the profit contribution. Thus, at these low rates
of output, profit contribution is used to cover fixed costs. After fixed costs are covered, the firm
will be earning a profit.
A manager may want to know the output rate necessary to cover all fixed costs and to earn a
“required” profit of R. Assume that both price and variable cost per unit of output (AVC) are
constant. Profit is equal to total revenue (P.Q.) less the sum of Total Variable Costs (Q.TVC) and
fixed costs. Thus
ΠR
= PQ – [(Q. AVC) + FC]
ΠR
= TR – TC
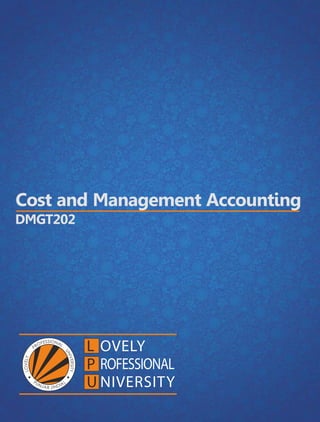
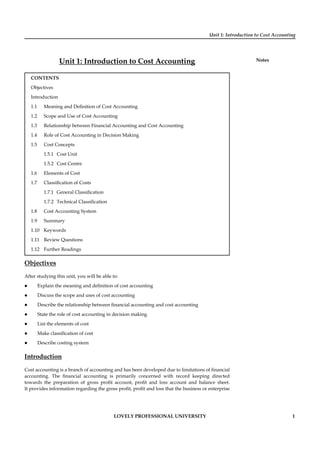
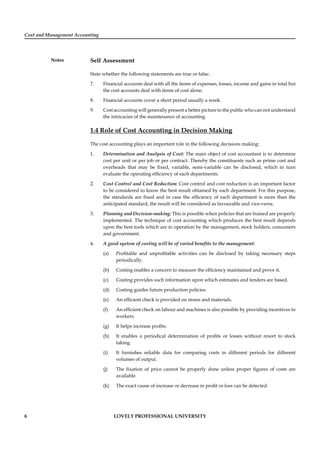
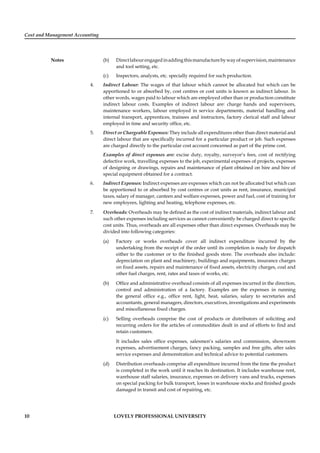
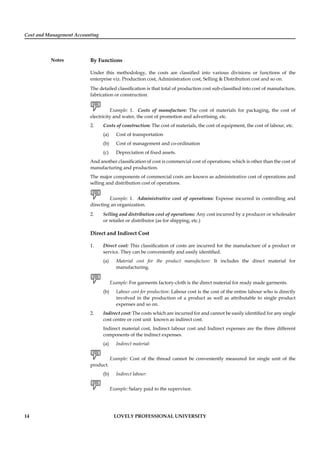
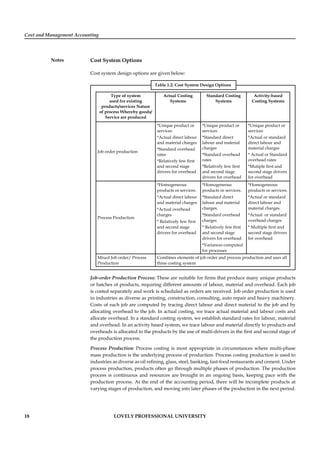
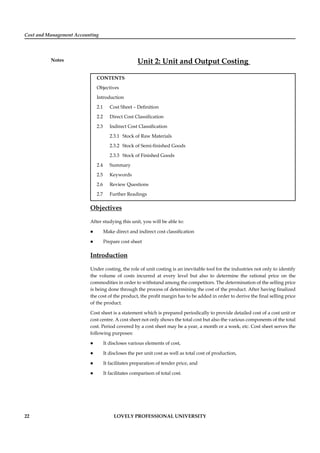
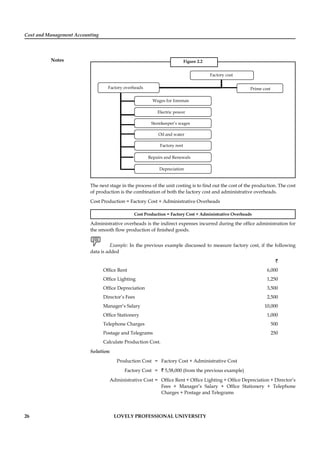
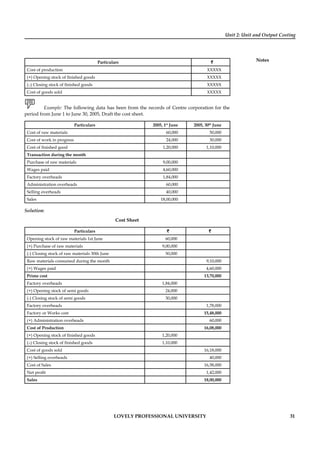
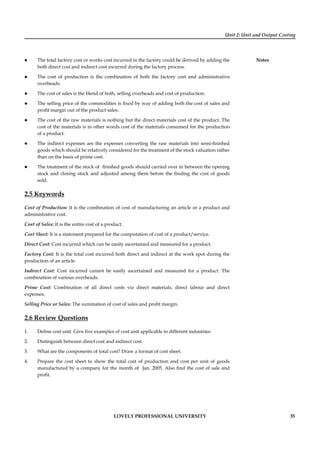
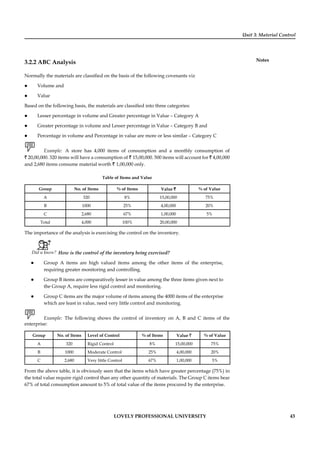
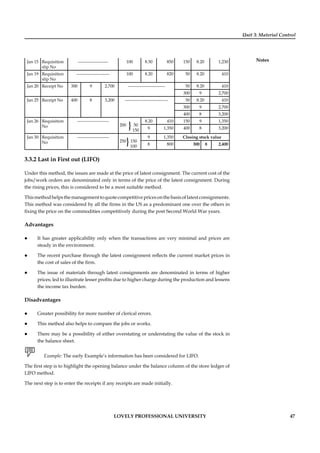
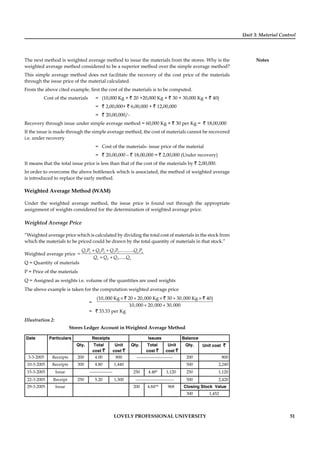
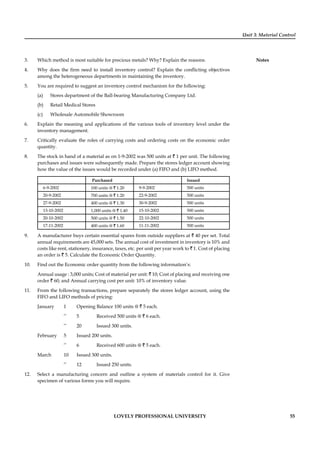
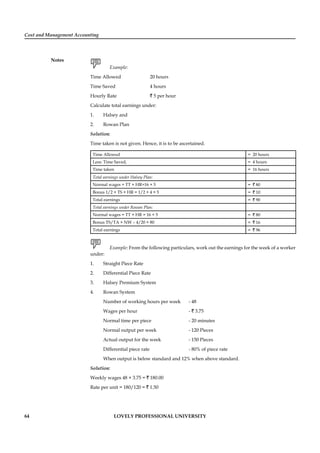
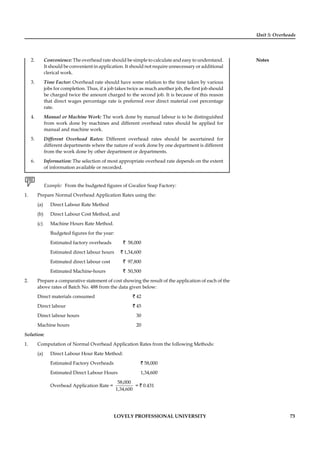
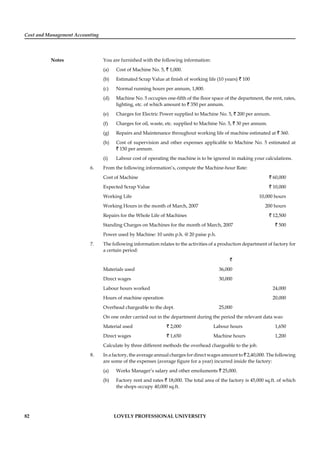
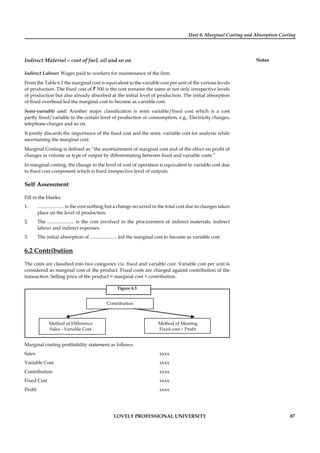
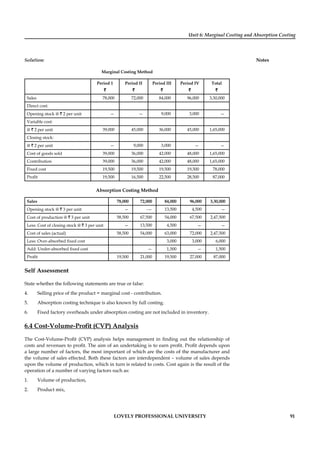
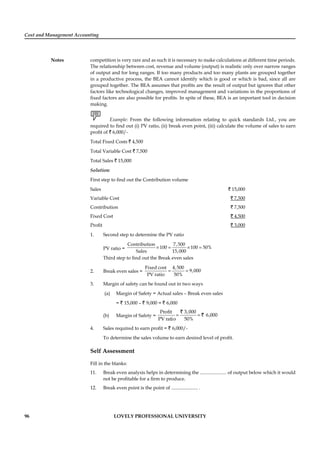
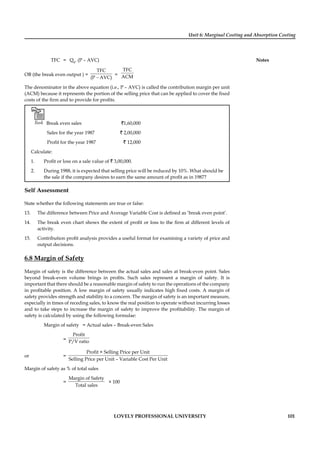
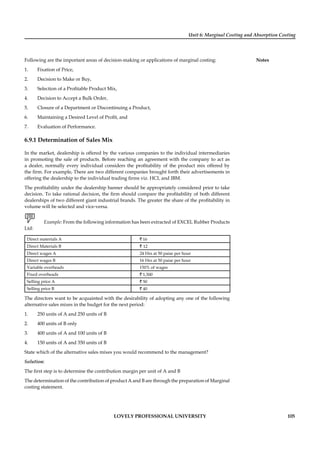
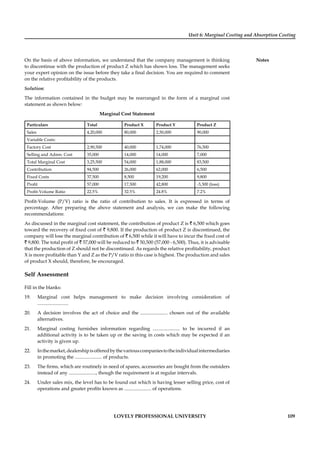
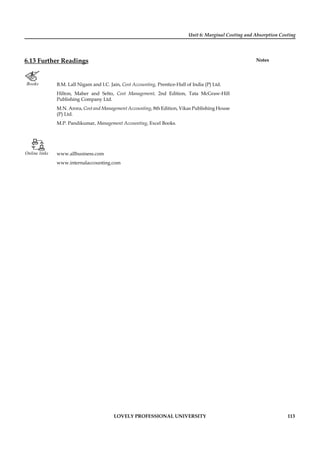
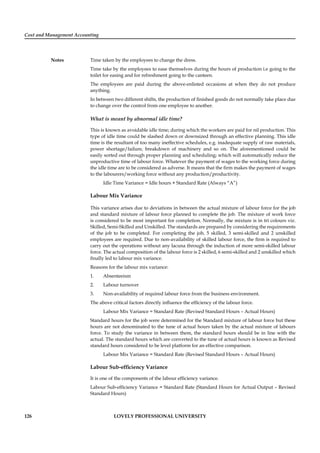
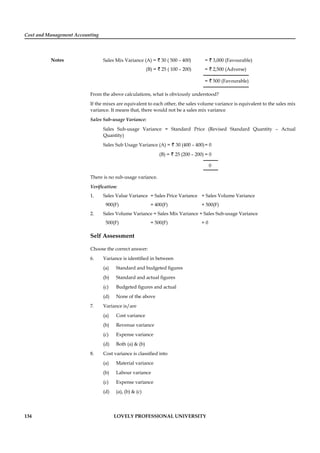
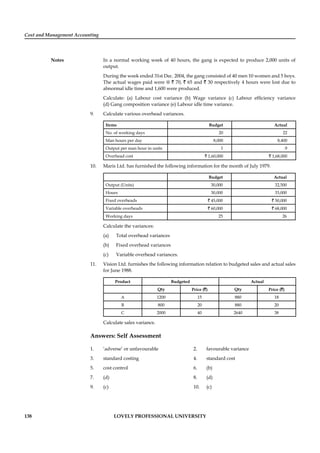
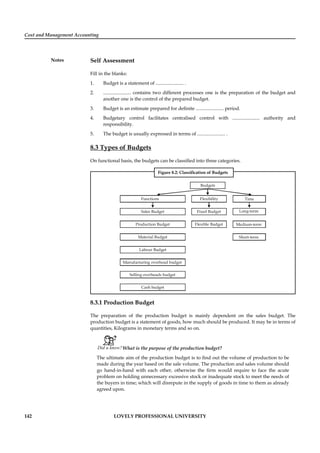
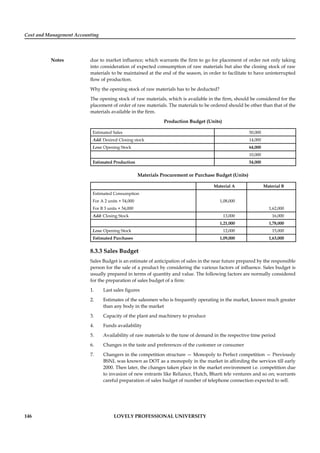
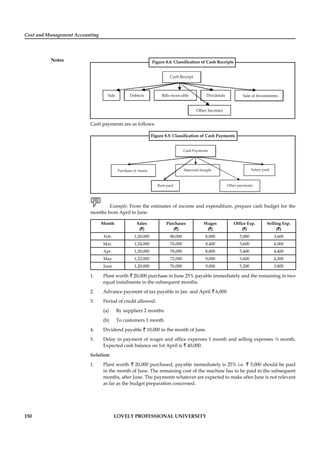
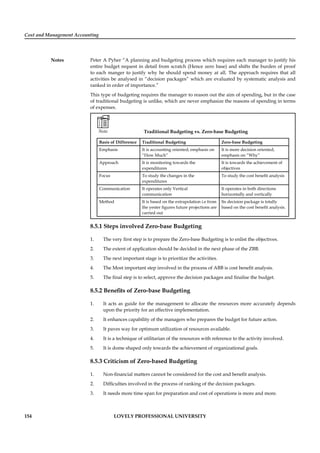
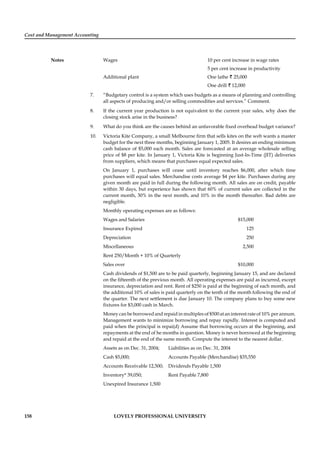
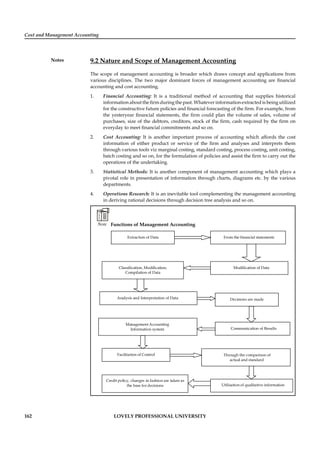
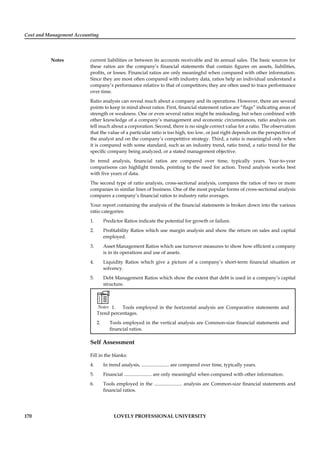
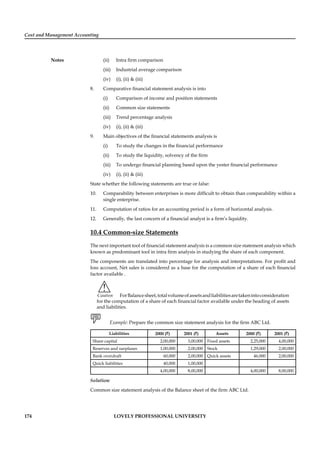
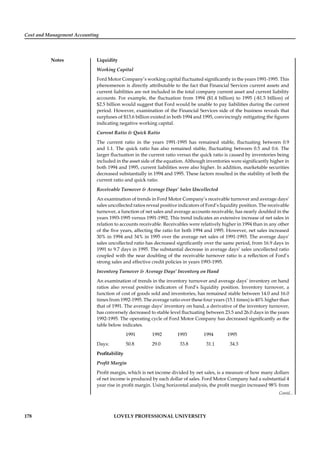
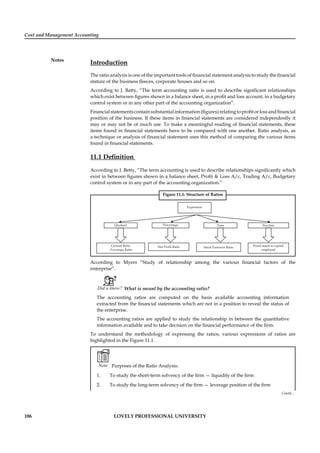
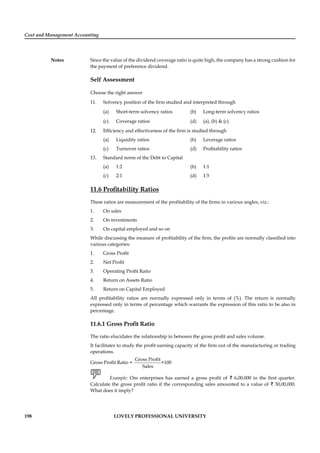
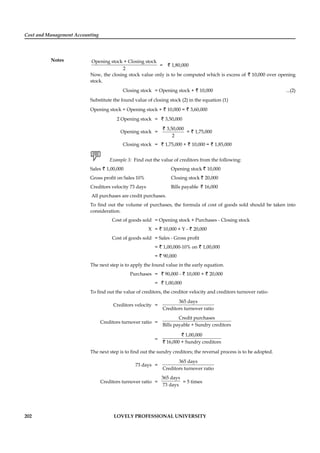
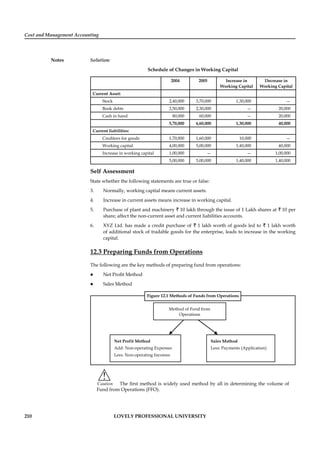
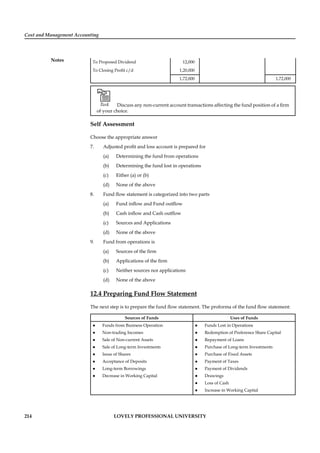
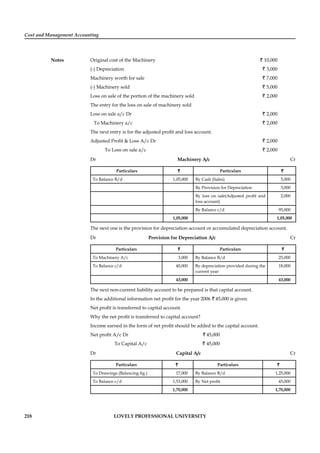
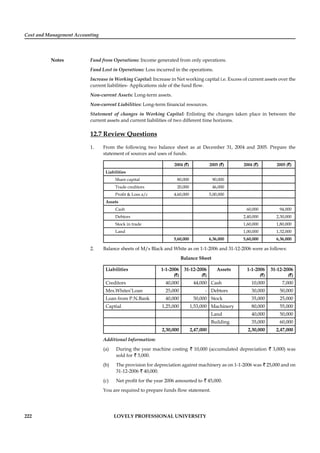
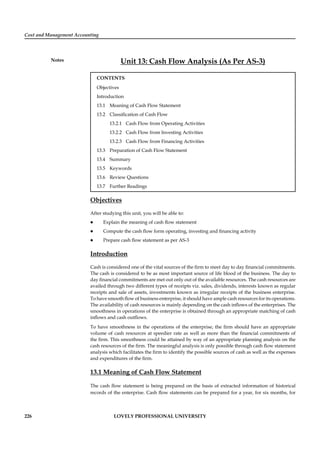
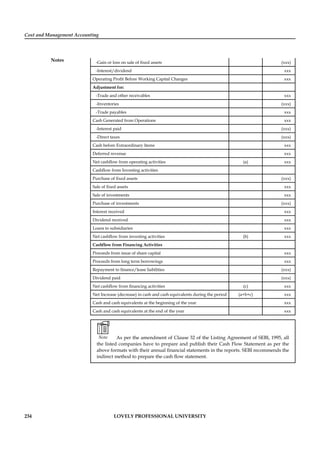
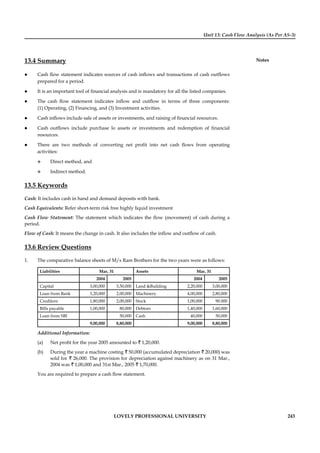
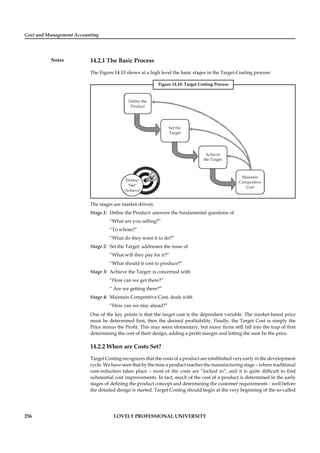
The break even chart shows the extent of profit or loss to the firm at different levels of activity.
A break even chart may be defined as an analysis in graphic form of the relationship of production
and sales to profit. The Break even analysis utilises a break even chart in which the Total Revenue
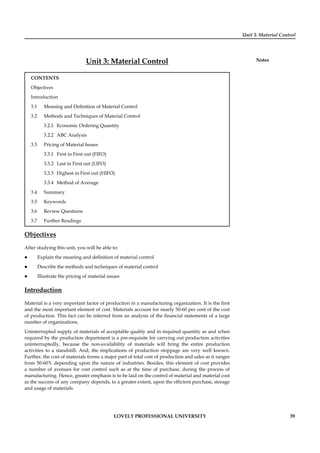
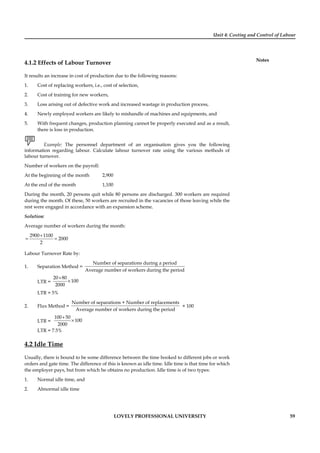
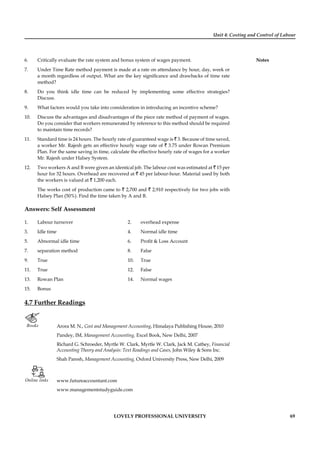
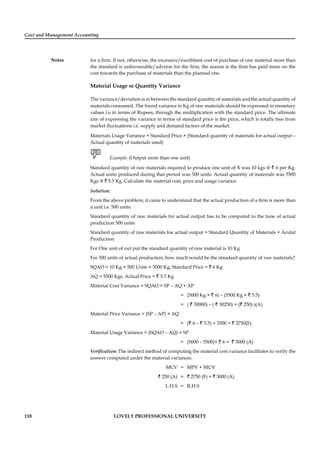
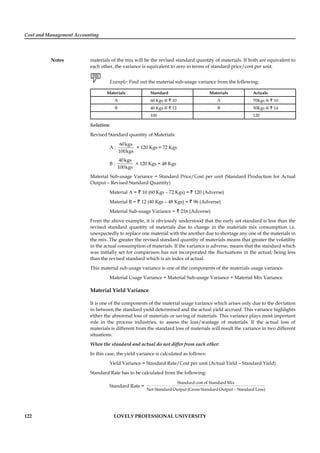
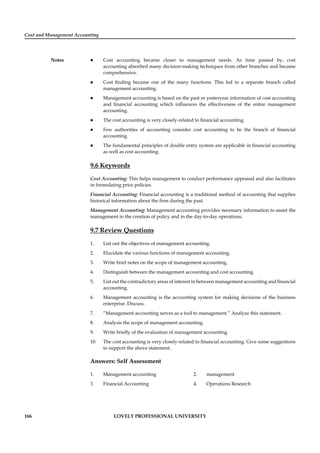
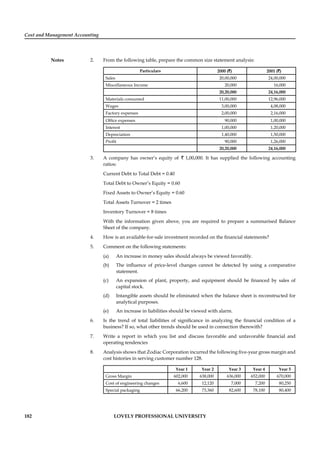
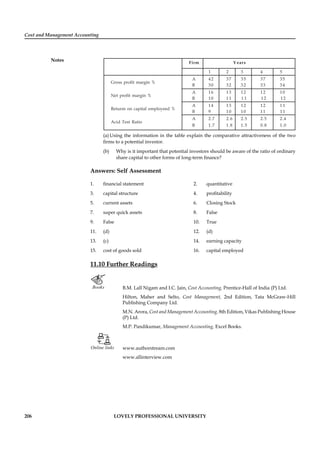
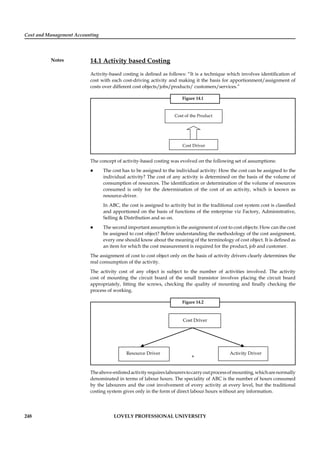
(TR) and the Total Cost (TC) curves are represented by straight lines, as in Figure 6.5.
Figure 6.5
`
In the figure total revenues and total costs are plotted on the vertical axis whereas output or sales
per time period are plotted on the horizontal axis. The slope of the TR curve refers to the constant
price at which the firm can sell its output. The TC curve indicates Total Fixed Costs (TFC) (The
vertical intercept) and a constant average variable cost (the slope of the TC curve). This is often
the case for many firms for small changes in output or sales. The firm breaks even (with TR=TC)
at Q1
(point B in the figure) and incurs losses at smaller outputs while earnings profits at higher
levels of output.
Both the Total Cost (TC) and Total Revenue (TR) curves are shown as linear. TR curve is linear as
it is assumed that the price is given, irrespective of the output level. Linearity of TC curve results
from the assumption of constant variable costs.](https://image.slidesharecdn.com/lputextcostandmanagementaccounting-201030094135/85/Lpu-Text-cost-and-management_accounting-103-320.jpg)

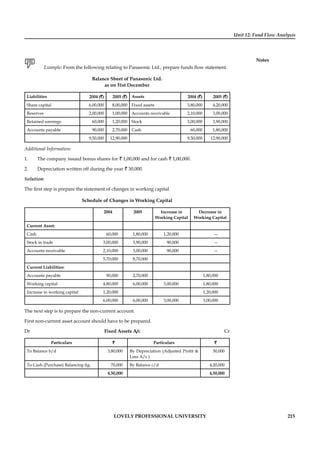

![Unit 13: Cash Flow Analysis (As Per AS-3)
Notes
LOVELY PROFESSIONAL UNIVERSITY 245
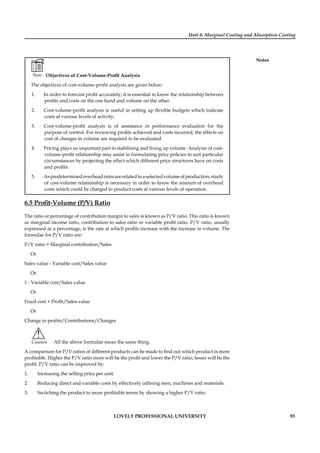
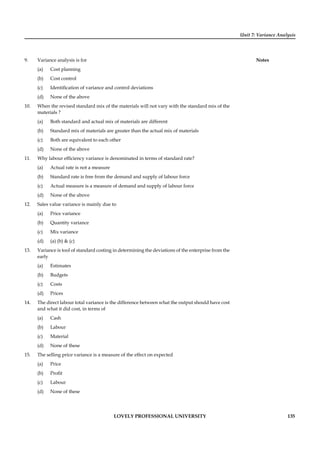
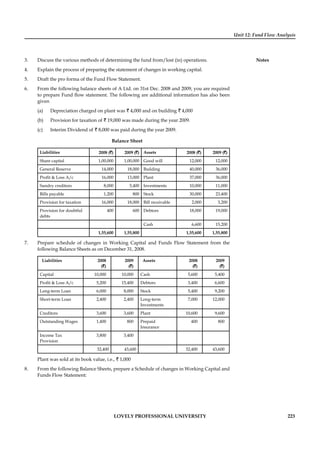
loss on sale of equipments 3600
126000
Net income before tax 342000
Provision of tax 117000
Net Income after tax 225000
Additional Information:
(a) Operating expenses include depreciation of ` 59400 and charges from preliminary
expenses of ` 3600.
(b) Land was sold at its book value.
(c) Cash dividend paid for the year 2006 amounted to ` 27000 and fully paid bonus
shares were given in the ratio of 2 shares for every 3 shares held.
(d) Interest expenses was paid in cash.
(e) Equipment with a cost of ` 298800 was purchased for cash .Equipment with a cost of
` 73800 (book value ` 64800) was sold for ` 61200.
(f) Debenture for ` 18000 were redeemed for cash and for ` 54000 were redeemed by
converting into equity shares at par value.
(g) Equity shares of ` 162000 were issued for cash at par.
(h) Income tax paid during the year amounted to ` 117000.
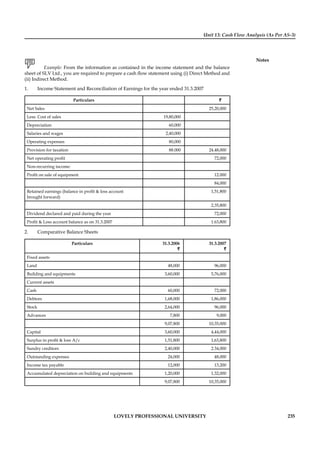
Prepare the cash flow statement with both the methods.
7. Determine which of the following are added back to [or subtracted from, as appropriate]
the net income figure (which is found on the Income Statement) to arrive at cash flows from
operations.
(a) Depreciation
(b) Deferred tax
(c) Amortization
(d) Any gains or losses associated with the sale of a non-current asset.
Support your answers with elaborative reasoning.
8. Assume that you are thinking of purchasing a new machine that will allow you to offer a
new product to your customers. The machine will cost ` 100,000 to purchase and install,
and after five years (when you plan to sell it) the machine will be worth about ` 10,000.
Your facility has plenty of room, so you won’t have any additional rental costs for space,
and you can piggyback advertising for the new product on to your existing advertising
budget. You will, however, have to pay for insurance, personal property taxes, and a part-
time employee to operate the machinery (these items are included in your fixed costs which
will total ` 12,000 in the first year). Also, there will be costs for materials, supplies, and
electricity that will vary depending on the volume of production. These variable costs will
amount to about 60 percent of the sales revenues. Develop a projected cash flow statement
for the project.
9. Think of the possible errors that might be committed while developing the cash flow
statements and suggest ways to prevent such mistakes beforehand.
10. Show by example how to prepare a cash flow statement using a balance sheet.](https://image.slidesharecdn.com/lputextcostandmanagementaccounting-201030094135/85/Lpu-Text-cost-and-management_accounting-251-320.jpg)
![Cost and Management Accounting
Notes
258 LOVELY PROFESSIONAL UNIVERSITY
It is very important to separate the optional features from the basic ones, because if you make
an optional feature – that only some customers want – part of the basic product, you will either
force all customers in that segment to pay for it, or you will be giving it away. It is also important
to establish – and achieve – the target cost for the basic product, because that is where most
of the sales or revenues will be and so that is where you have to capture market share while
remaining profitable. Finally, we contend that a Market-Feature Table should play as great a role
in determining the architecture of a product as do physical and engineering considerations.
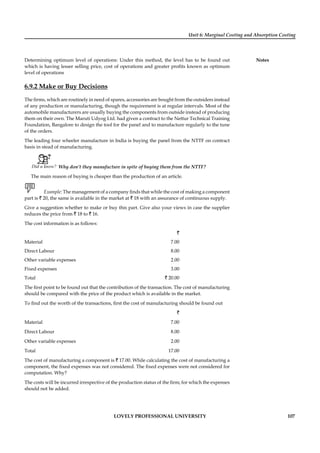
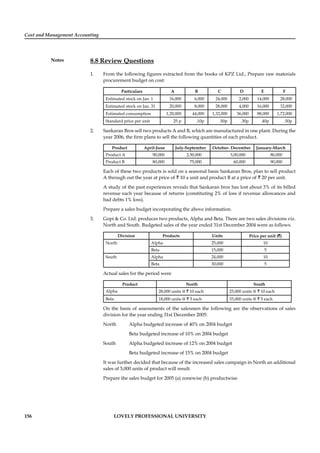
14.2.4 First, Price
Once you have established the high-level product requirements, the next step is to establish the
market price for the time at which the product is going to be sold. We have found that Experience
Curves (sometimes called Learning Curves) are very helpful. In this approach, the historical market
price of the product is plotted as a function, not of calendar time, but of the industry’s cumulative
sales of the product. On a log-log plot, the result is usually a straight line that is a very reliable
predictor of prices for some time into the future. Note that often you should not always use the
quantities of the product as the “sales”, but some key parameter that represents the functionality
that the customer is really buying and which is really driving the industry’s experience. For
example, in the famous “Moore Curve” showing the decrease in price of semiconductor memory,
the price per bit of memory is plotted against the cumulative bits that have been sold. (It is not a
plot of price per memory chip vs. the cumulative number of chips – the customers are really buying
memory bits, not packaged ICs.) If the product were cellular telephone network equipment, you
would plot the price of the equipment divided by the number of subscribers that it can serve vs.
the cumulative number of cell-phone subscribers in the world.
There are other ways to help triangulate on likely prices. Conjoint Analysis is quite quantitative,
and it gives insights about customers’ willingness to pay for various specific features and
capabilities. Other methods include gleaning information from bids and proposals, competitor’s
prices, reverse engineering, comparable technologies or products that do similar things, analyst’s
reports, and so on.
14.2.5 Then, Cost
When you have determined the price for the time when the product will be sold, you can set
the target cost. It is important to first decide how much of the company’s cost elements to
include. Traditionally, people have looked only at cost of goods sold (COGS), the cost of the raw
materials and purchased subsystems that go into a product plus the “conversion costs” (labor
and manufacturing overheads). In that case, you only need to know the healthy gross margin
rate required by the company in order to calculate the target cost ( = Price * [100% - G.M.%]).
However, we have found it better to try to capture as much of the company’s costs as possible
(e.g.: engineering, installation, transportation, tariffs & duties, R&D, marketing & sales, taxes,
etc.) If you use the company’s required net margin then you can establish a full-stream target
cost. The benefit is that, as ways to reach the target cost are explored, it is possible that design
and other choices can significantly reduce costs that lie beyond the area of COGS. It goes without
saying that Activity-Based Costing (ABC), if the company uses it, makes this cost decomposition
more meaningful and effective.
Once you have set the overall target cost, the next step is to set cost targets for each of the
components, subsystems and elements that go into making up the set of full-stream costs that
are being included. We have found that Value Engineering is a valuable tool to assist in this step.
Space does not permit a detailed explanation here. But the basic concept is to create a matrix that
relates different product features to the various elements that make up the product. The cells of
the matrix are filled with the extent (percent) to which each of the elements contributes to each
feature. Then, knowing the relative importance (to the customers) of each feature, and applying
some matrix multiplication it is possible to get a suggestion of the cost target for each product](https://image.slidesharecdn.com/lputextcostandmanagementaccounting-201030094135/85/Lpu-Text-cost-and-management_accounting-264-320.jpg)


This document provides an overview of the syllabus for a course on Cost and Management Accounting. The syllabus covers 14 units, including introductions to cost accounting, unit and output costing, material control, labor costing, overhead allocation, variance analysis, budgetary control, financial statement analysis, and recent developments in cost management. The objectives of the course are to familiarize students with cost concepts, costing methods, and tools for financial analysis and cost control.