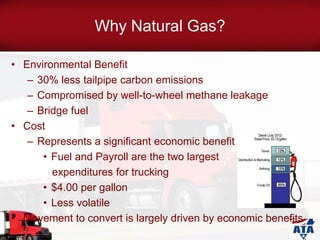
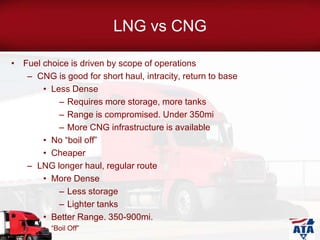
LNG Use in Trucking
P. Sean Garney
Policy Analyst
American Trucking Associations
Agenda
• Why Natural Gas
• LNG vs CNG
• Considering a change
• Fueling Infrastructure
• Industry Momentum
• The future
Why Natural Gas?
Why Natural Gas?
• Environmental Benefit
– 30% less tailpipe carbon emissions
– Compromised by well-to-wheel methane leakage
– Bridge fuel
• Cost
– Represents a significant economic benefit
• Fuel and Payroll are the two largest
expenditures for trucking
• $4.00 per gallon
• Less volatile
• Movement to convert is largely driven by economic benefits
LNG vs CNG
• Fuel choice is driven by scope of operations
– CNG is good for short haul, intracity, return to base
• Less Dense
– Requires more storage, more tanks
– Range is compromised. Under 350mi
– More CNG infrastructure is available
• No “boil off”
• Cheaper
– LNG longer haul, regular route
• More Dense
– Less storage
– Lighter tanks
• Better Range. 350-900mi.
• “Boil Off”
LNG Special Considerations
• Vehicle Cost
• Estimates range. 40-80K premium
• Engine Type/Availability
• Spark Vs Compression
• Compression Pros: Power, fuel economy,
better well to wheel emission reduction
• Compression Cons: Heavier, Requires
Diesel and DEF Tank, After-treatment
maintenance required, more expensive
• Spark Pros: No after-treatment , Lighter, No
diesel or DEF required
• Spark Cons: Less efficient, additional
maintenance
LNG Special Considerations
• Weight/space penalty
• Range – Up to 850 mi.
• Maintenance Cost
• Maintenance facility upgrades
• Tax Penalty
• Fuel Tax
• FET
• Fuel Availability
• Resale
• ROI
LNG ROI
• ROI is dependent on
– Fleet Turnover
• Many large fleets aim for 4 years
– Mileage Driven
– Fuel Price
• At $3.00 diesel, economics break even
LNG’s Best Application
• Hub and Spoke
– Centrally fueled
– Predictable routes
– Private refueling infrastructure
• Established Freight Corridors
– Must be regular route
– Must be medium range (500-700 miles)
Fueling Infrastructure
• Chicken and Egg
– Public build-out has begun
• Clean Energy – 100-125 stations by end 2013
– 70 in 33 states last year (waiting for trucks)
– Many co-located at Pilot Flying J Truck Stops
• TA/Shell – 200 Lanes in 100 locations
• Love’s Travel Stops – Balanced CNG Distribution
approach
• Encana – 1 public station, experimenting with mobile
LNG refueling
• ENN – Plans for 50 stations by end of 2013
Fleet Adoption of LNG
• UPS –
– April announcement 700 LNG truck purchase
– June announcement 285 additional trucks
• Nine additional fueling stations
• Ryder –
– 300 natural gas powered trucks
– 2 fueling stations, plans for 4 more
– Also building maintenance facilities
• Waste Management
– 1,700 CNG Vehicles
• Creates own Natural BioGas
Fleet Adoption
• Many other fleets in the testing phase
• Shipper Pressure
– Proctor & Gamble: 20% of freight hauled in next
2 years
• 8 carriers under contract
– Owens Corning: 22 lanes under contract for
natural gas users
– Office Depot: Dedicated Philly to Chicago
– May shift fuel surcharge paradigm
The Future
• More Engines become available
– 11.9 L 2013, 6.7 L 2015, 15L Spark 2015
• More trucks will be sold (Estimates vary)
– Low case: 4% by 2017
– High case: 15% by 2017
• Distant Future
– Low case: 40% by 2050
– High case: 48% by 2050.
The Future
• EIA
– LNG prices 40% below diesel for Next 30 years
– Natural gas as a fuel for vehicles will rise 12% per year
through 2040
– 700,000 million bbl/day displaced by 2040
– Will be 6% of total highway energy mix by 2040
Thank You
Contact:
P. Sean Garney
703.838.8804
sgarney@trucking.org

Lng use in trucking

  • 1.
    LNG Use inTrucking P. Sean Garney Policy Analyst American Trucking Associations
  • 2.
    Agenda • Why NaturalGas • LNG vs CNG • Considering a change • Fueling Infrastructure • Industry Momentum • The future
  • 3.
  • 4.
    Why Natural Gas? •Environmental Benefit – 30% less tailpipe carbon emissions – Compromised by well-to-wheel methane leakage – Bridge fuel • Cost – Represents a significant economic benefit • Fuel and Payroll are the two largest expenditures for trucking • $4.00 per gallon • Less volatile • Movement to convert is largely driven by economic benefits
  • 5.
    LNG vs CNG •Fuel choice is driven by scope of operations – CNG is good for short haul, intracity, return to base • Less Dense – Requires more storage, more tanks – Range is compromised. Under 350mi – More CNG infrastructure is available • No “boil off” • Cheaper – LNG longer haul, regular route • More Dense – Less storage – Lighter tanks • Better Range. 350-900mi. • “Boil Off”
  • 6.
    LNG Special Considerations •Vehicle Cost • Estimates range. 40-80K premium • Engine Type/Availability • Spark Vs Compression • Compression Pros: Power, fuel economy, better well to wheel emission reduction • Compression Cons: Heavier, Requires Diesel and DEF Tank, After-treatment maintenance required, more expensive • Spark Pros: No after-treatment , Lighter, No diesel or DEF required • Spark Cons: Less efficient, additional maintenance
  • 7.
    LNG Special Considerations •Weight/space penalty • Range – Up to 850 mi. • Maintenance Cost • Maintenance facility upgrades • Tax Penalty • Fuel Tax • FET • Fuel Availability • Resale • ROI
  • 8.
    LNG ROI • ROIis dependent on – Fleet Turnover • Many large fleets aim for 4 years – Mileage Driven – Fuel Price • At $3.00 diesel, economics break even
  • 9.
    LNG’s Best Application •Hub and Spoke – Centrally fueled – Predictable routes – Private refueling infrastructure • Established Freight Corridors – Must be regular route – Must be medium range (500-700 miles)
  • 10.
    Fueling Infrastructure • Chickenand Egg – Public build-out has begun • Clean Energy – 100-125 stations by end 2013 – 70 in 33 states last year (waiting for trucks) – Many co-located at Pilot Flying J Truck Stops • TA/Shell – 200 Lanes in 100 locations • Love’s Travel Stops – Balanced CNG Distribution approach • Encana – 1 public station, experimenting with mobile LNG refueling • ENN – Plans for 50 stations by end of 2013
  • 11.
    Fleet Adoption ofLNG • UPS – – April announcement 700 LNG truck purchase – June announcement 285 additional trucks • Nine additional fueling stations • Ryder – – 300 natural gas powered trucks – 2 fueling stations, plans for 4 more – Also building maintenance facilities • Waste Management – 1,700 CNG Vehicles • Creates own Natural BioGas
  • 12.
    Fleet Adoption • Manyother fleets in the testing phase • Shipper Pressure – Proctor & Gamble: 20% of freight hauled in next 2 years • 8 carriers under contract – Owens Corning: 22 lanes under contract for natural gas users – Office Depot: Dedicated Philly to Chicago – May shift fuel surcharge paradigm
  • 13.
    The Future • MoreEngines become available – 11.9 L 2013, 6.7 L 2015, 15L Spark 2015 • More trucks will be sold (Estimates vary) – Low case: 4% by 2017 – High case: 15% by 2017 • Distant Future – Low case: 40% by 2050 – High case: 48% by 2050.
  • 14.
    The Future • EIA –LNG prices 40% below diesel for Next 30 years – Natural gas as a fuel for vehicles will rise 12% per year through 2040 – 700,000 million bbl/day displaced by 2040 – Will be 6% of total highway energy mix by 2040
  • 15.
    Thank You Contact: P. SeanGarney 703.838.8804 sgarney@trucking.org