Downloaded 1,173 times

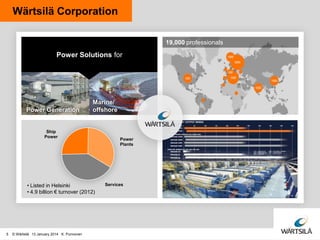
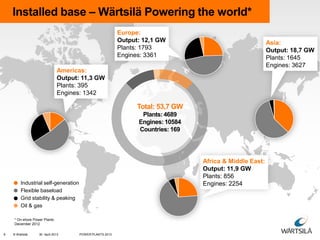
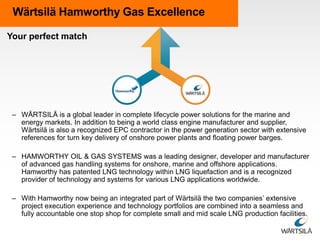
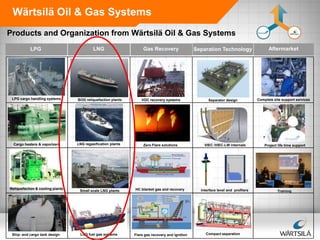
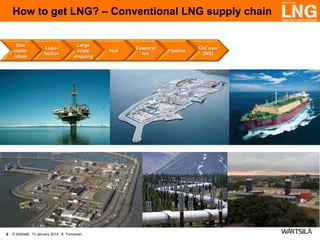
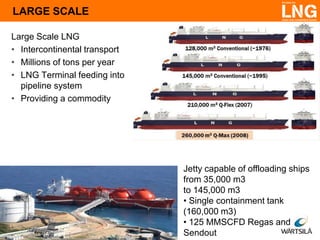

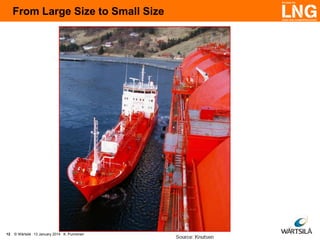
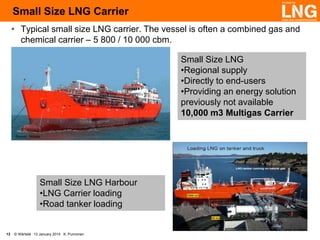
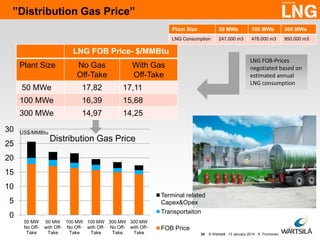
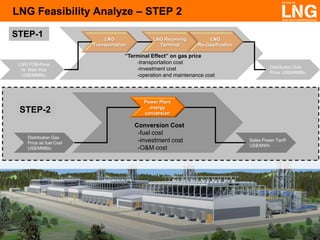
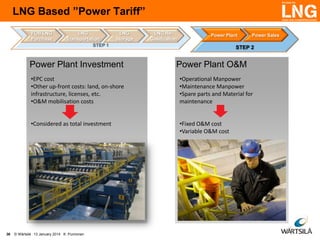
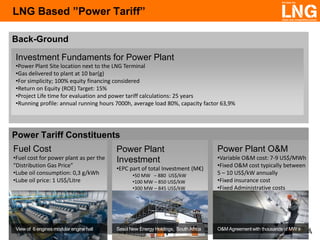

The document presents an overview of small and medium-sized LNG (liquefied natural gas) solutions for power generation, detailing Wärtsilä's capabilities and offerings in this sector. It includes information on LNG supply chains, terminal operations, technical specifications for power plants, and feasibility analyses for investments in LNG infrastructure. The document emphasizes the importance of natural gas as a fuel and provides insights into LNG consumption, costs, and overall lifecycle power solutions.


![Getting Started with Apache Spark: Big Data Made Simple [Free Meetup]](https://cdn.slidesharecdn.com/ss_thumbnails/apachesparkgettingstarted-260203175547-8361bcc3-thumbnail.jpg?width=640&height=640&fit=bounds)


