Downloaded 372 times
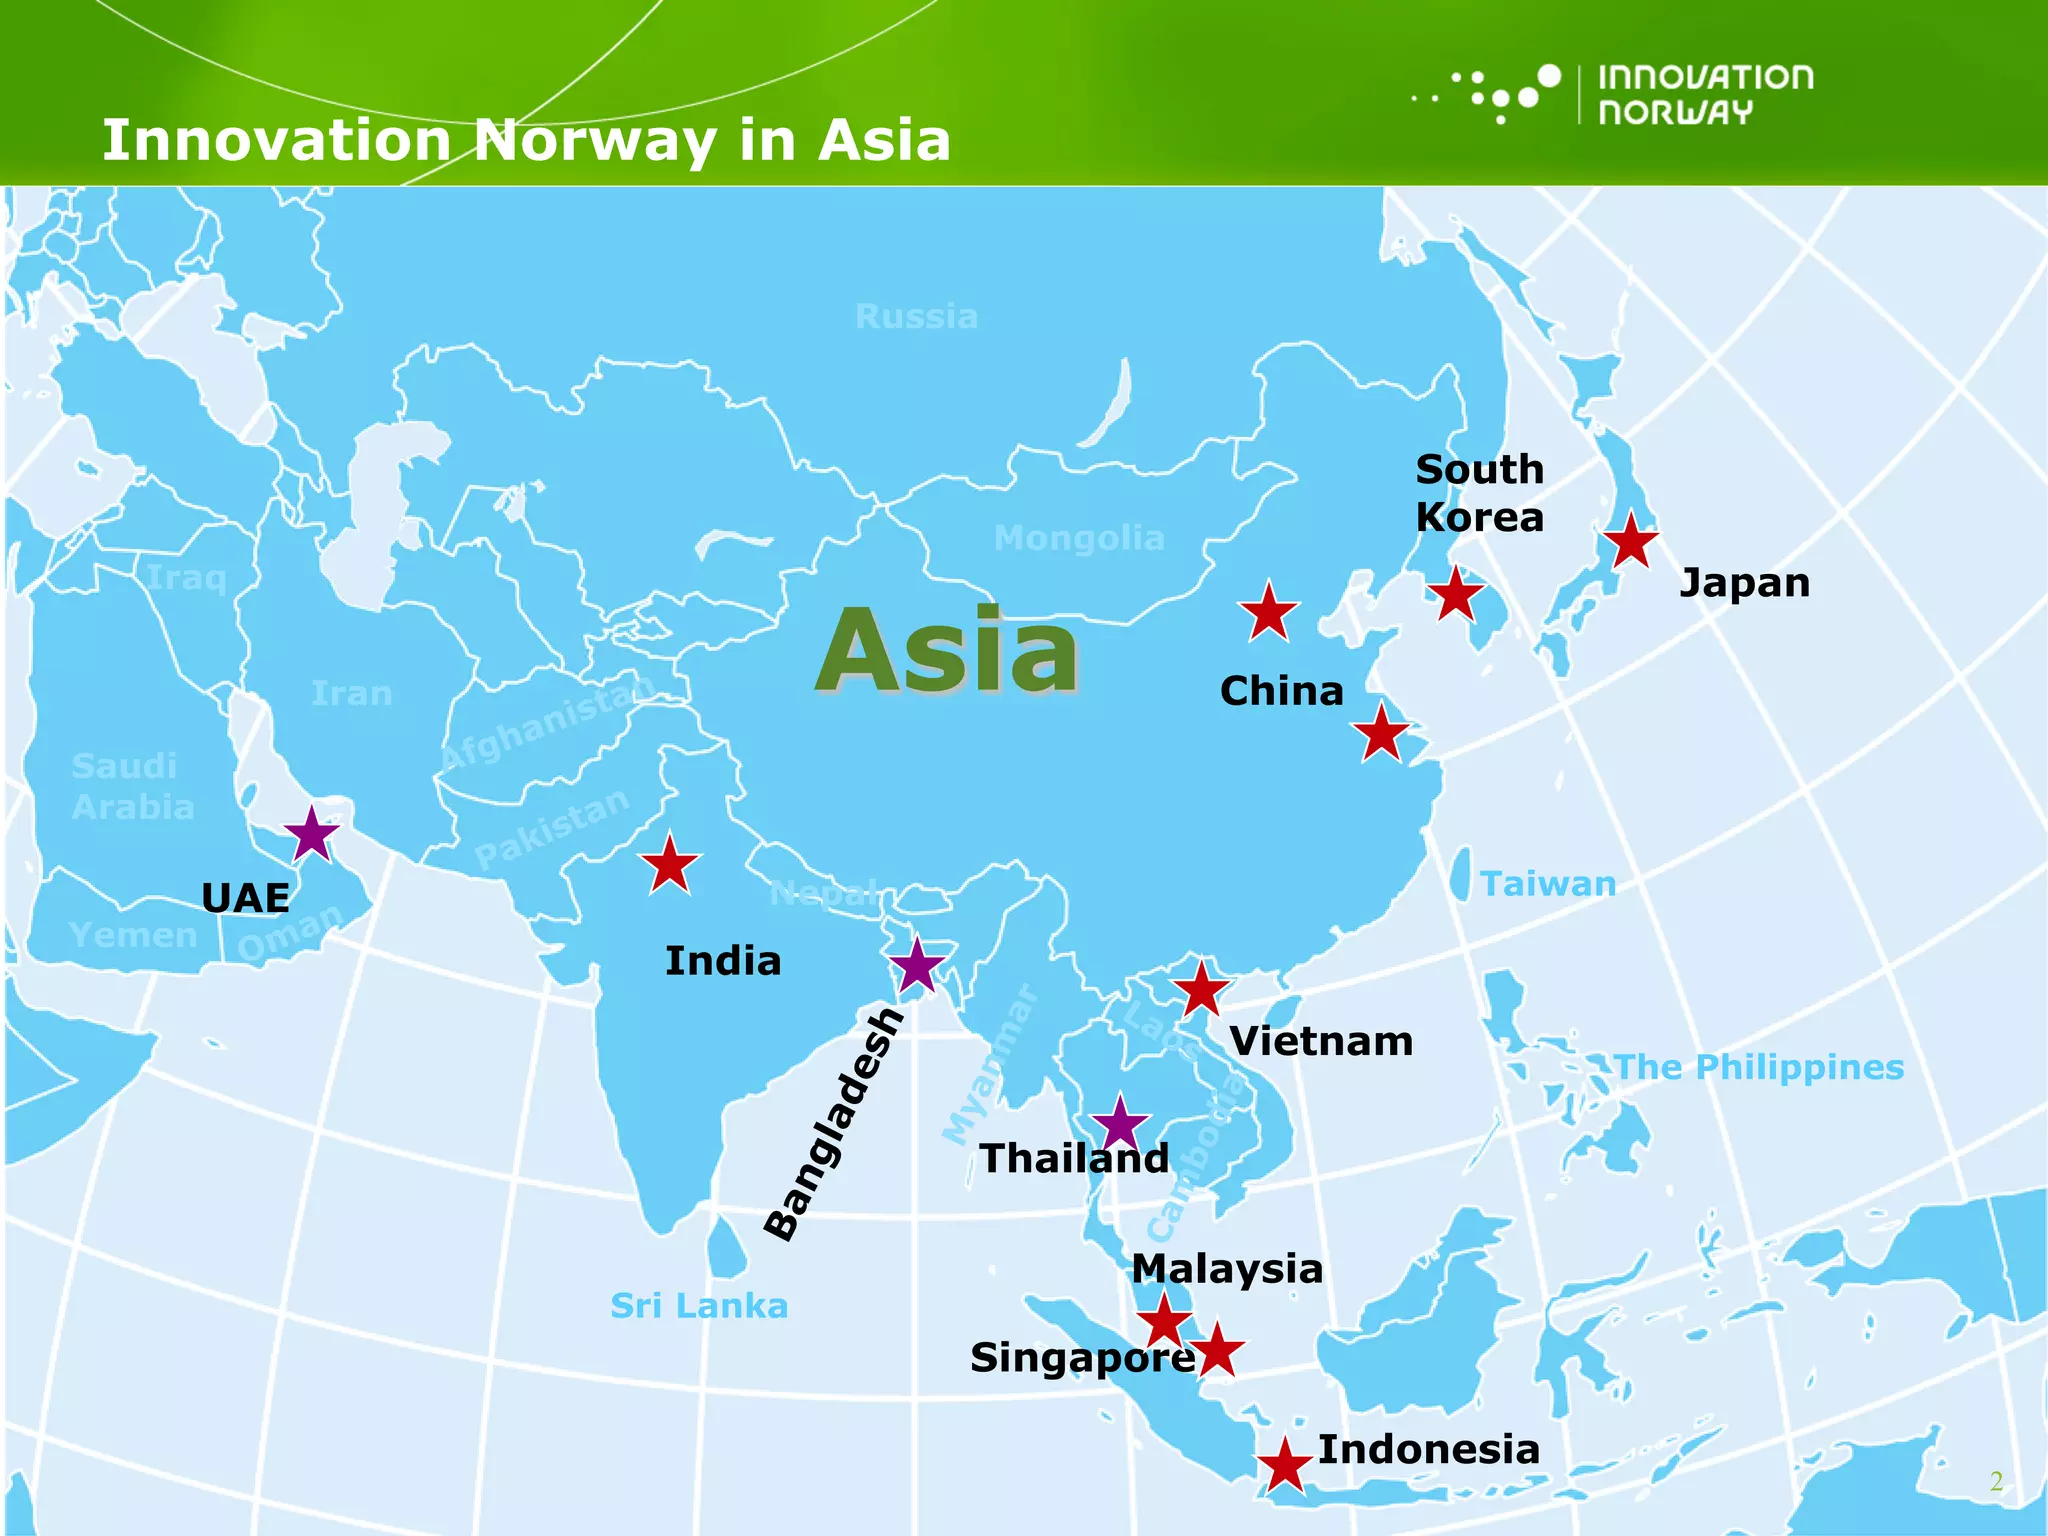

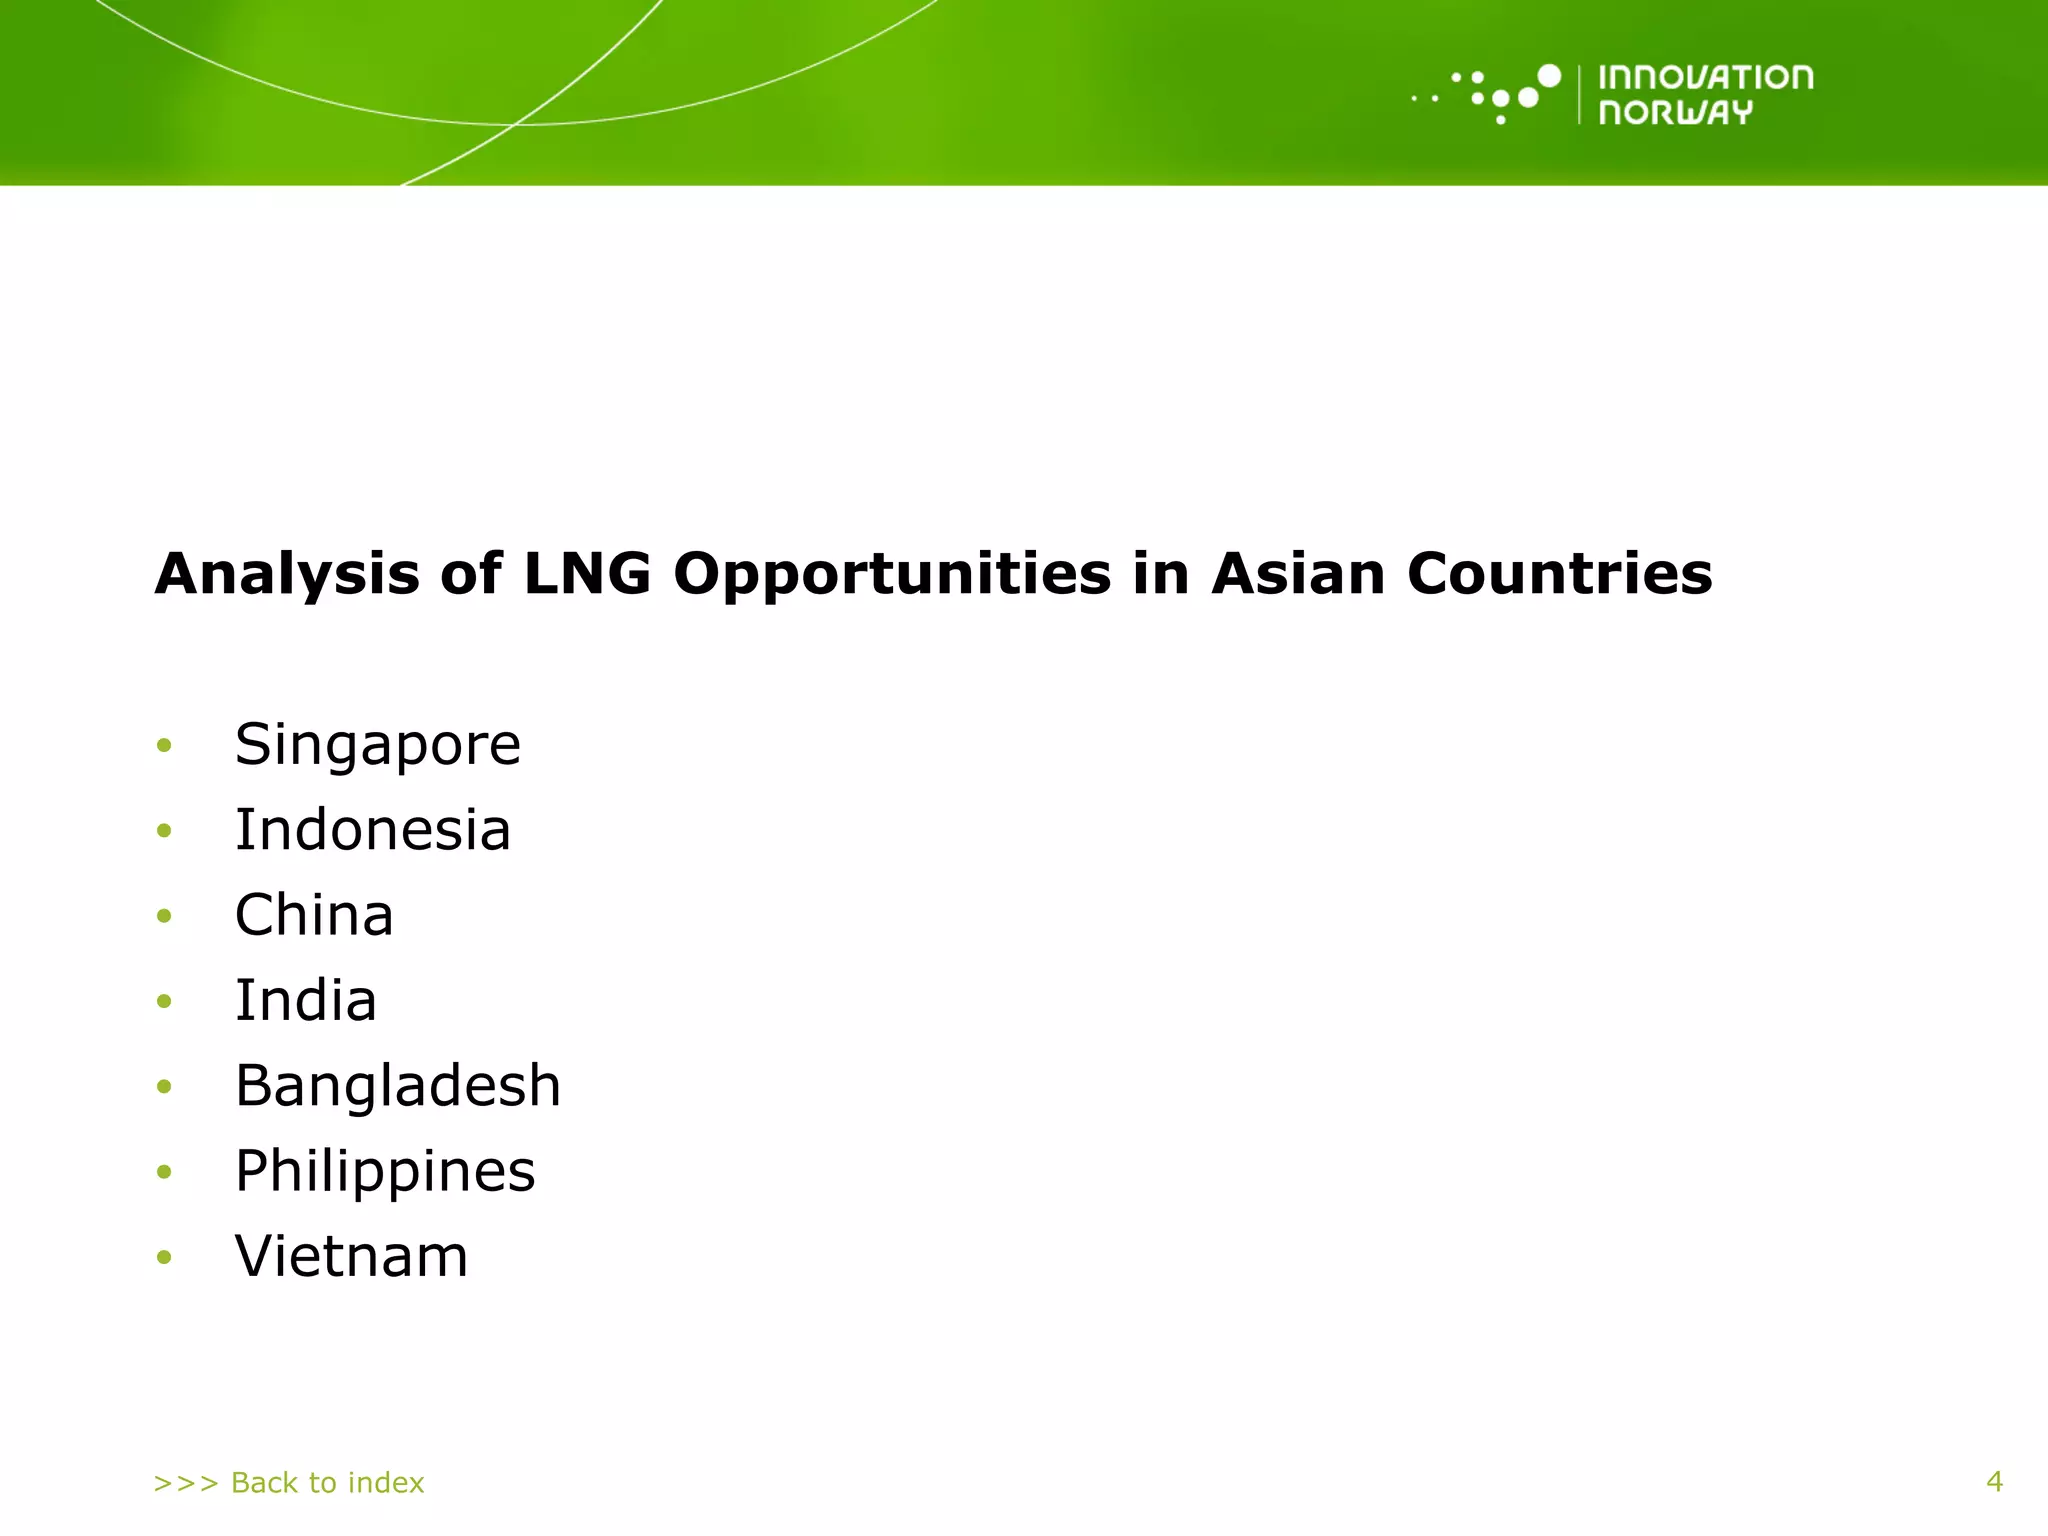

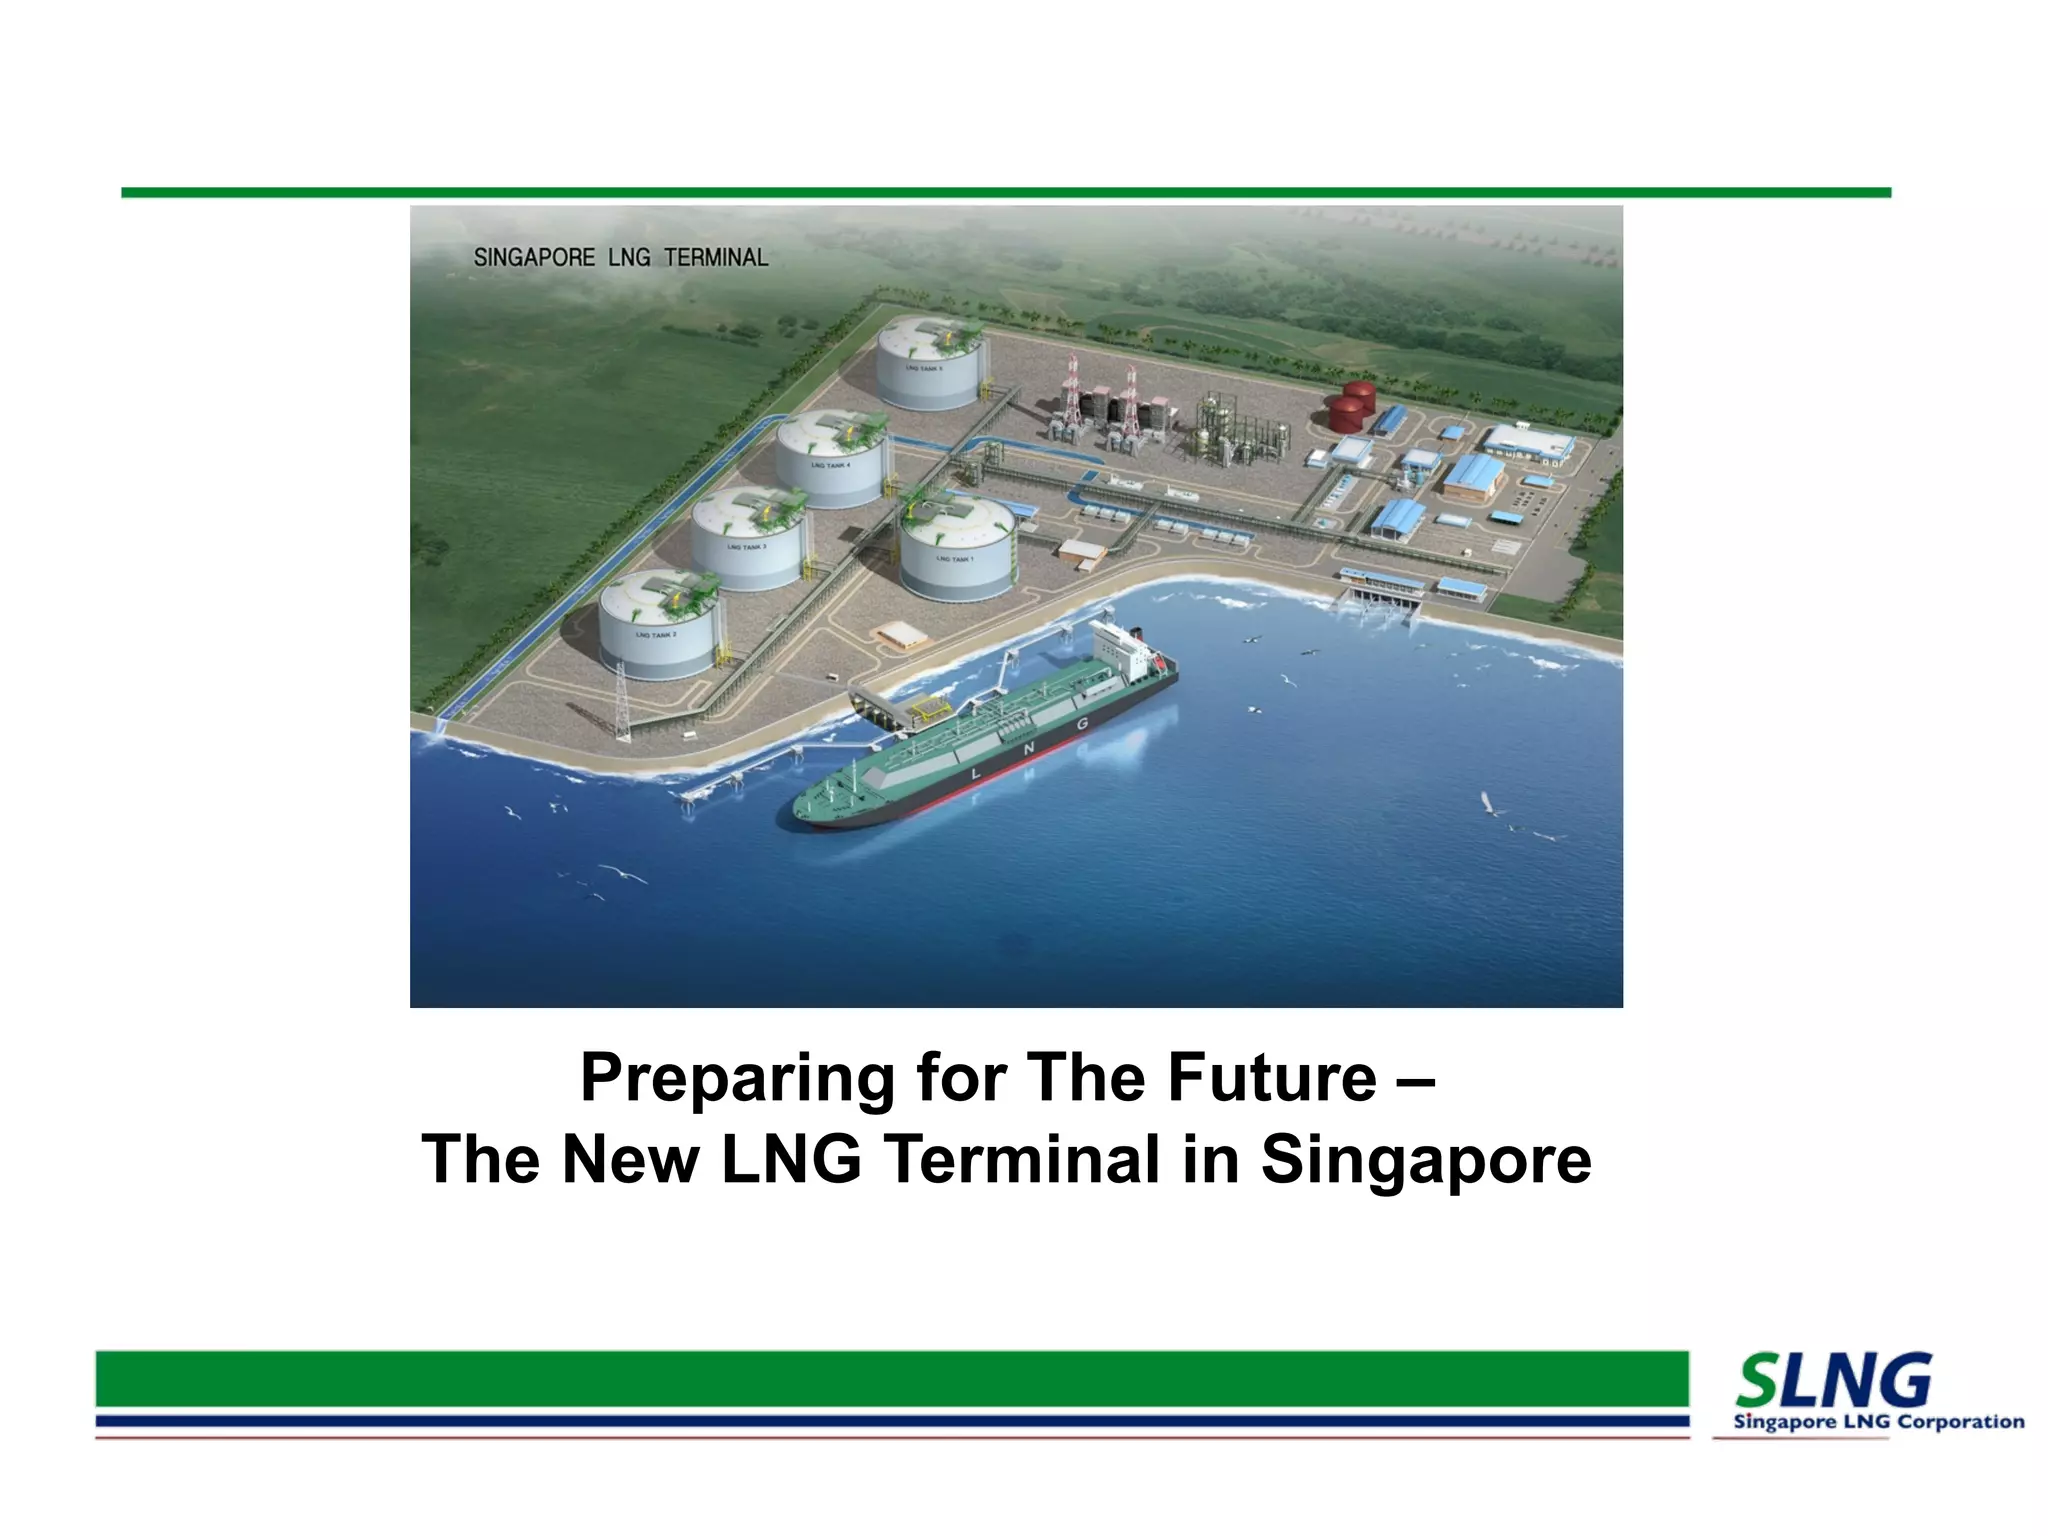
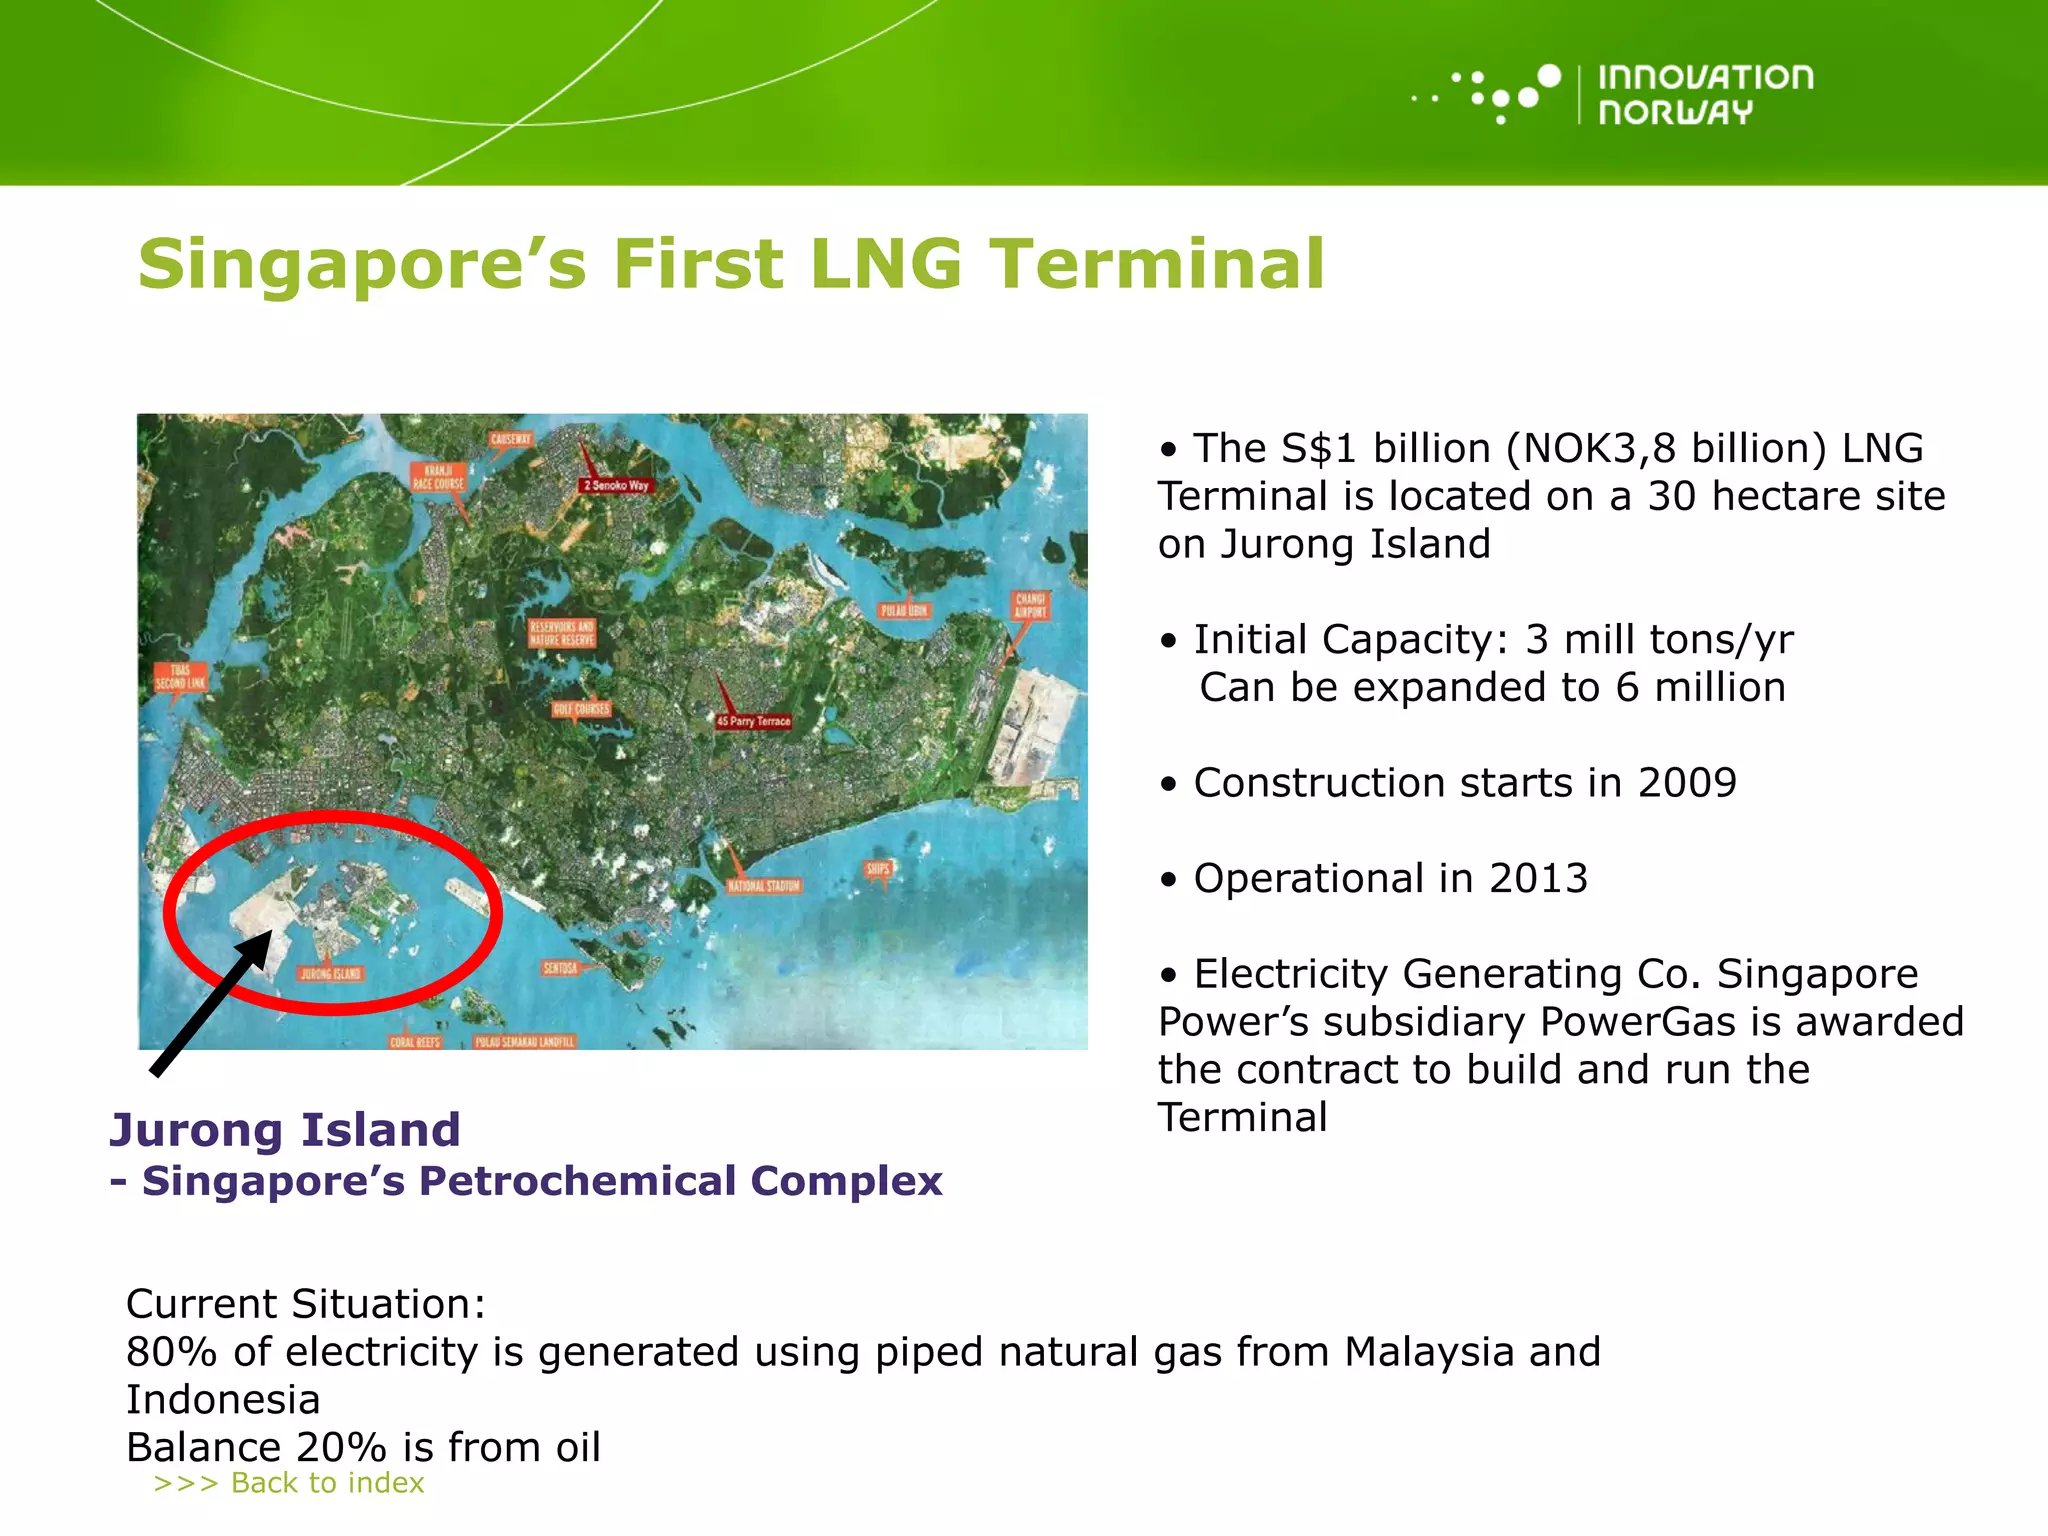
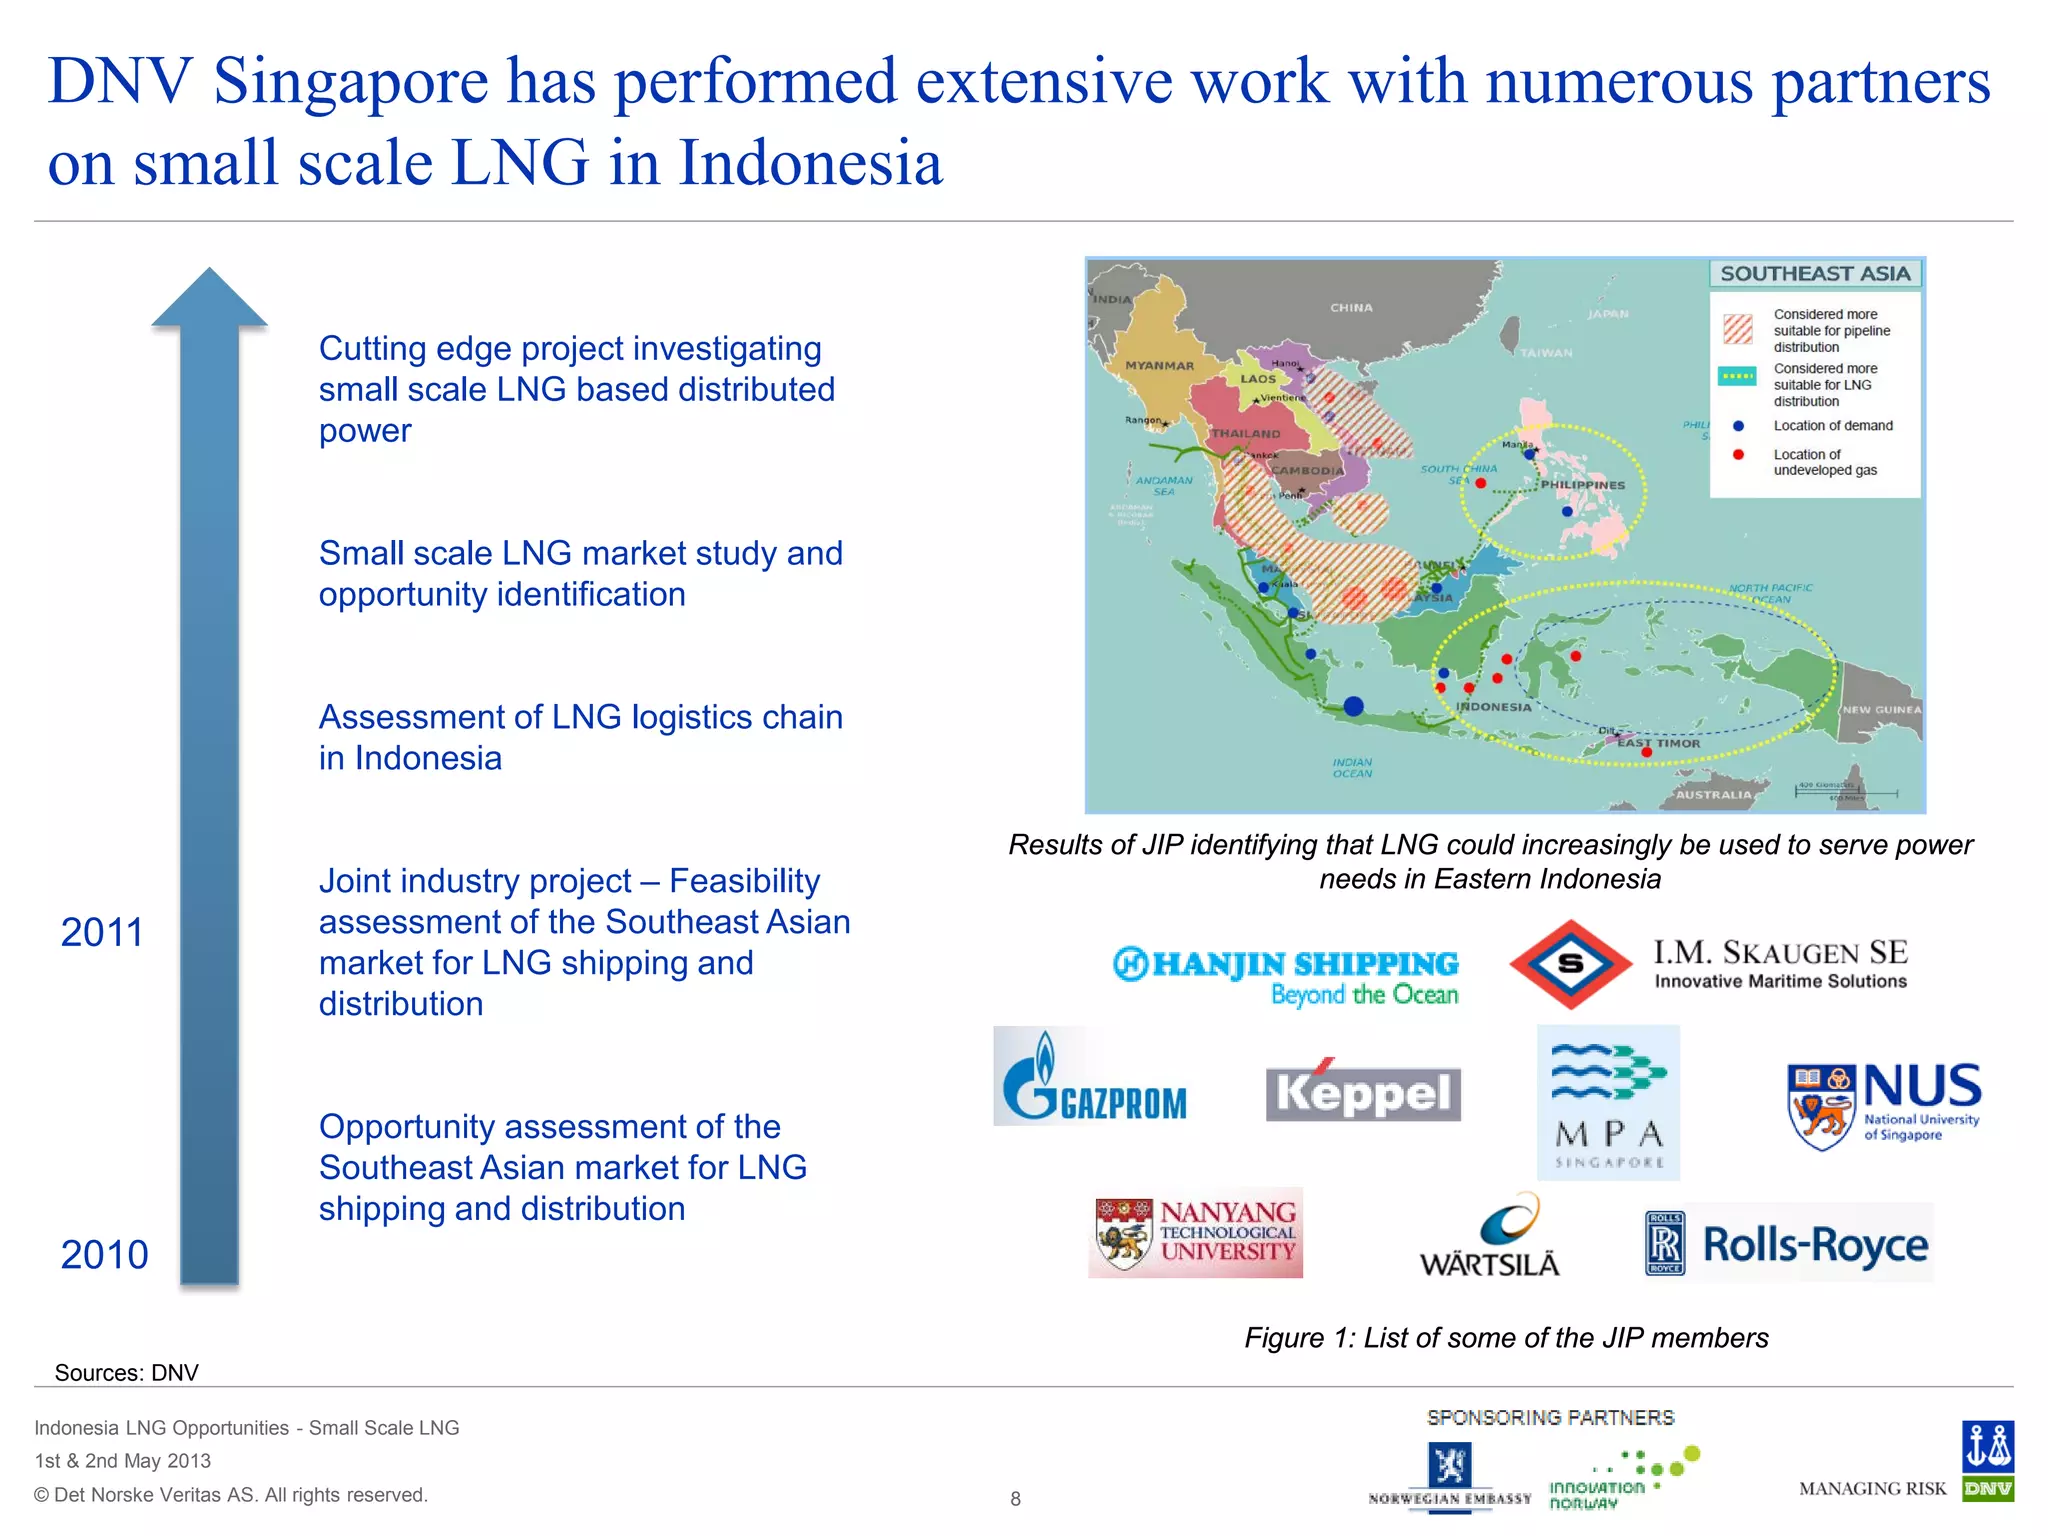


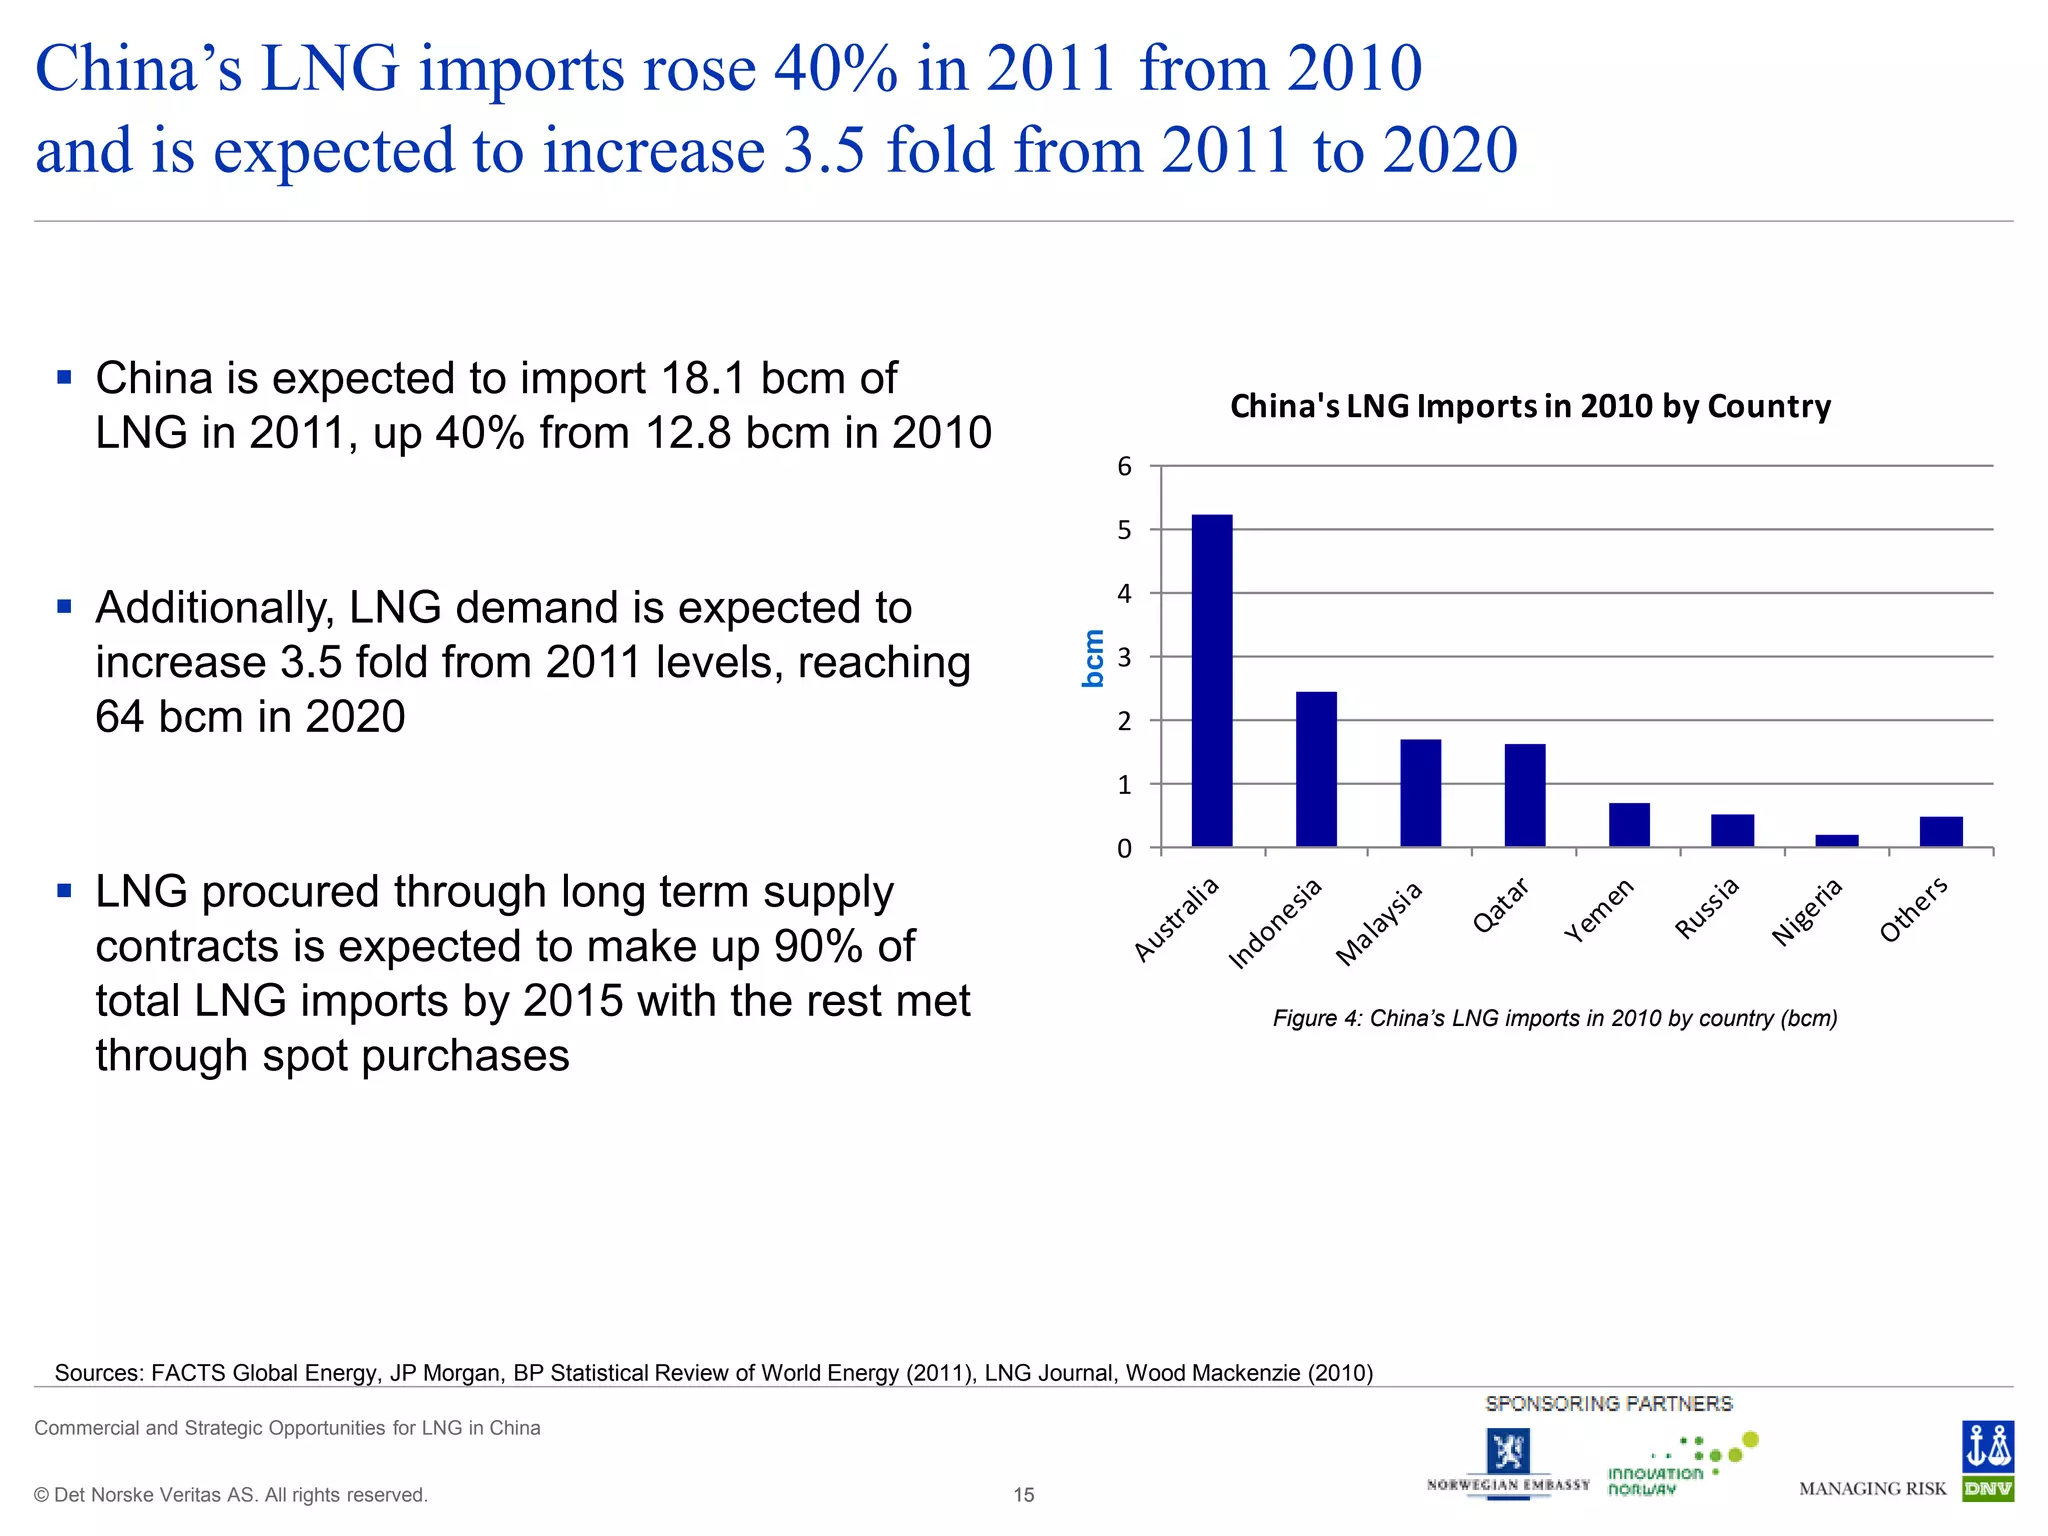


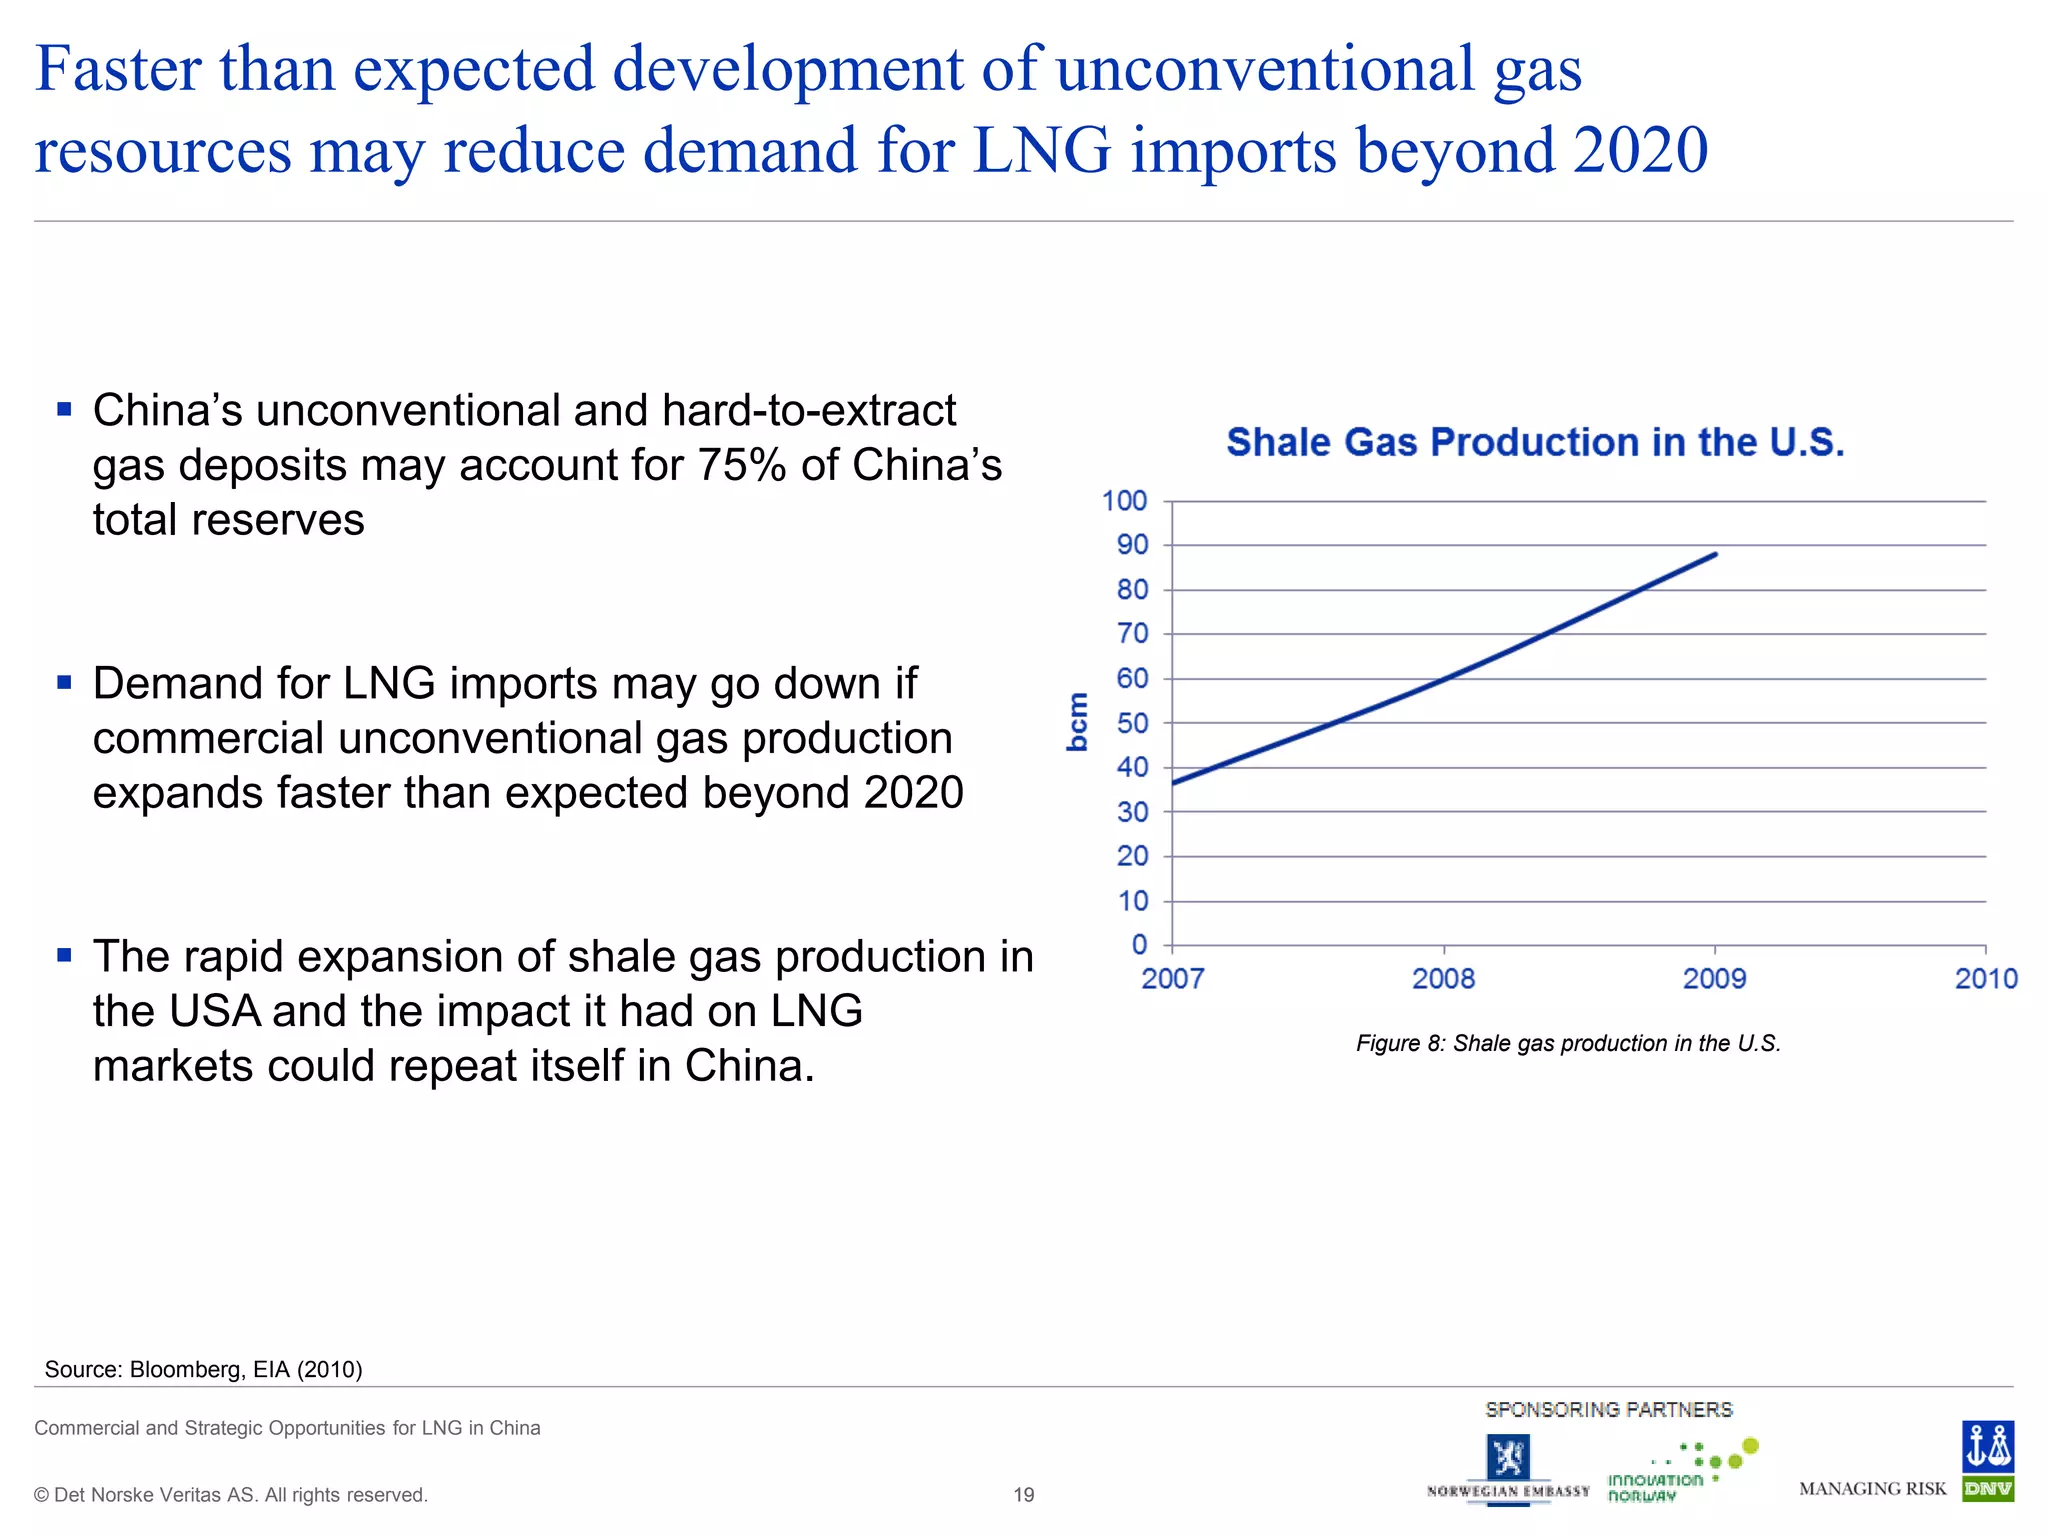
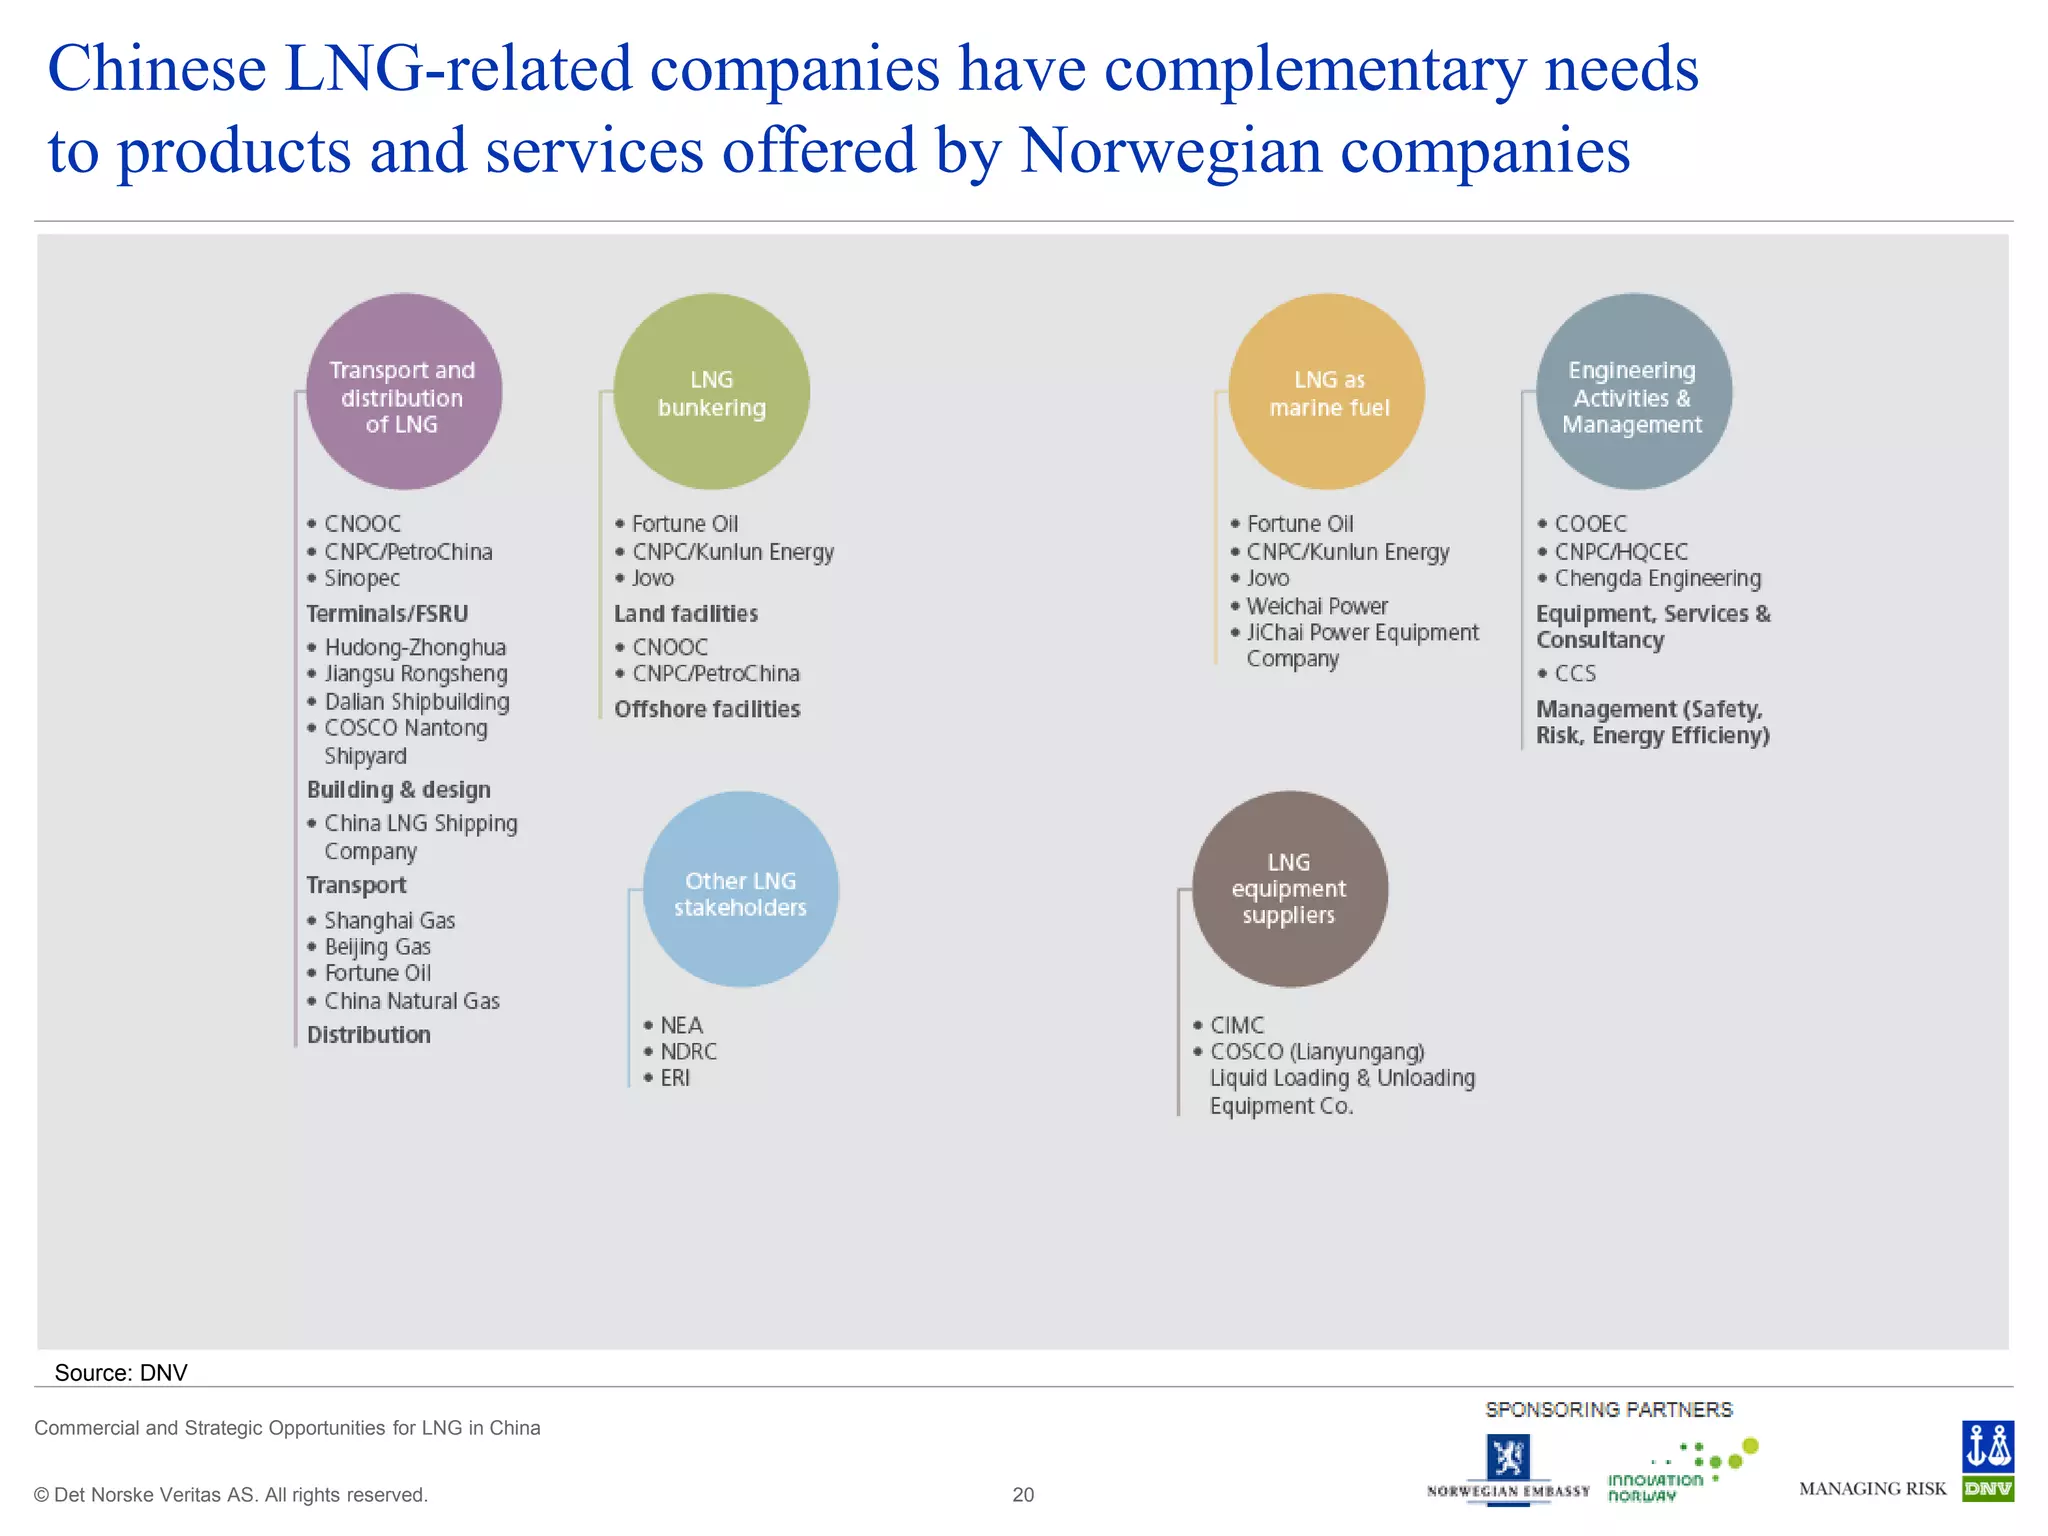
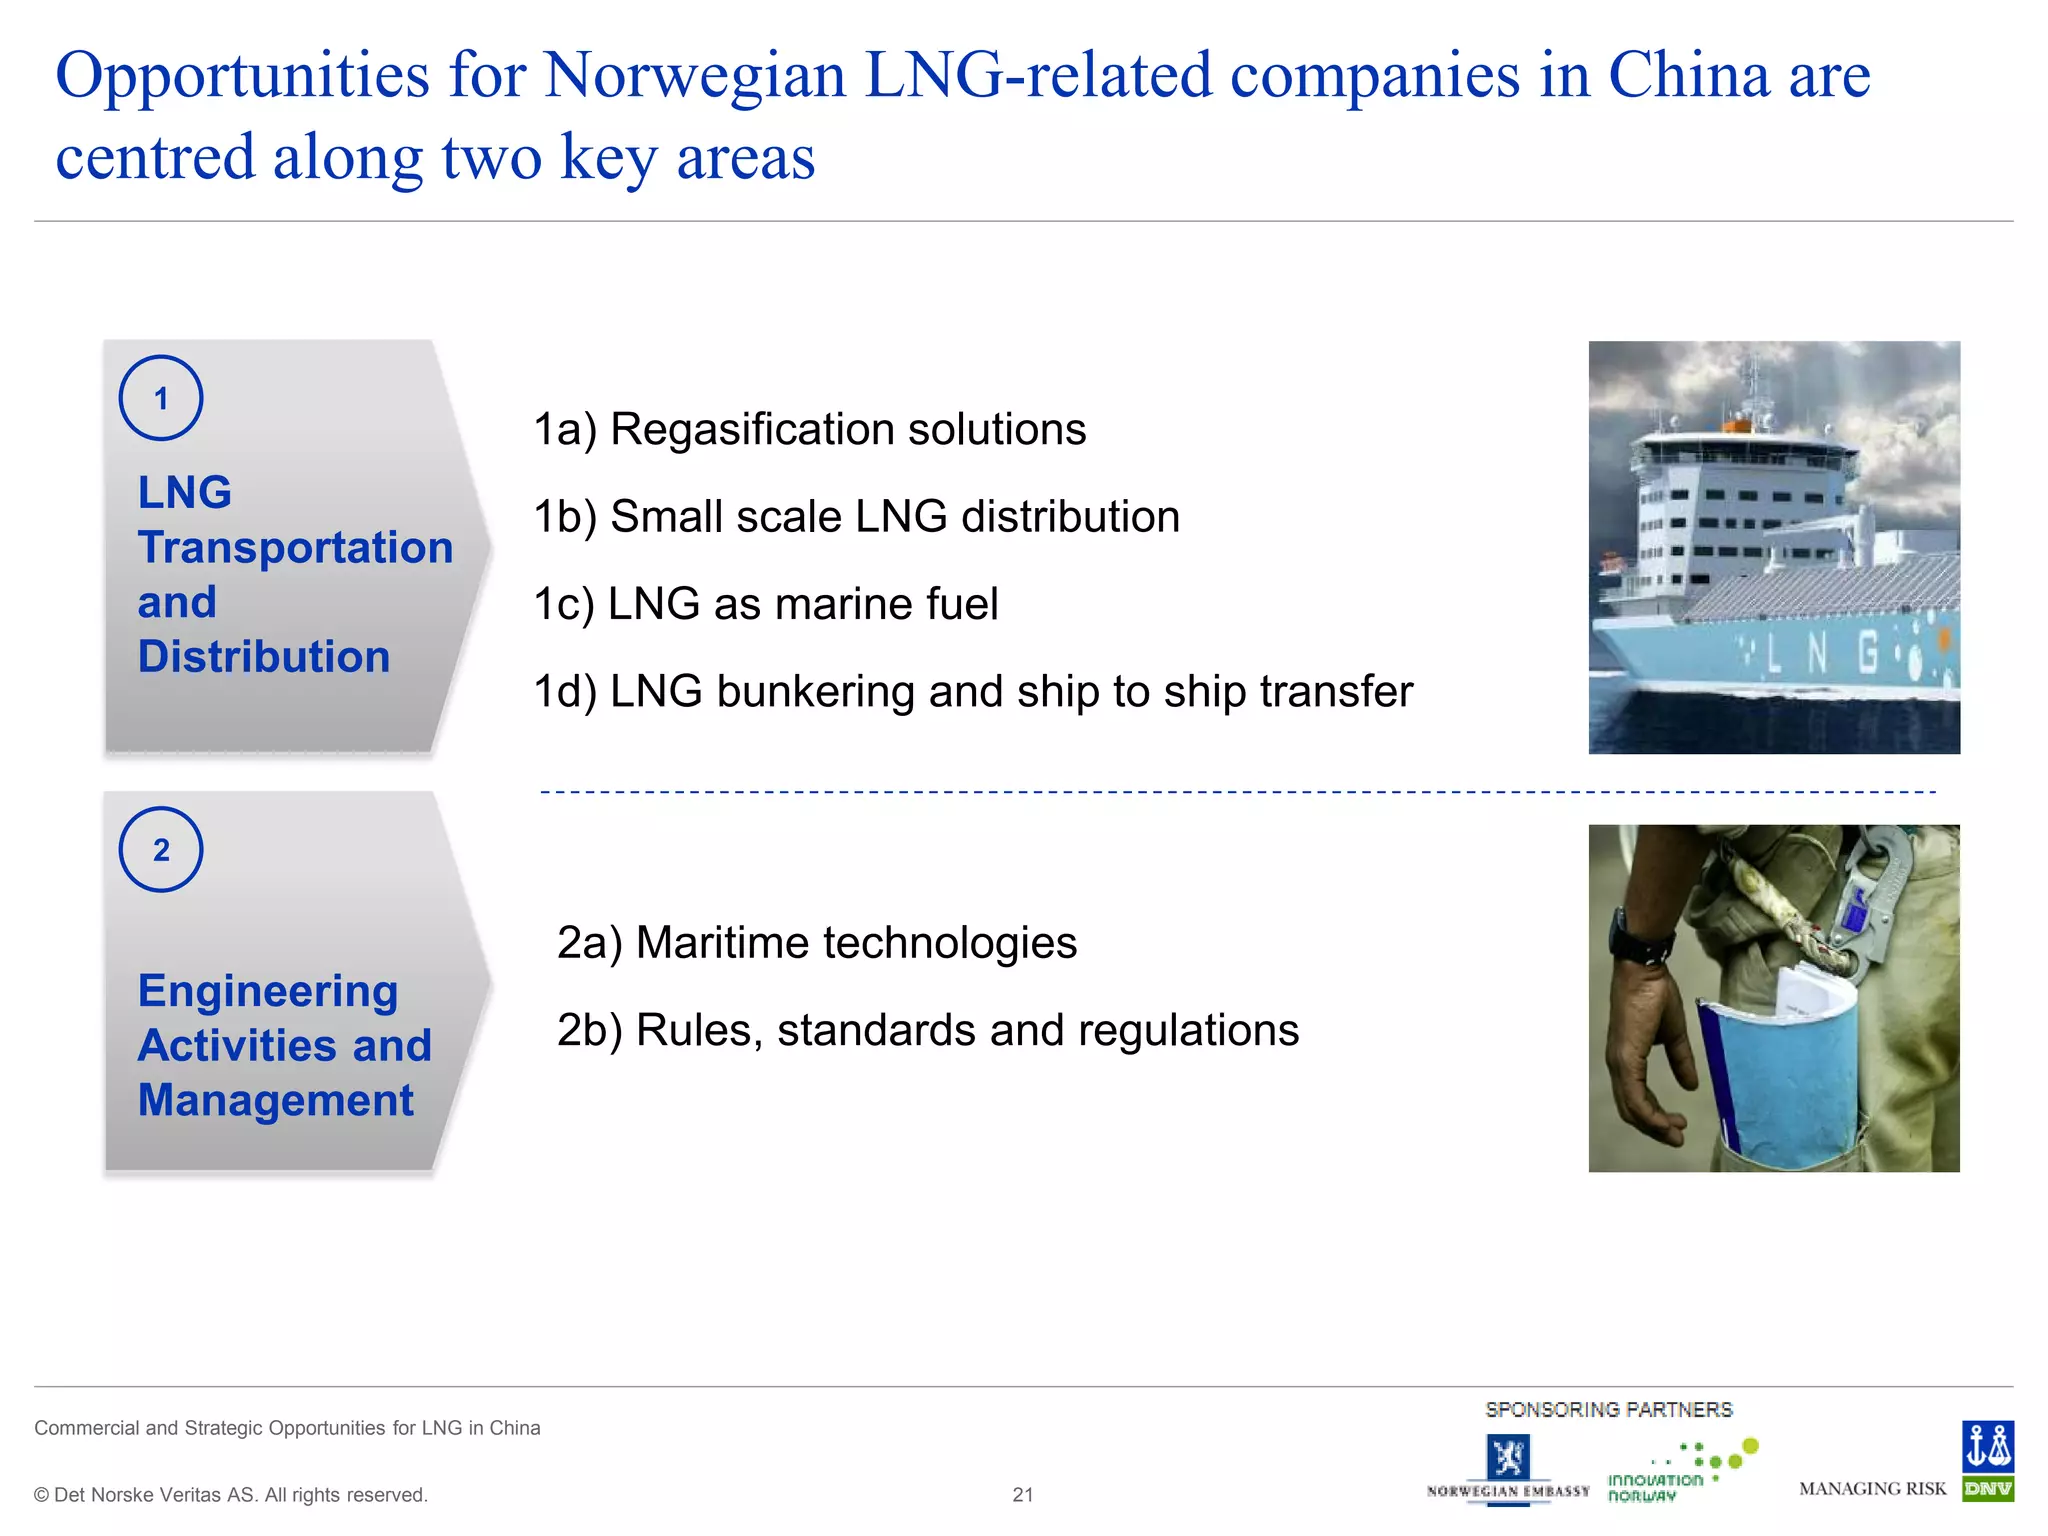


This document summarizes opportunities for small scale LNG distribution and use in Asia. It discusses Innovation Norway's presence in various Asian countries and analyzes LNG opportunities specifically in Singapore, Indonesia, China, India, Bangladesh, and the Philippines. It also provides a case study on potential small scale LNG distribution via milk runs in Vietnam. Key points include Indonesia having 8 small scale LNG terminals planned by 2015 to supply power to Eastern Indonesia, China's growing LNG imports and planned LNG infrastructure expansion, and opportunities for Norwegian LNG companies in China involving regasification, distribution, bunkering, and maritime technologies.


