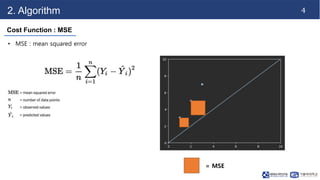
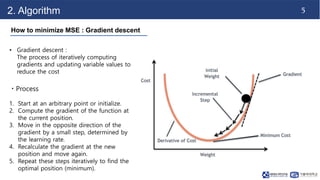
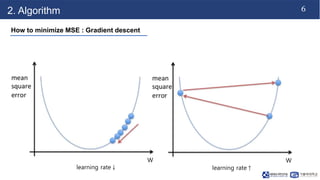
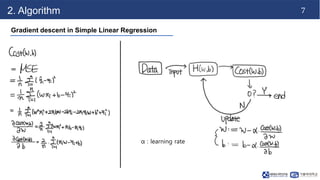
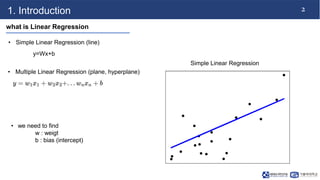
This document discusses linear regression. It begins with an introduction to simple and multiple linear regression models. It then covers the algorithm, including defining the hypothesis as y=Wx+b, initializing weights and biases, and using a cost function of mean squared error (MSE). It describes minimizing MSE through gradient descent, iterating to find optimal weights and biases. Code examples demonstrate finding the right learning rate. Advantages include fast learning and handling large datasets, while disadvantages are unclear coefficient values and difficulty with interrelated features.


![3
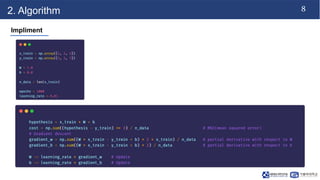
2. Algorithm
Hypothesis
• H(W,b) = Wx + b
• initialize W & b (random)
• x = [1, 2, 3]
• y = [3, 5, 7]
• initialize W = 1, b = 0](https://image.slidesharecdn.com/230925jwlabseminar-230925121140-f522925d/85/Linear-Regression-pptx-4-320.jpg)