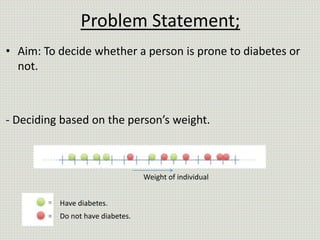
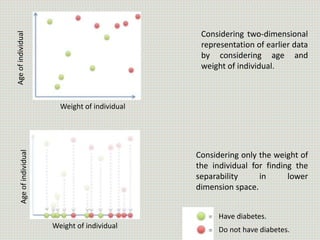
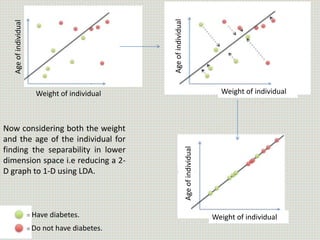
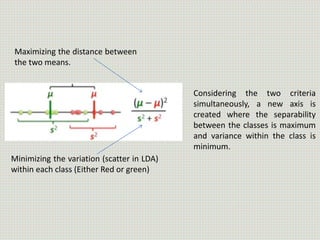
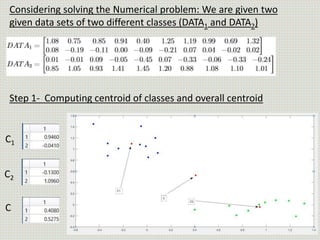
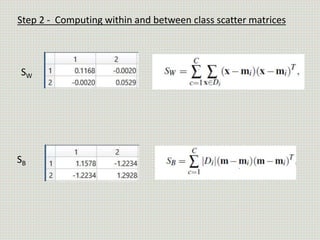
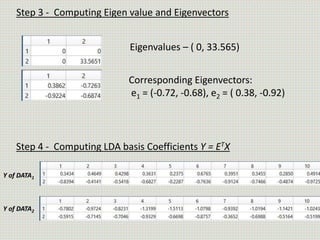
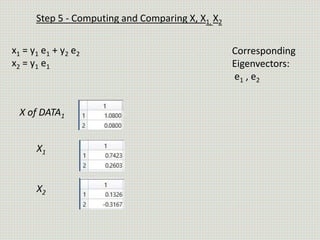
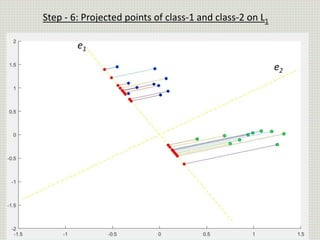
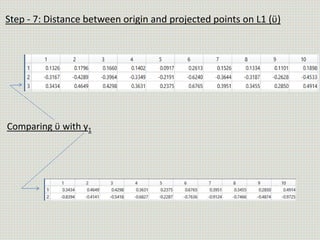
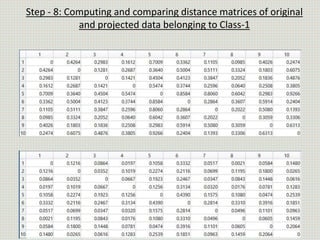
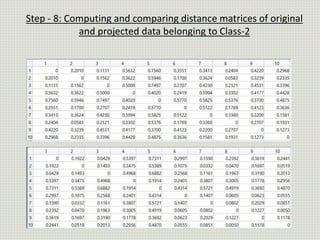
Linear Discriminant Analysis (LDA)
Batch Number – 04
107115009
107115075
108115034
108115058
108115062
108115103
Problem Statement;
• Aim: To decide whether a person is prone to diabetes or
not.
- Deciding based on the person’s weight.
Have diabetes.
Do not have diabetes.
Weight of individual
AgeofindividualAgeofindividual
Weight of individual
Have diabetes.
Do not have diabetes.
Considering two-dimensional
representation of earlier data
by considering age and
weight of individual.
Considering only the weight of
the individual for finding the
separability in lower
dimension space.
Weight of individual
Ageofindividual
Have diabetes.
Do not have diabetes.
Now considering both the weight
and the age of the individual for
finding the separability in lower
dimension space i.e reducing a 2-
D graph to 1-D using LDA.
Weight of individual
Ageofindividual
Ageofindividual
Maximizing the distance between
the two means.
Minimizing the variation (scatter in LDA)
within each class (Either Red or green)
Considering the two criteria
simultaneously, a new axis is
created where the separability
between the classes is maximum
and variance within the class is
minimum.
Compute centroids of
Individual and overall
classes
Compute within class( SB ) &
between class (SW ) scatter
matrix
Maximize the objective
function and get SW
-1 SB
Obtain Eigen values &
vectors
Coefficients of LDA basis
Y = ETX
Project the points onto
hyper plane
Flowchart of LDA Algorithm
Considering solving the Numerical problem: We are given two
given data sets of two different classes (DATA1 and DATA2)
Step 1- Computing centroid of classes and overall centroid
C1
C2
C
SW
SB
Step 2 - Computing within and between class scatter matrices
Step 3 - Computing Eigen value and Eigenvectors
Eigenvalues – ( 0, 33.565)
Corresponding Eigenvectors:
e1 = (-0.72, -0.68), e2 = ( 0.38, -0.92)
Step 4 - Computing LDA basis Coefficients Y = ETX
Y of DATA1
Y of DATA2
Step 5 - Computing and Comparing X, X1, X2
x1 = y1 e1 + y2 e2
x2 = y1 e1
Corresponding
Eigenvectors:
e1 , e2
X of DATA1
X1
X2
e1
e2
Step - 6: Projected points of class-1 and class-2 on L1
Step - 7: Distance between origin and projected points on L1 (ϋ)
Comparing ϋ with y1
Step - 8: Computing and comparing distance matrices of original
and projected data belonging to Class-1
Step - 8: Computing and comparing distance matrices of original
and projected data belonging to Class-2
Contributions:
• 107115009 -
• 108115058 -

Linear Discriminant Analysis (LDA)

  • 1.
    Linear Discriminant Analysis(LDA) Batch Number – 04 107115009 107115075 108115034 108115058 108115062 108115103
  • 2.
    Problem Statement; • Aim:To decide whether a person is prone to diabetes or not. - Deciding based on the person’s weight. Have diabetes. Do not have diabetes. Weight of individual
  • 3.
    Weight of individual AgeofindividualAgeofindividual Weightof individual Have diabetes. Do not have diabetes. Considering two-dimensional representation of earlier data by considering age and weight of individual. Considering only the weight of the individual for finding the separability in lower dimension space.
  • 4.
    Weight of individual Ageofindividual Havediabetes. Do not have diabetes. Now considering both the weight and the age of the individual for finding the separability in lower dimension space i.e reducing a 2- D graph to 1-D using LDA. Weight of individual Weight of individual Ageofindividual Ageofindividual
  • 5.
    Maximizing the distancebetween the two means. Minimizing the variation (scatter in LDA) within each class (Either Red or green) Considering the two criteria simultaneously, a new axis is created where the separability between the classes is maximum and variance within the class is minimum.
  • 6.
    Compute centroids of Individualand overall classes Compute within class( SB ) & between class (SW ) scatter matrix Maximize the objective function and get SW -1 SB Obtain Eigen values & vectors Coefficients of LDA basis Y = ETX Project the points onto hyper plane Flowchart of LDA Algorithm
  • 7.
    Considering solving theNumerical problem: We are given two given data sets of two different classes (DATA1 and DATA2) Step 1- Computing centroid of classes and overall centroid C1 C2 C
  • 8.
    SW SB Step 2 -Computing within and between class scatter matrices
  • 9.
    Step 3 -Computing Eigen value and Eigenvectors Eigenvalues – ( 0, 33.565) Corresponding Eigenvectors: e1 = (-0.72, -0.68), e2 = ( 0.38, -0.92) Step 4 - Computing LDA basis Coefficients Y = ETX Y of DATA1 Y of DATA2
  • 10.
    Step 5 -Computing and Comparing X, X1, X2 x1 = y1 e1 + y2 e2 x2 = y1 e1 Corresponding Eigenvectors: e1 , e2 X of DATA1 X1 X2
  • 11.
    e1 e2 Step - 6:Projected points of class-1 and class-2 on L1
  • 12.
    Step - 7:Distance between origin and projected points on L1 (ϋ) Comparing ϋ with y1
  • 13.
    Step - 8:Computing and comparing distance matrices of original and projected data belonging to Class-1
  • 14.
    Step - 8:Computing and comparing distance matrices of original and projected data belonging to Class-2
  • 15.