Download as PDF, PPTX
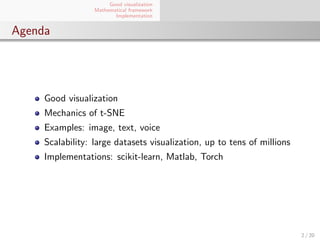
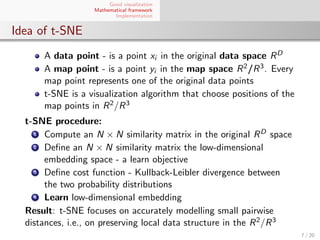
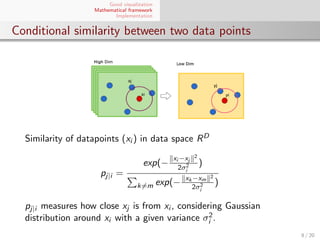
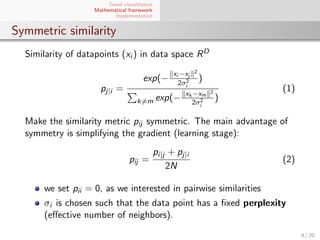
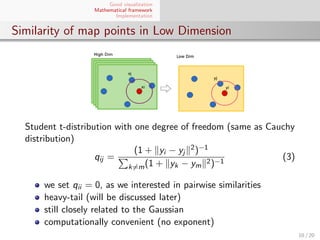
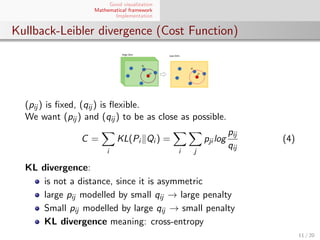
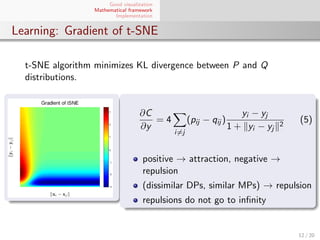
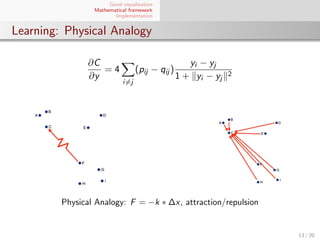
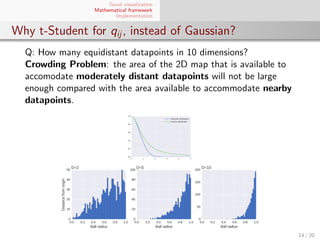
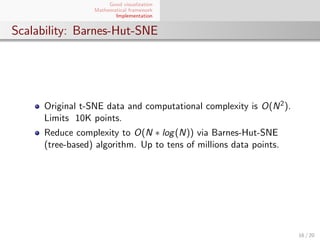

El documento presenta un marco matemático para la visualización de datos utilizando el algoritmo t-SNE, destacando su aplicación en conjuntos de datos de alta dimensión. Se explica cómo t-SNE preserva la estructura local de los datos al reducir dimensiones y se discuten sus implementaciones y escalabilidad con respecto a grandes conjuntos de datos. También se aborda la convergencia y el aprendizaje del algoritmo mediante la minimización de la divergencia de Kullback-Leibler entre distribuciones de similitud.


![ViT (Vision Transformer) Review [CDM]](https://cdn.slidesharecdn.com/ss_thumbnails/vitreviewcdm-201012184226-thumbnail.jpg?width=640&height=640&fit=bounds)


![Dimension reduction techniques[Feature Selection]](https://cdn.slidesharecdn.com/ss_thumbnails/dimensionreductiontechnibyaakankshajain-210625102243-thumbnail.jpg?width=640&height=640&fit=bounds)