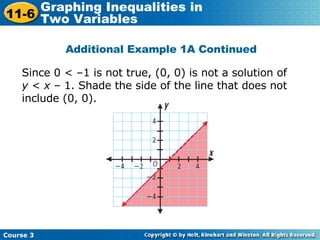
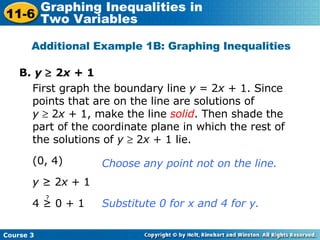
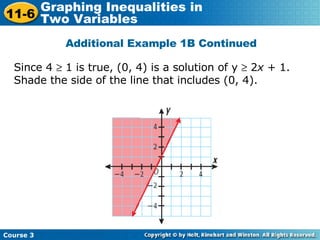
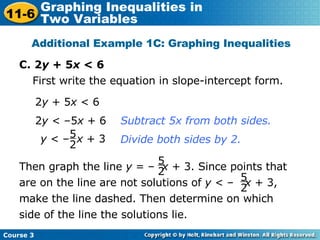
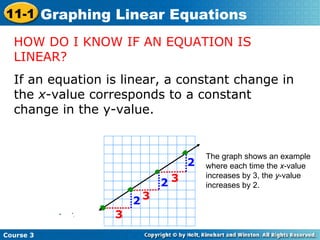
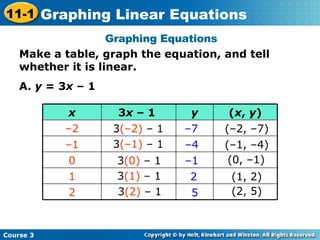
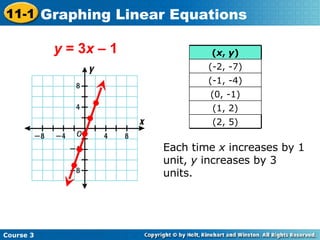
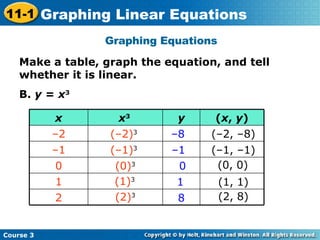
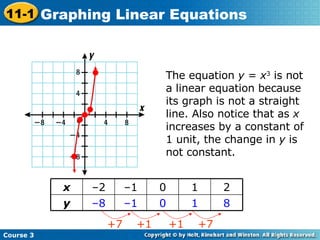
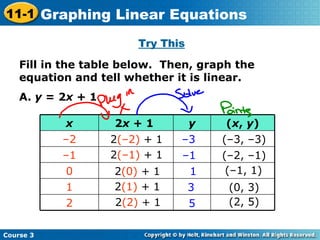
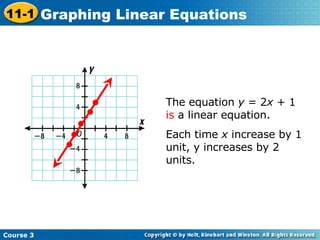
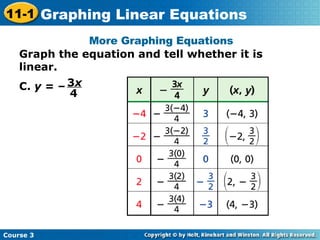
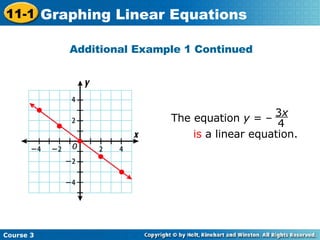
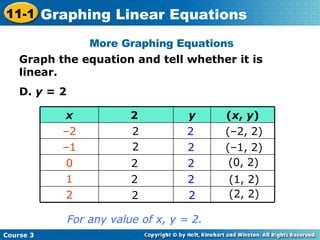
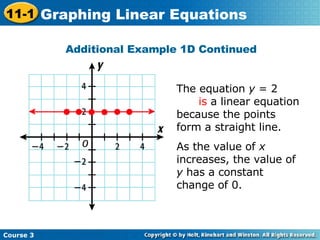
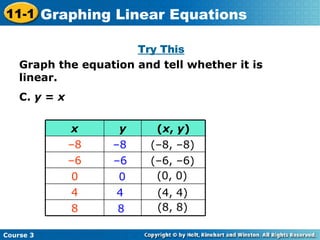
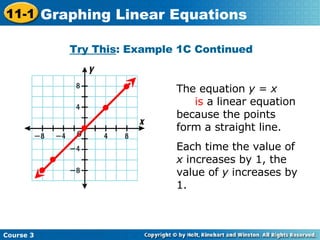
This document provides information about graphing linear equations. It begins by defining a linear equation as one whose solutions fall on a straight line. It explains how to identify if an equation is linear based on whether a constant change in the x-value corresponds to a constant change in the y-value. The document then gives examples of graphing equations and determining if they are linear based on whether their graphs form a straight line. It also discusses using tables to list the x and y-values of points that satisfy the equation.


![B. y – 1 = ( x + 6) Additional Example 1B: Using Point-Slope Form to Identify Information About a Line y – y 1 = m ( x – x 1 ) ( x 1 , y 1 ) = (–6, 1) Rewrite using subtraction instead of addition. 1 3 1 3 y – 1 = ( x + 6) y – 1 = [ x – ( –6 )] 1 3 m = 1 3 The line defined by y – 1 = ( x + 6) has slope , and passes through the point (–6, 1). 1 3 1 3 Course 3 11-4 Point-Slope Form](https://image.slidesharecdn.com/copyofchapter11-090423145550-phpapp01/85/Chapter11-91-320.jpg)
![B. y – 2 = (x + 3) Try This : Example 1B ( x 1 , y 1 ) = (–3, 2) Rewrite using subtraction instead of addition. y – y 1 = m ( x – x 1 ) 2 3 2 3 y – 2 = ( x + 3 ) y – 2 = [ x – (–3)] 2 3 m = 2 3 The line defined by y – 2 = ( x + 3) has slope , and passes through the point (–3, 2). 2 3 2 3 Course 3 11-4 Point-Slope Form](https://image.slidesharecdn.com/copyofchapter11-090423145550-phpapp01/85/Chapter11-93-320.jpg)
![Write the point-slope form of the equation with the given slope that passes through the indicated point. A. the line with slope 4 passing through (5, -2) Additional Example 2: Writing the Point-Slope Form of an Equation y – y 1 = m (x – x 1 ) The equation of the line with slope 4 that passes through (5, –2) in point-slope form is y + 2 = 4( x – 5). Substitute 5 for x 1 , –2 for y 1 , and 4 for m. [ y – ( –2 )] = 4 ( x – 5 ) y + 2 = 4( x – 5) Course 3 11-4 Point-Slope Form](https://image.slidesharecdn.com/copyofchapter11-090423145550-phpapp01/85/Chapter11-94-320.jpg)
![B. the line with slope –5 passing through (–3, 7) Additional Example 2: Writing the Point-Slope Form of an Equation y – y 1 = m ( x – x 1 ) The equation of the line with slope –5 that passes through (–3, 7) in point-slope form is y – 7 = –5( x + 3). Substitute –3 for x 1 , 7 for y 1 , and –5 for m. y – 7 = -5[ x – ( –3 )] y – 7 = –5( x + 3) Course 3 11-4 Point-Slope Form](https://image.slidesharecdn.com/copyofchapter11-090423145550-phpapp01/85/Chapter11-95-320.jpg)
![Write the point-slope form of the equation with the given slope that passes through the indicated point. A. the line with slope 2 passing through (2, –2) Try This : Example 2A y – y 1 = m (x – x 1 ) The equation of the line with slope 2 that passes through (2, –2) in point-slope form is y + 2 = 2( x – 2). Substitute 2 for x 1 , –2 for y 1 , and 2 for m. [ y – ( –2 )] = 2 ( x – 2 ) y + 2 = 2( x – 2) Course 3 11-4 Point-Slope Form](https://image.slidesharecdn.com/copyofchapter11-090423145550-phpapp01/85/Chapter11-96-320.jpg)
![B. the line with slope -4 passing through (-2, 5) Try This : Example 2B y – y 1 = m ( x – x 1 ) The equation of the line with slope –4 that passes through (–2, 5) in point-slope form is y – 5 = –4( x + 2). Substitute –2 for x 1 , 5 for y 1 , and –4 for m. y – 5 = –4[ x – ( –2 )] y – 5 = –4( x + 2) Course 3 11-4 Point-Slope Form](https://image.slidesharecdn.com/copyofchapter11-090423145550-phpapp01/85/Chapter11-97-320.jpg)