Download to read offline
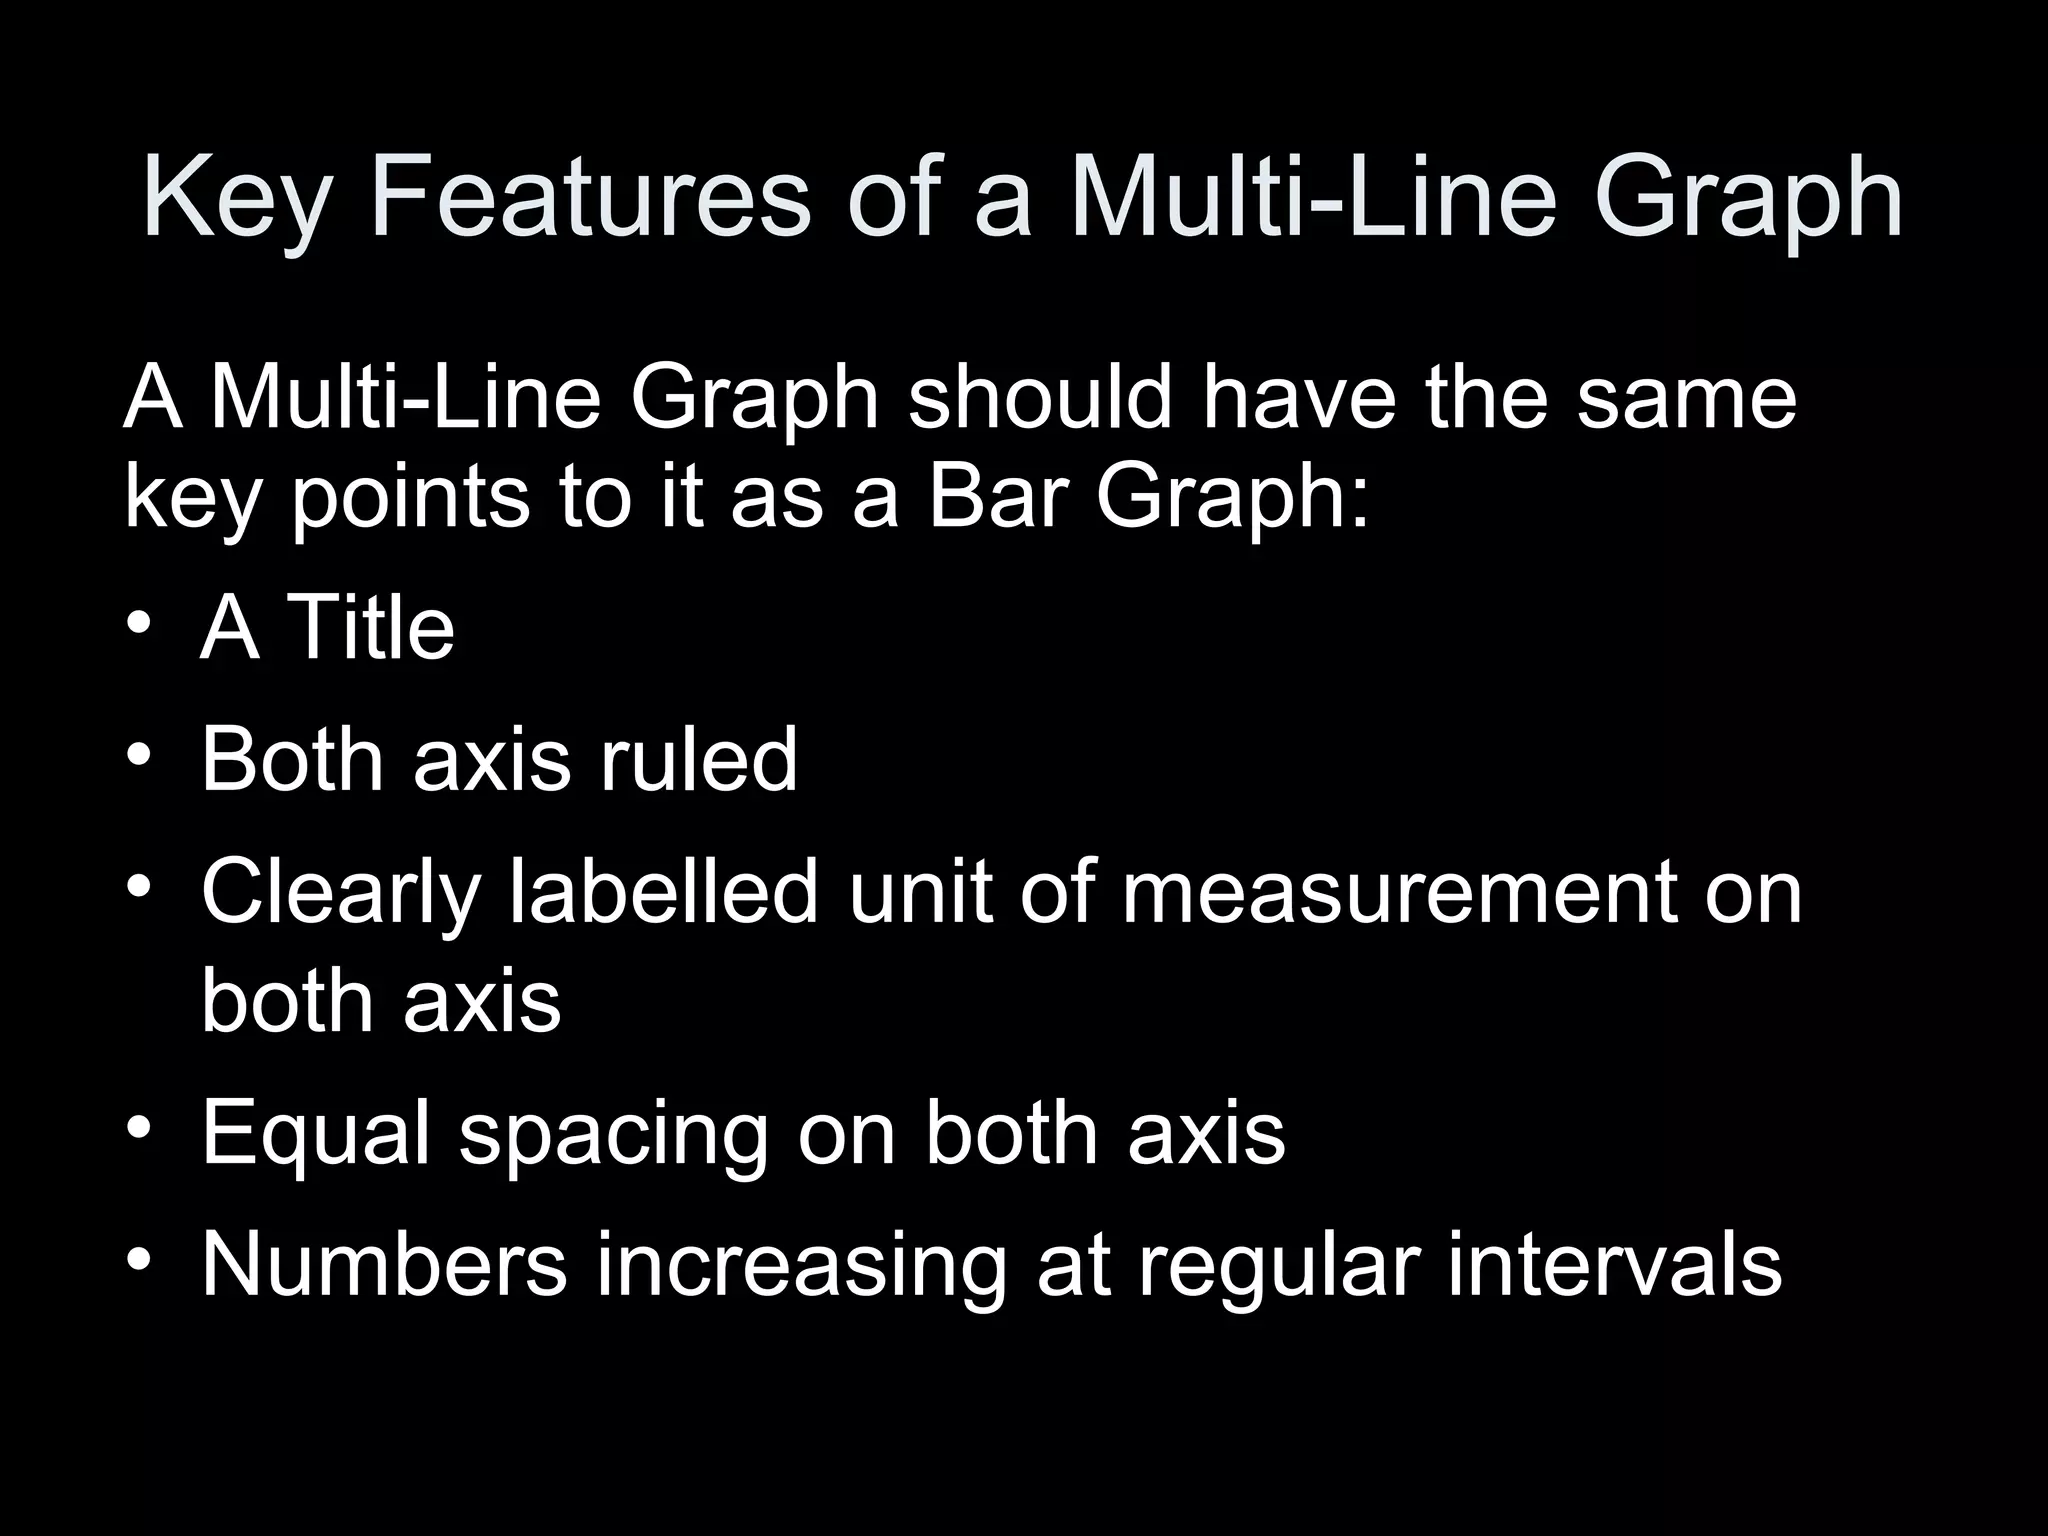
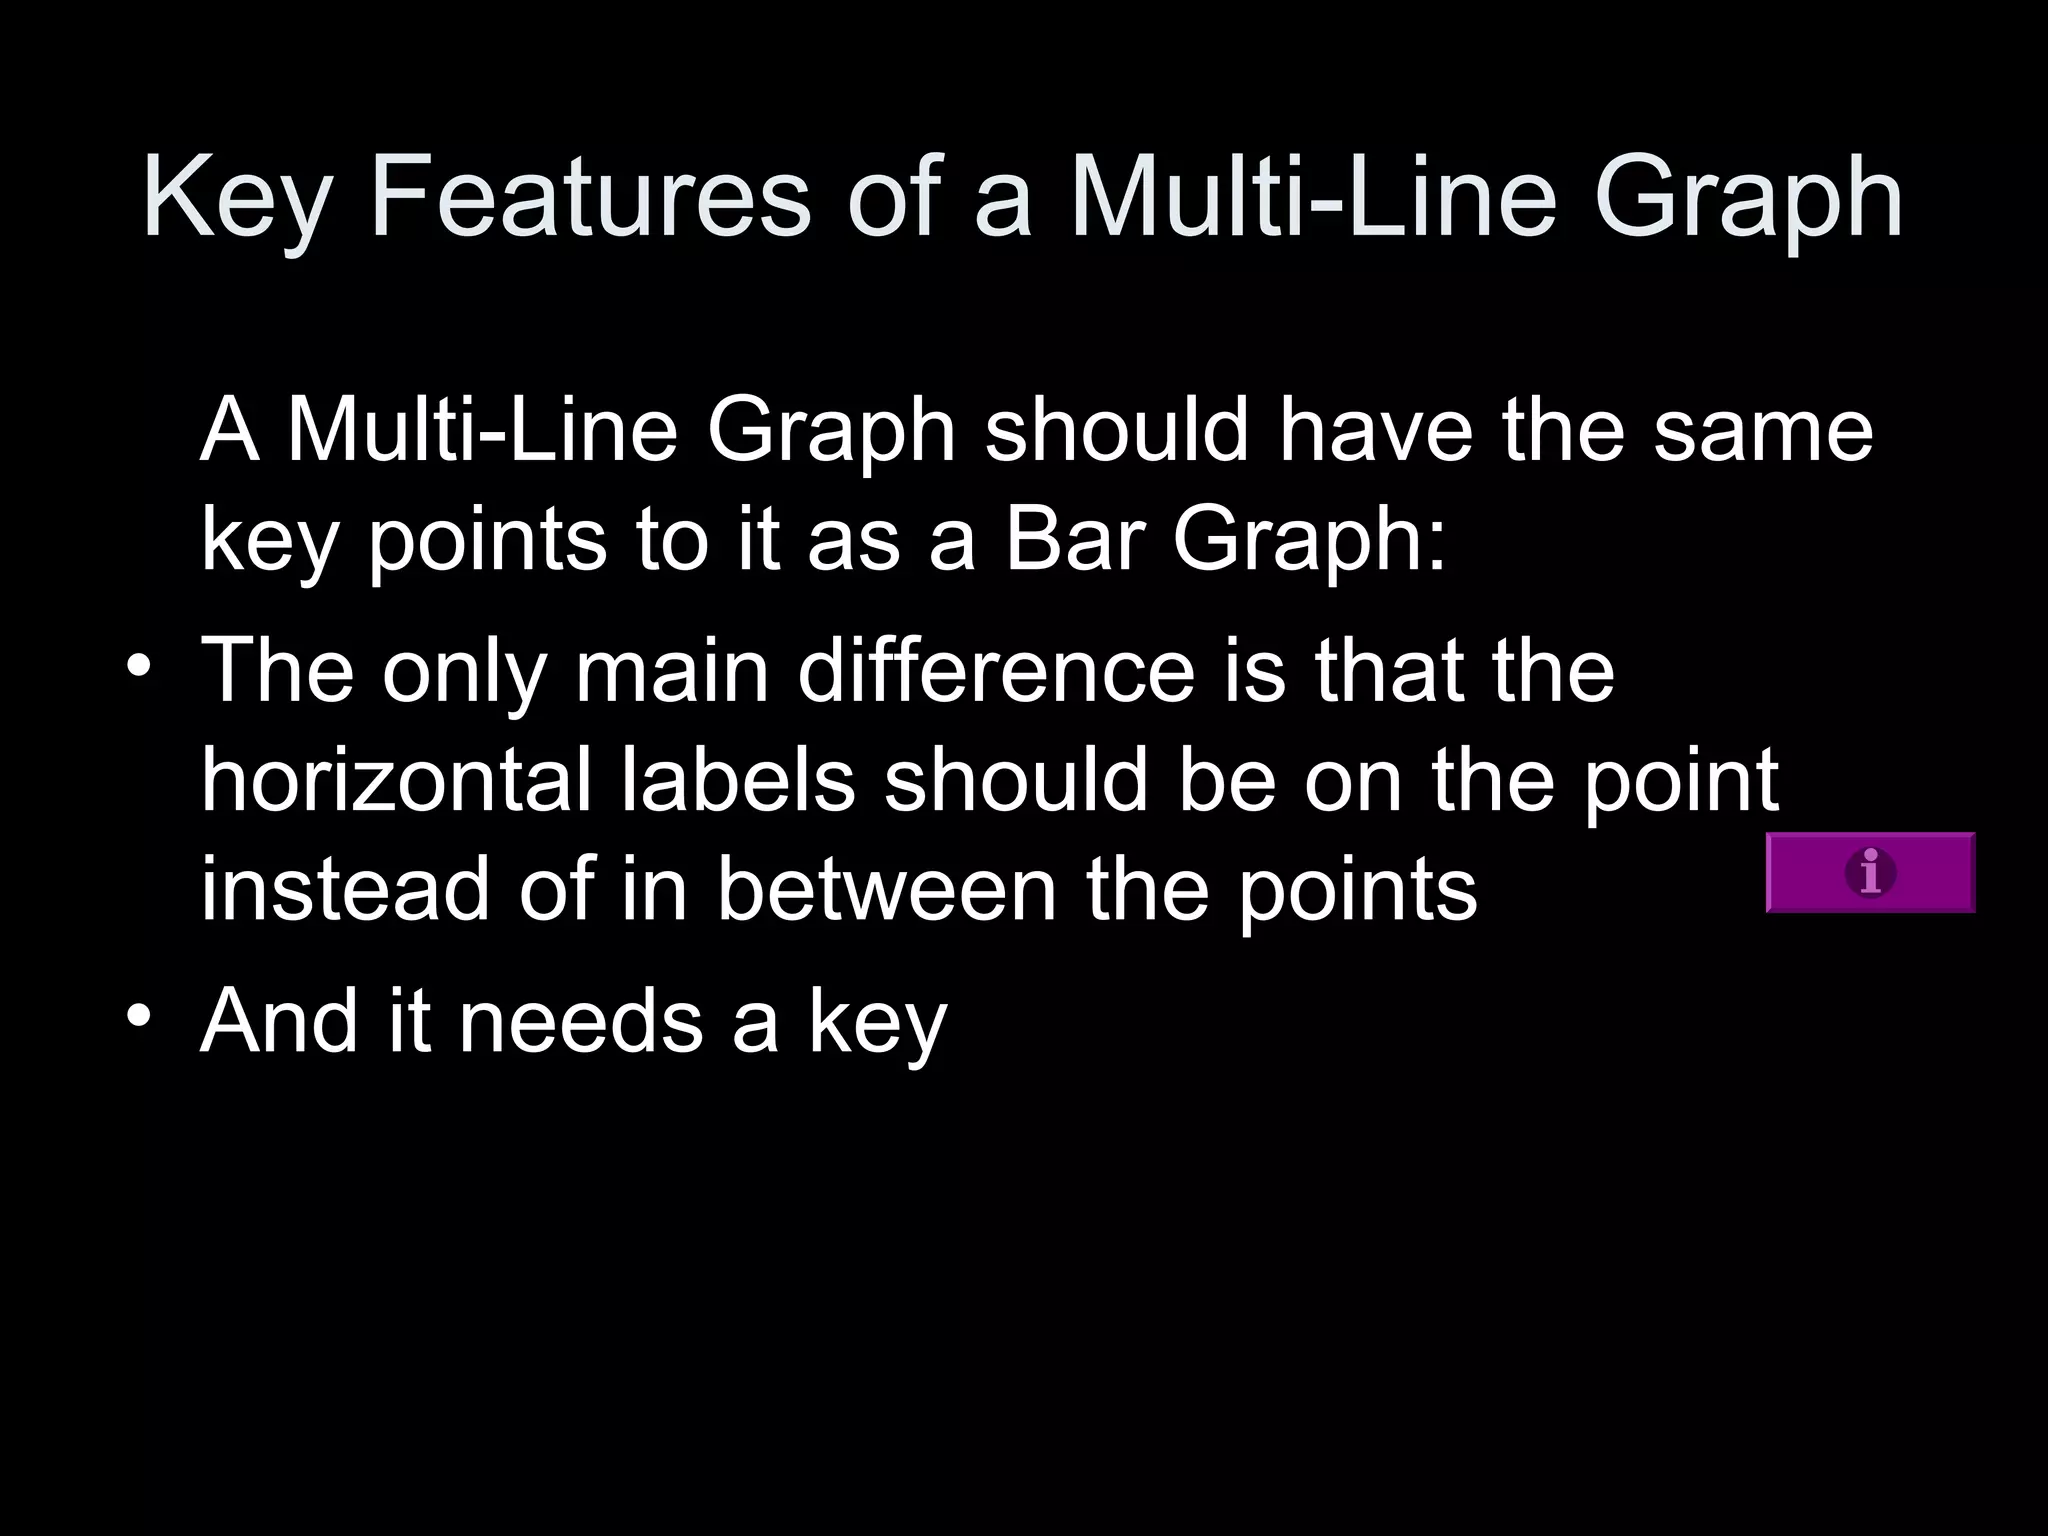
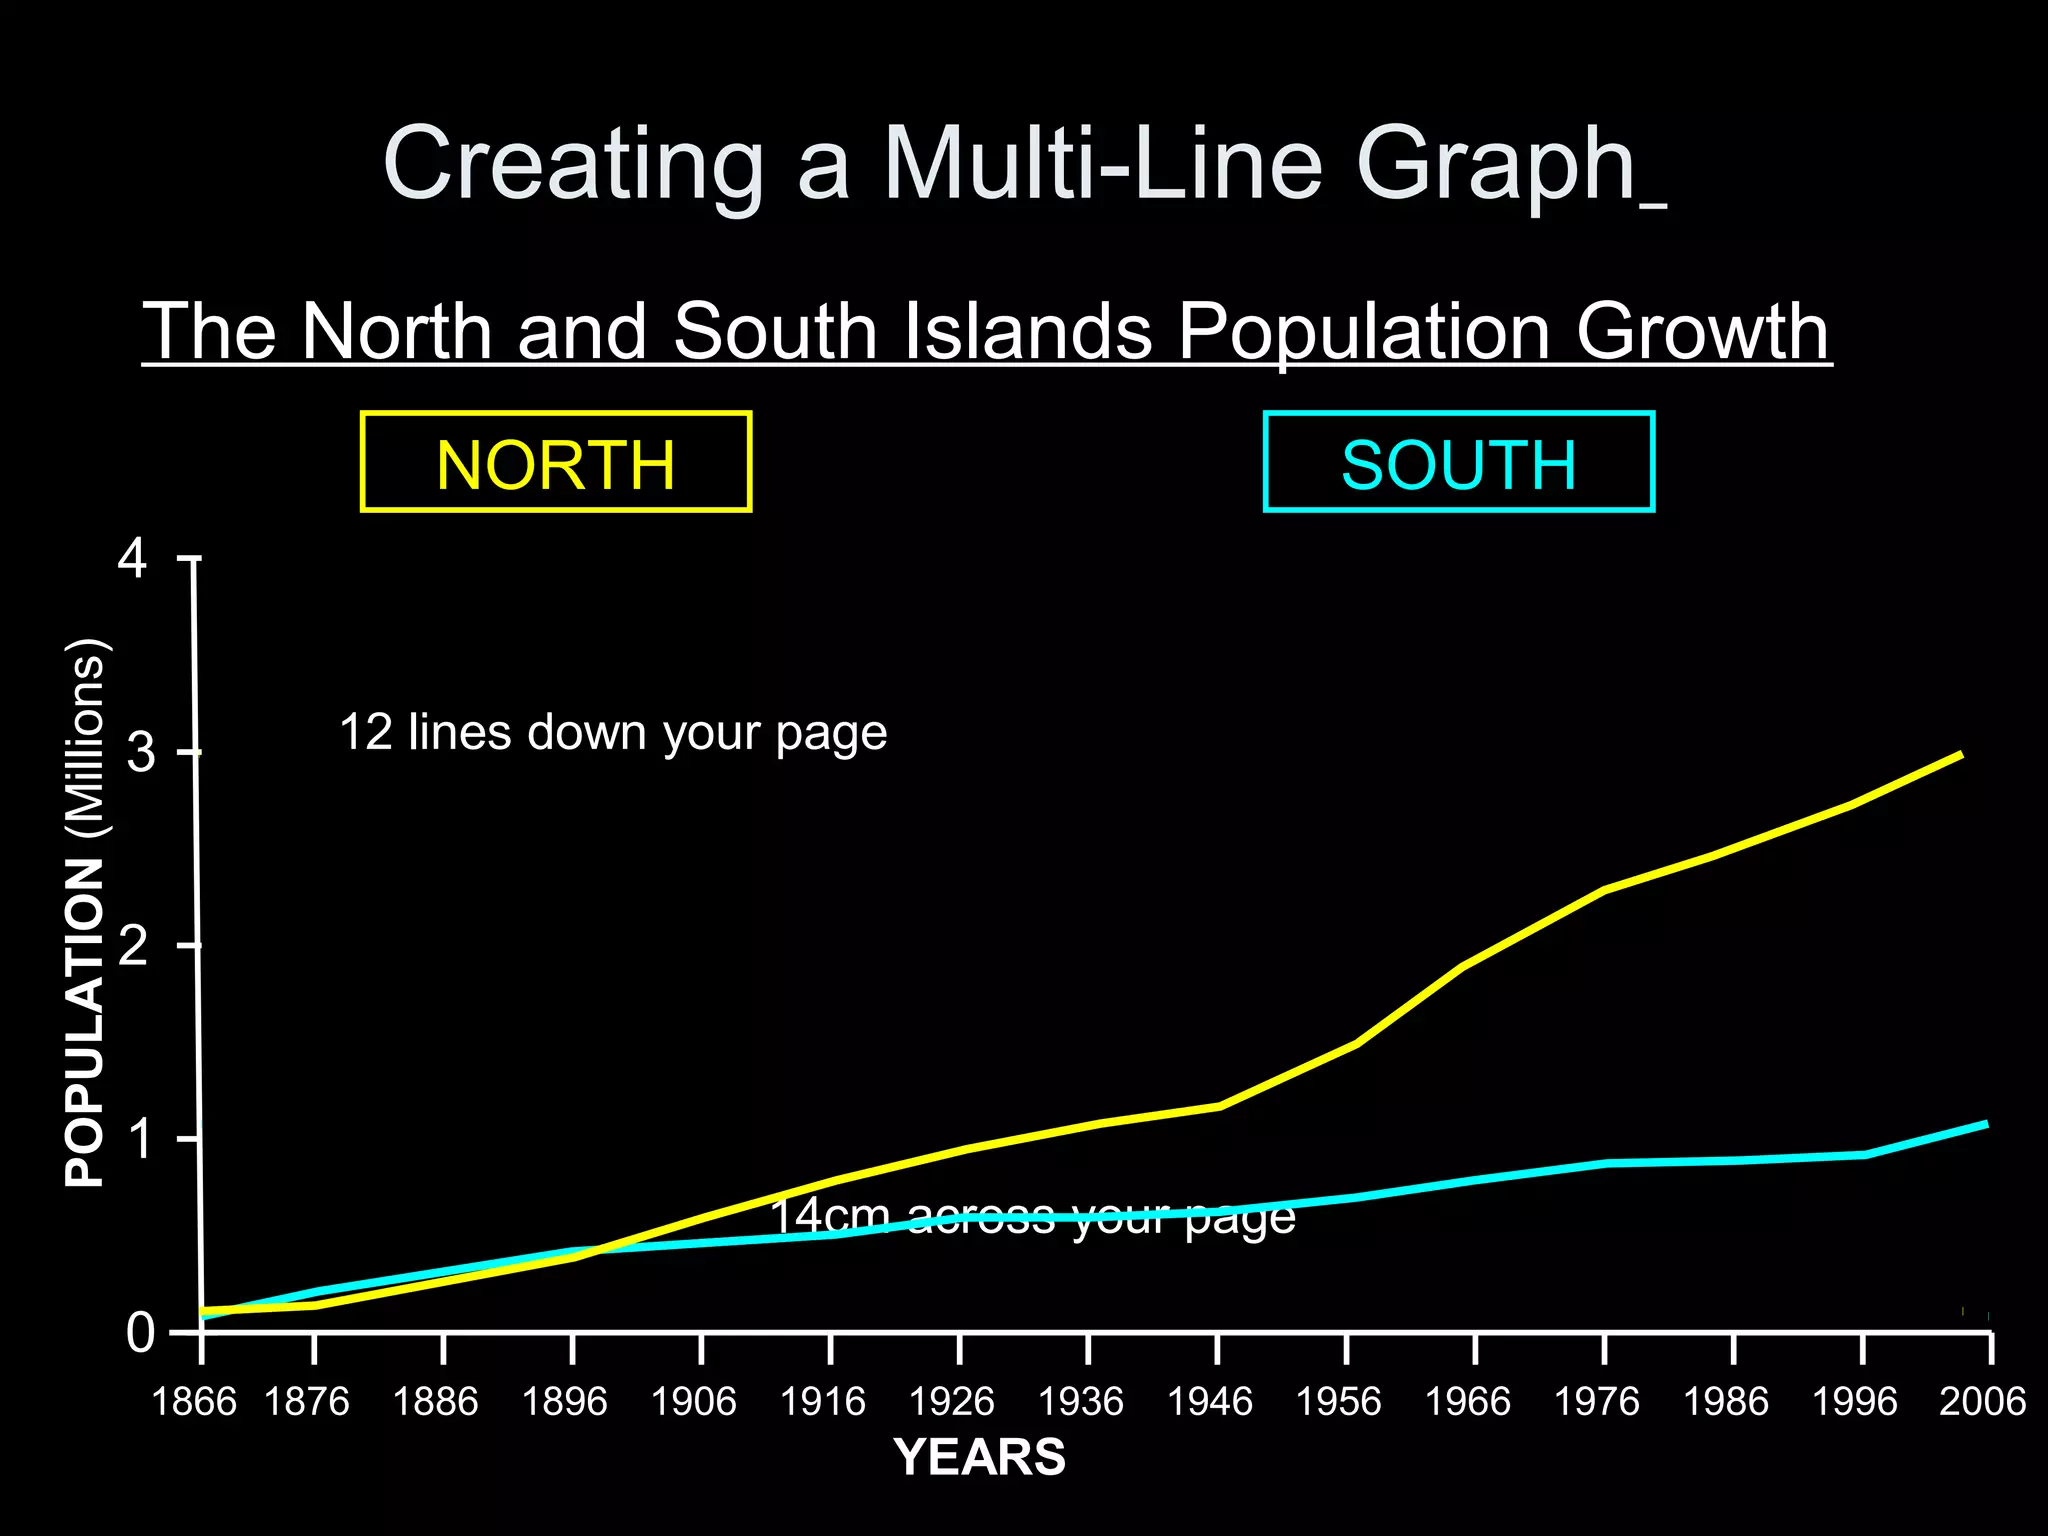
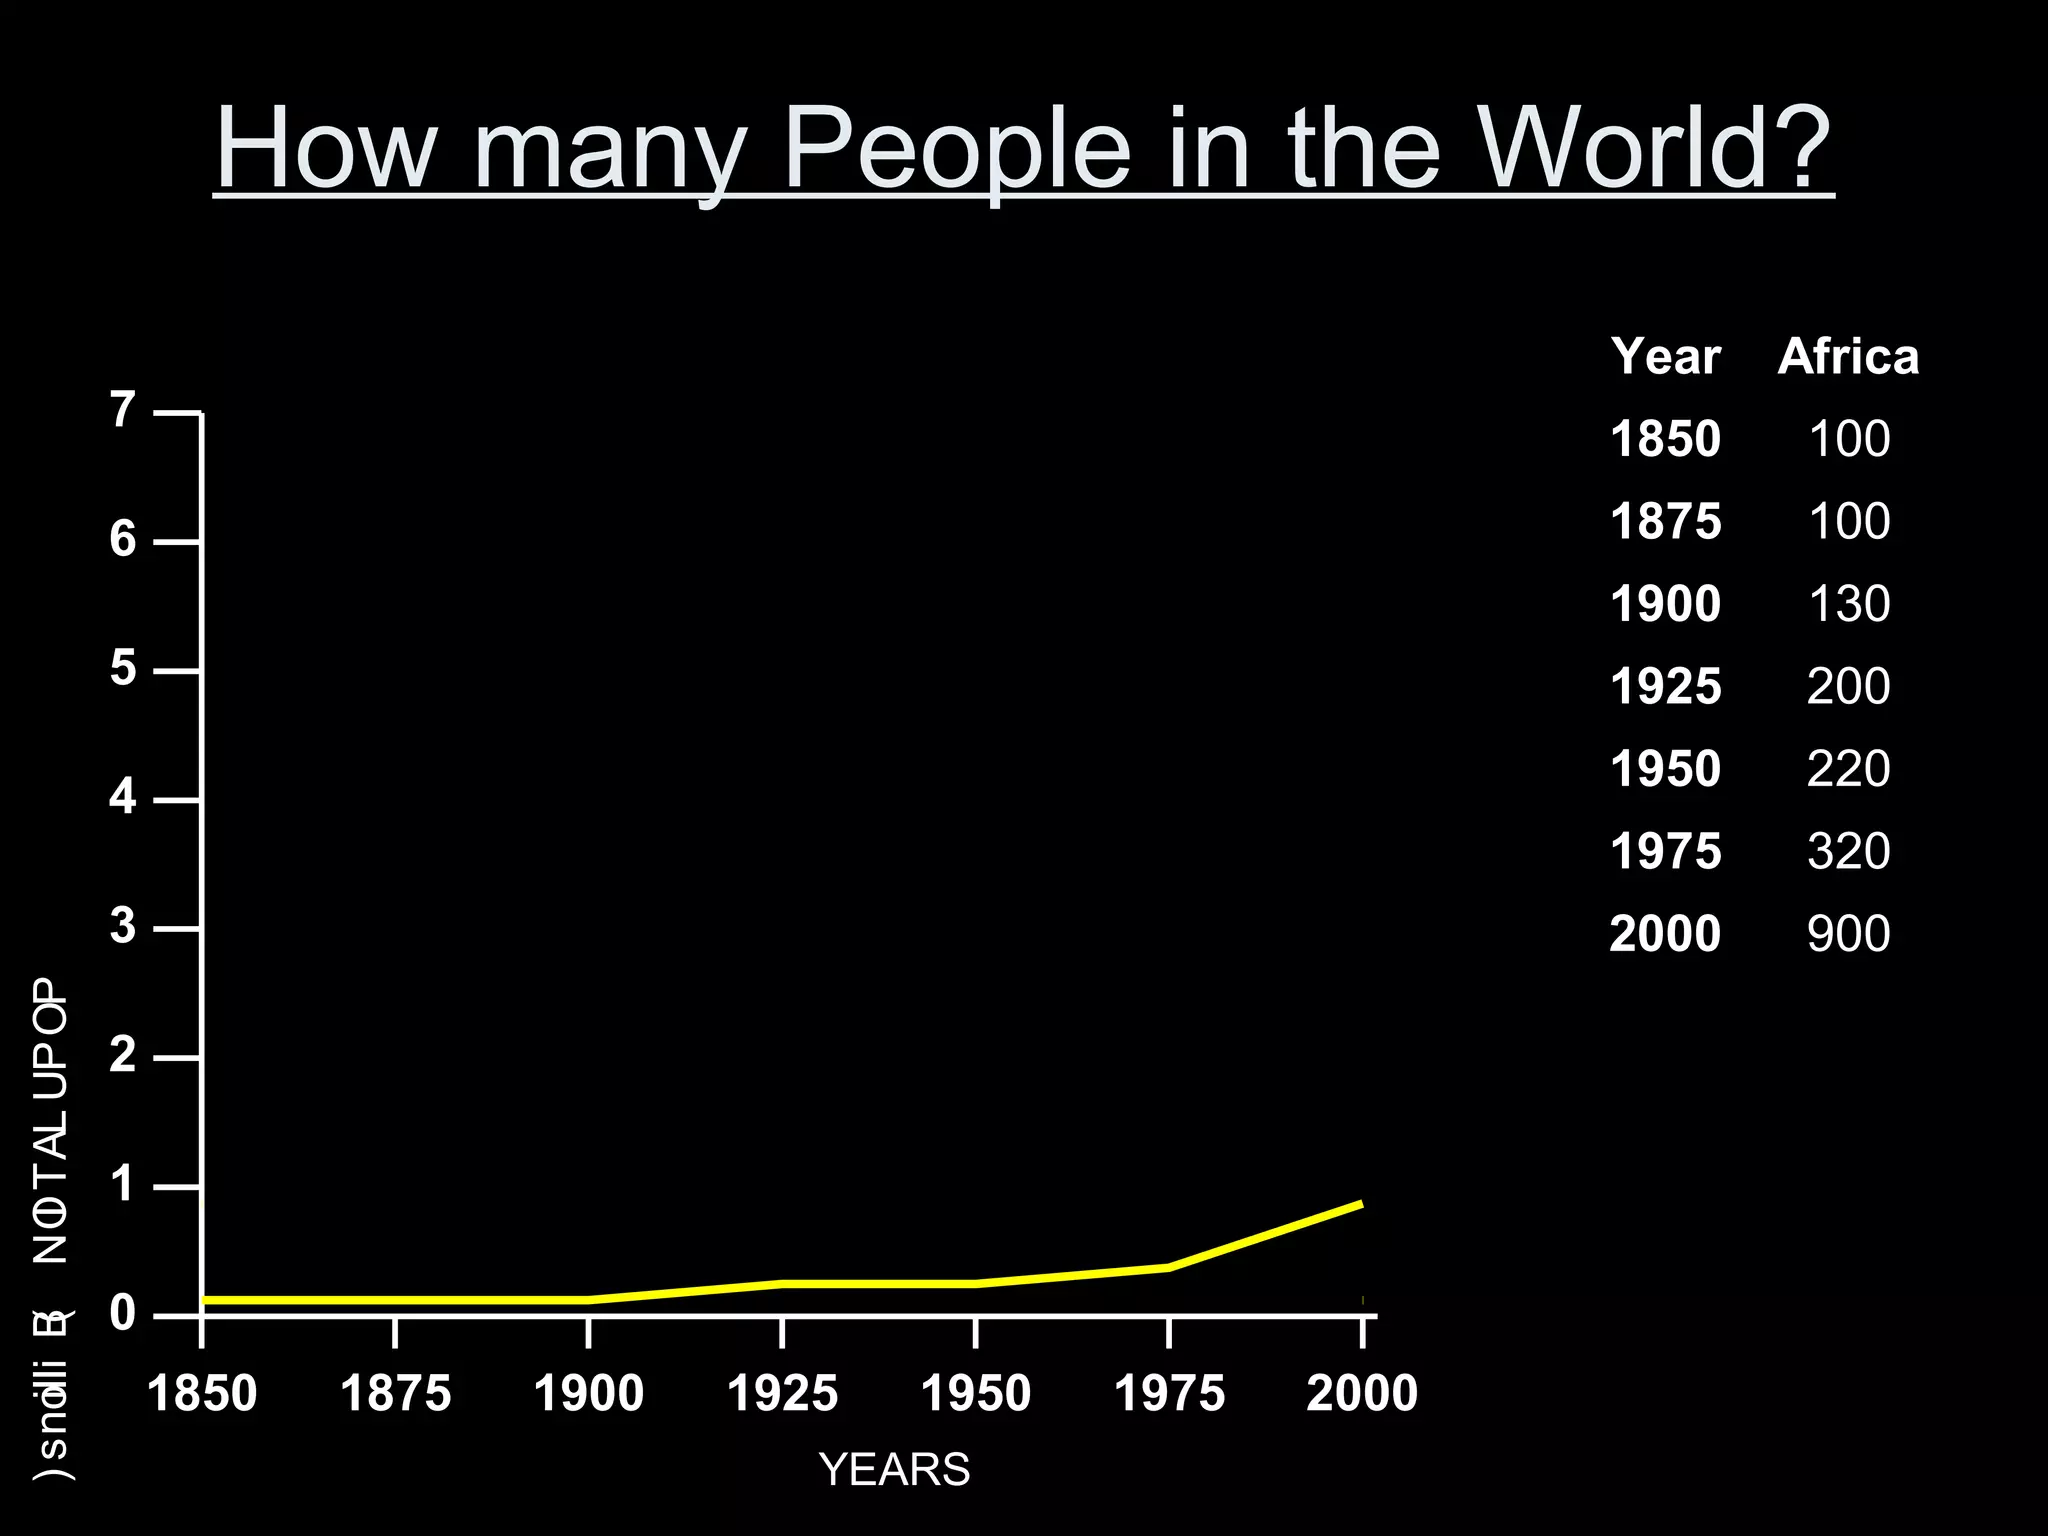
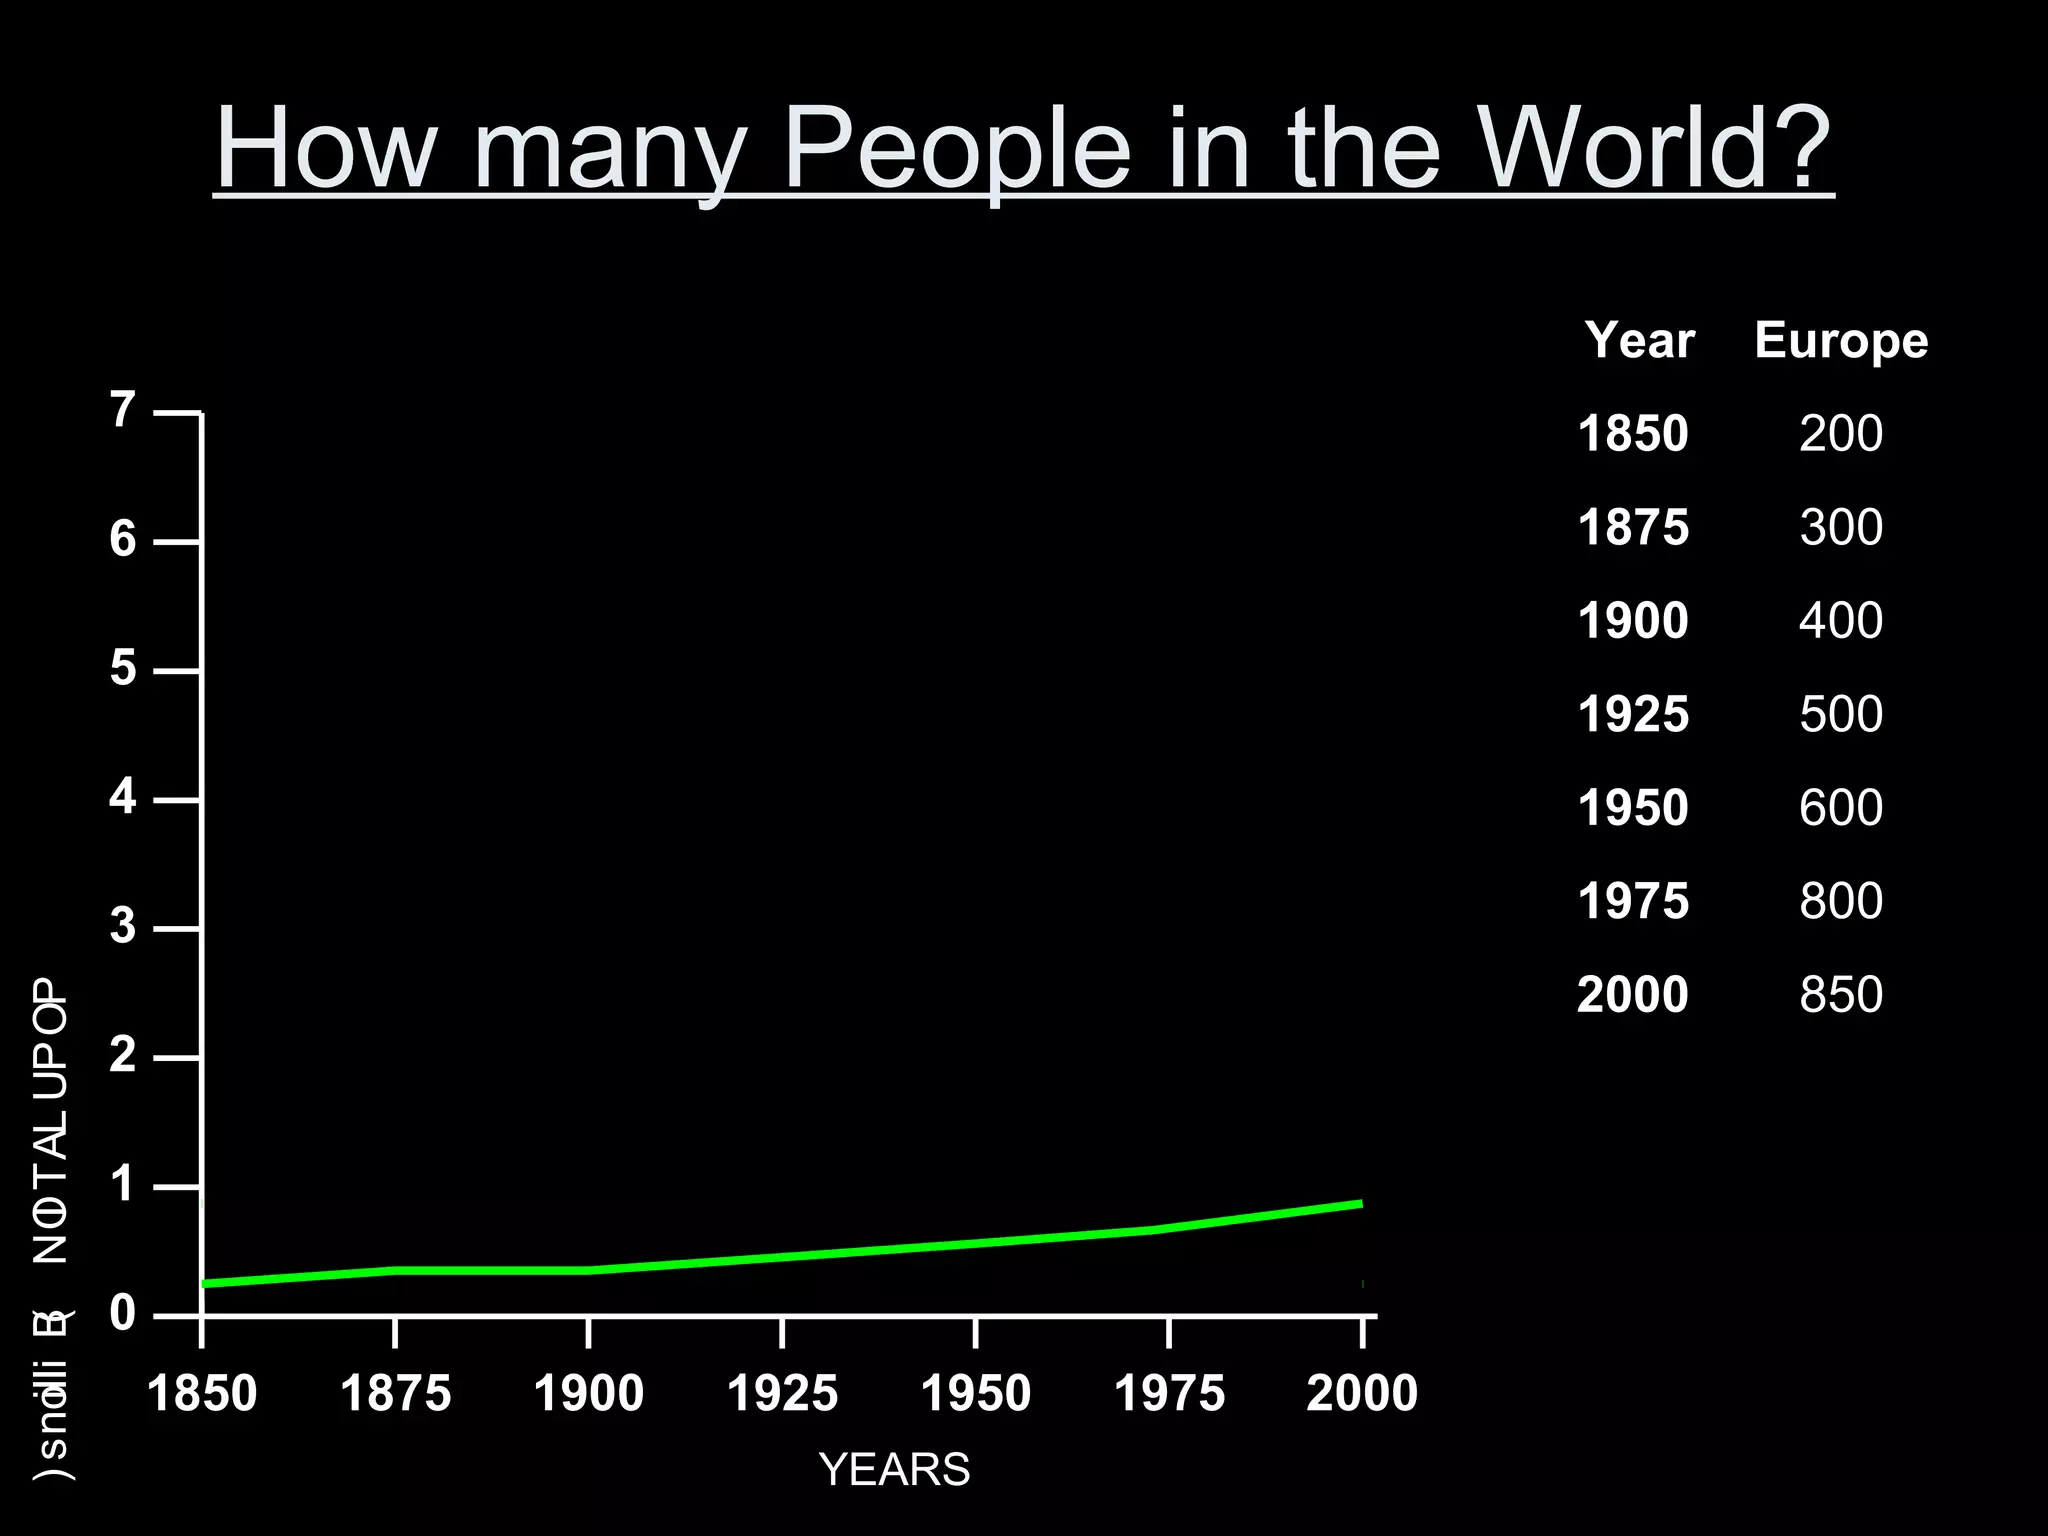
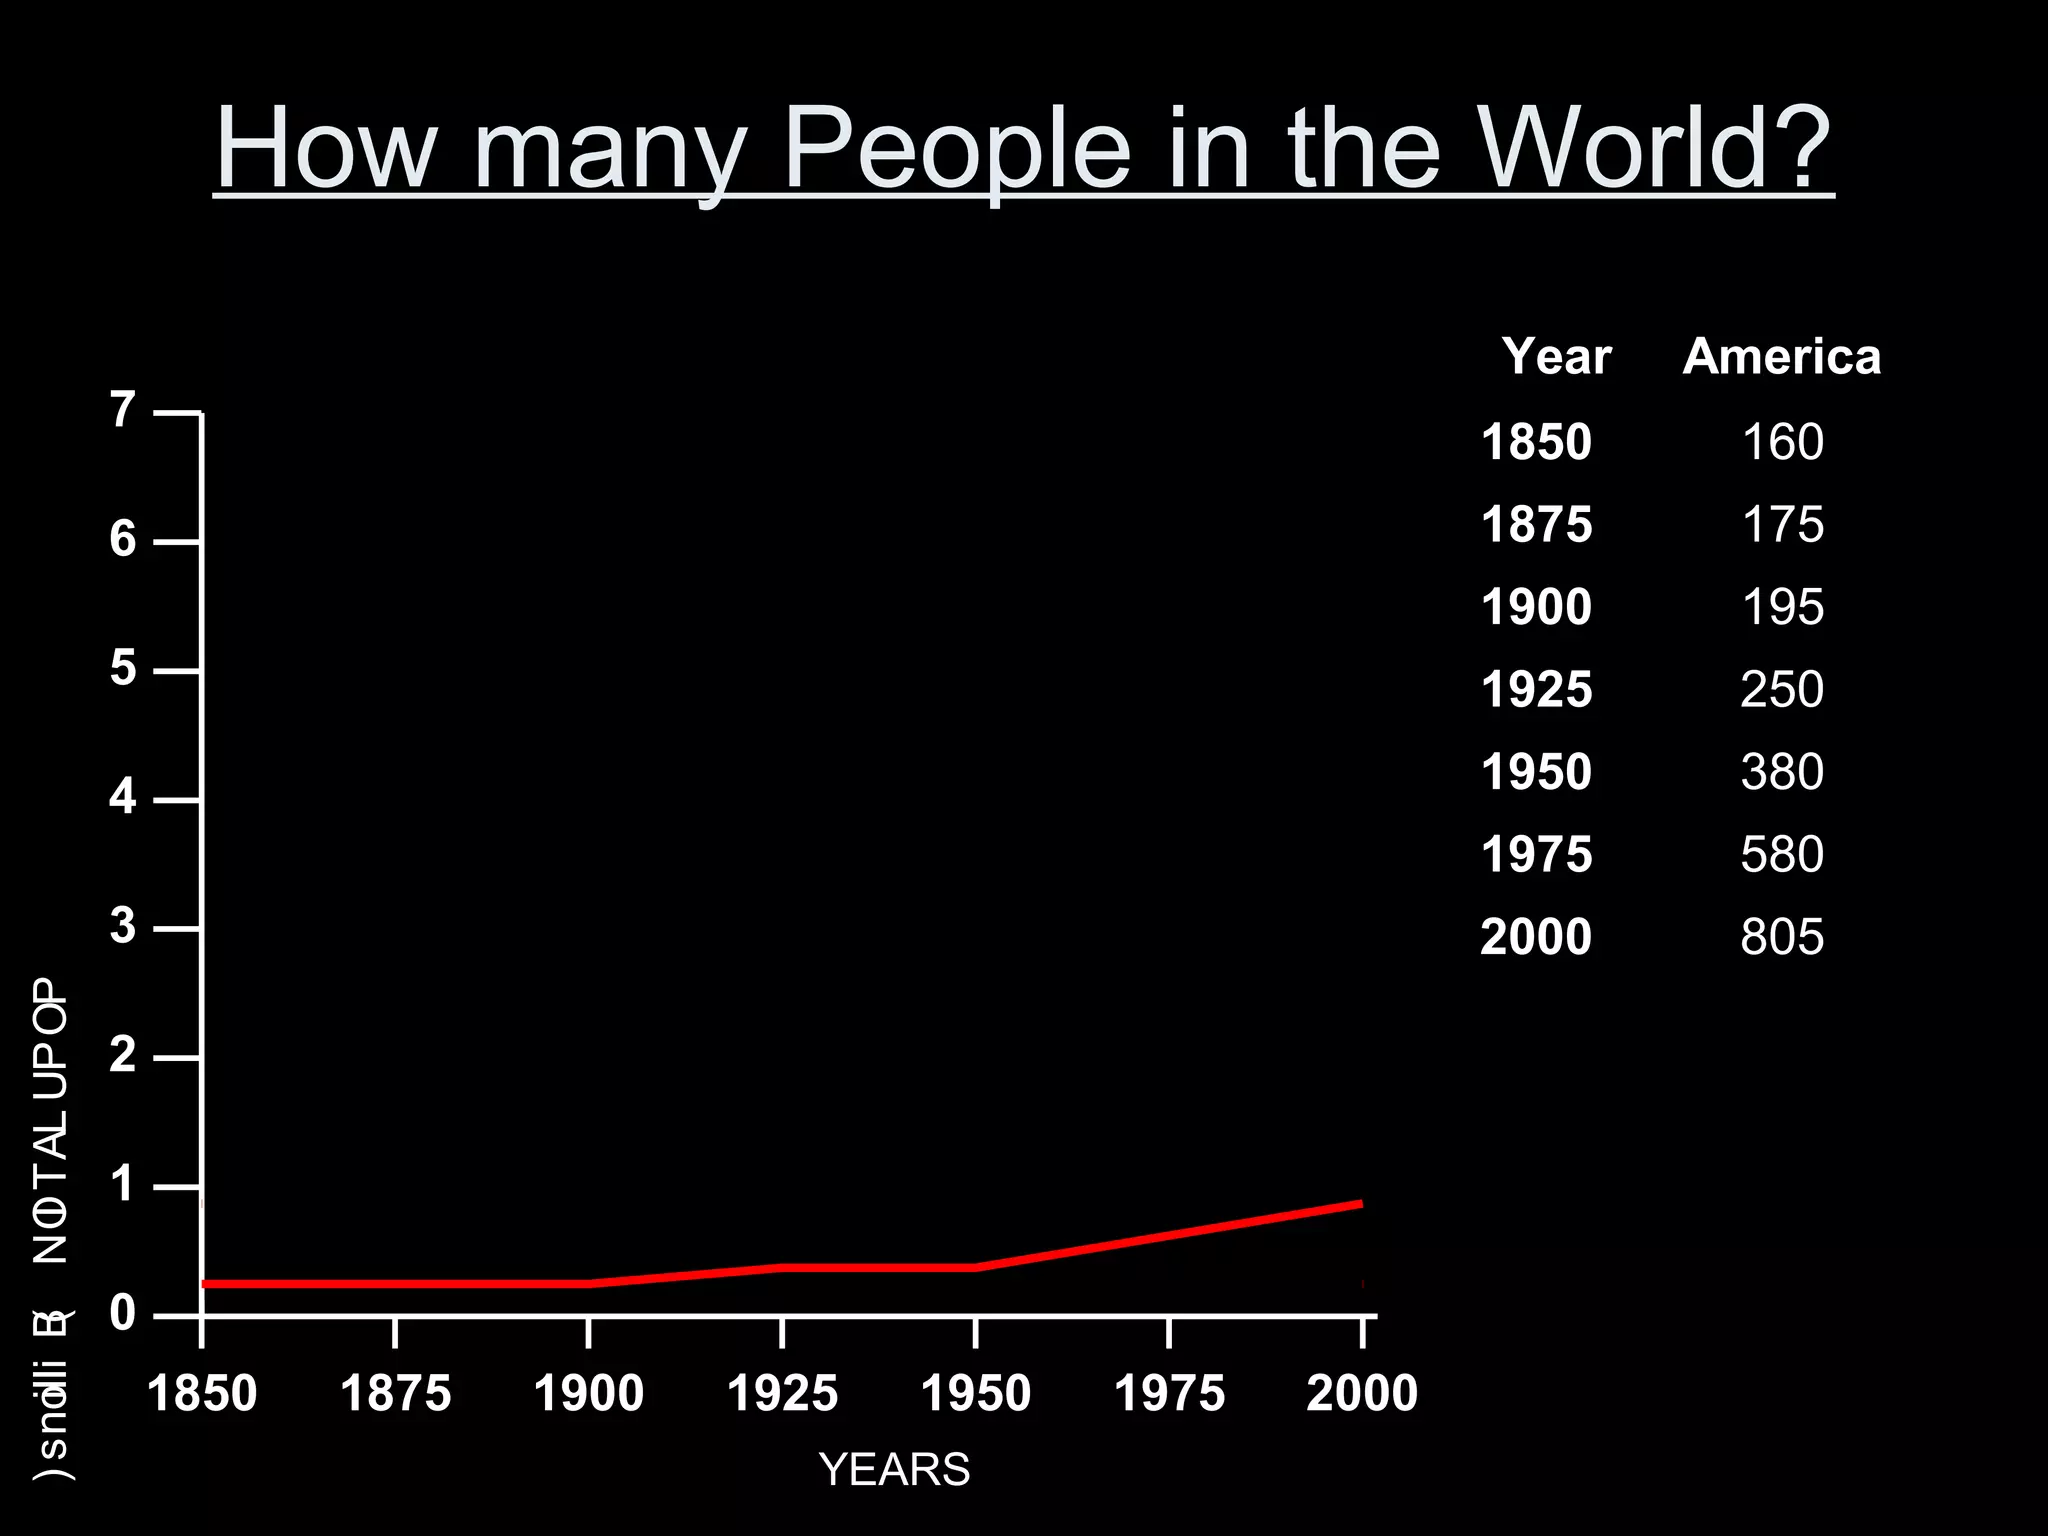
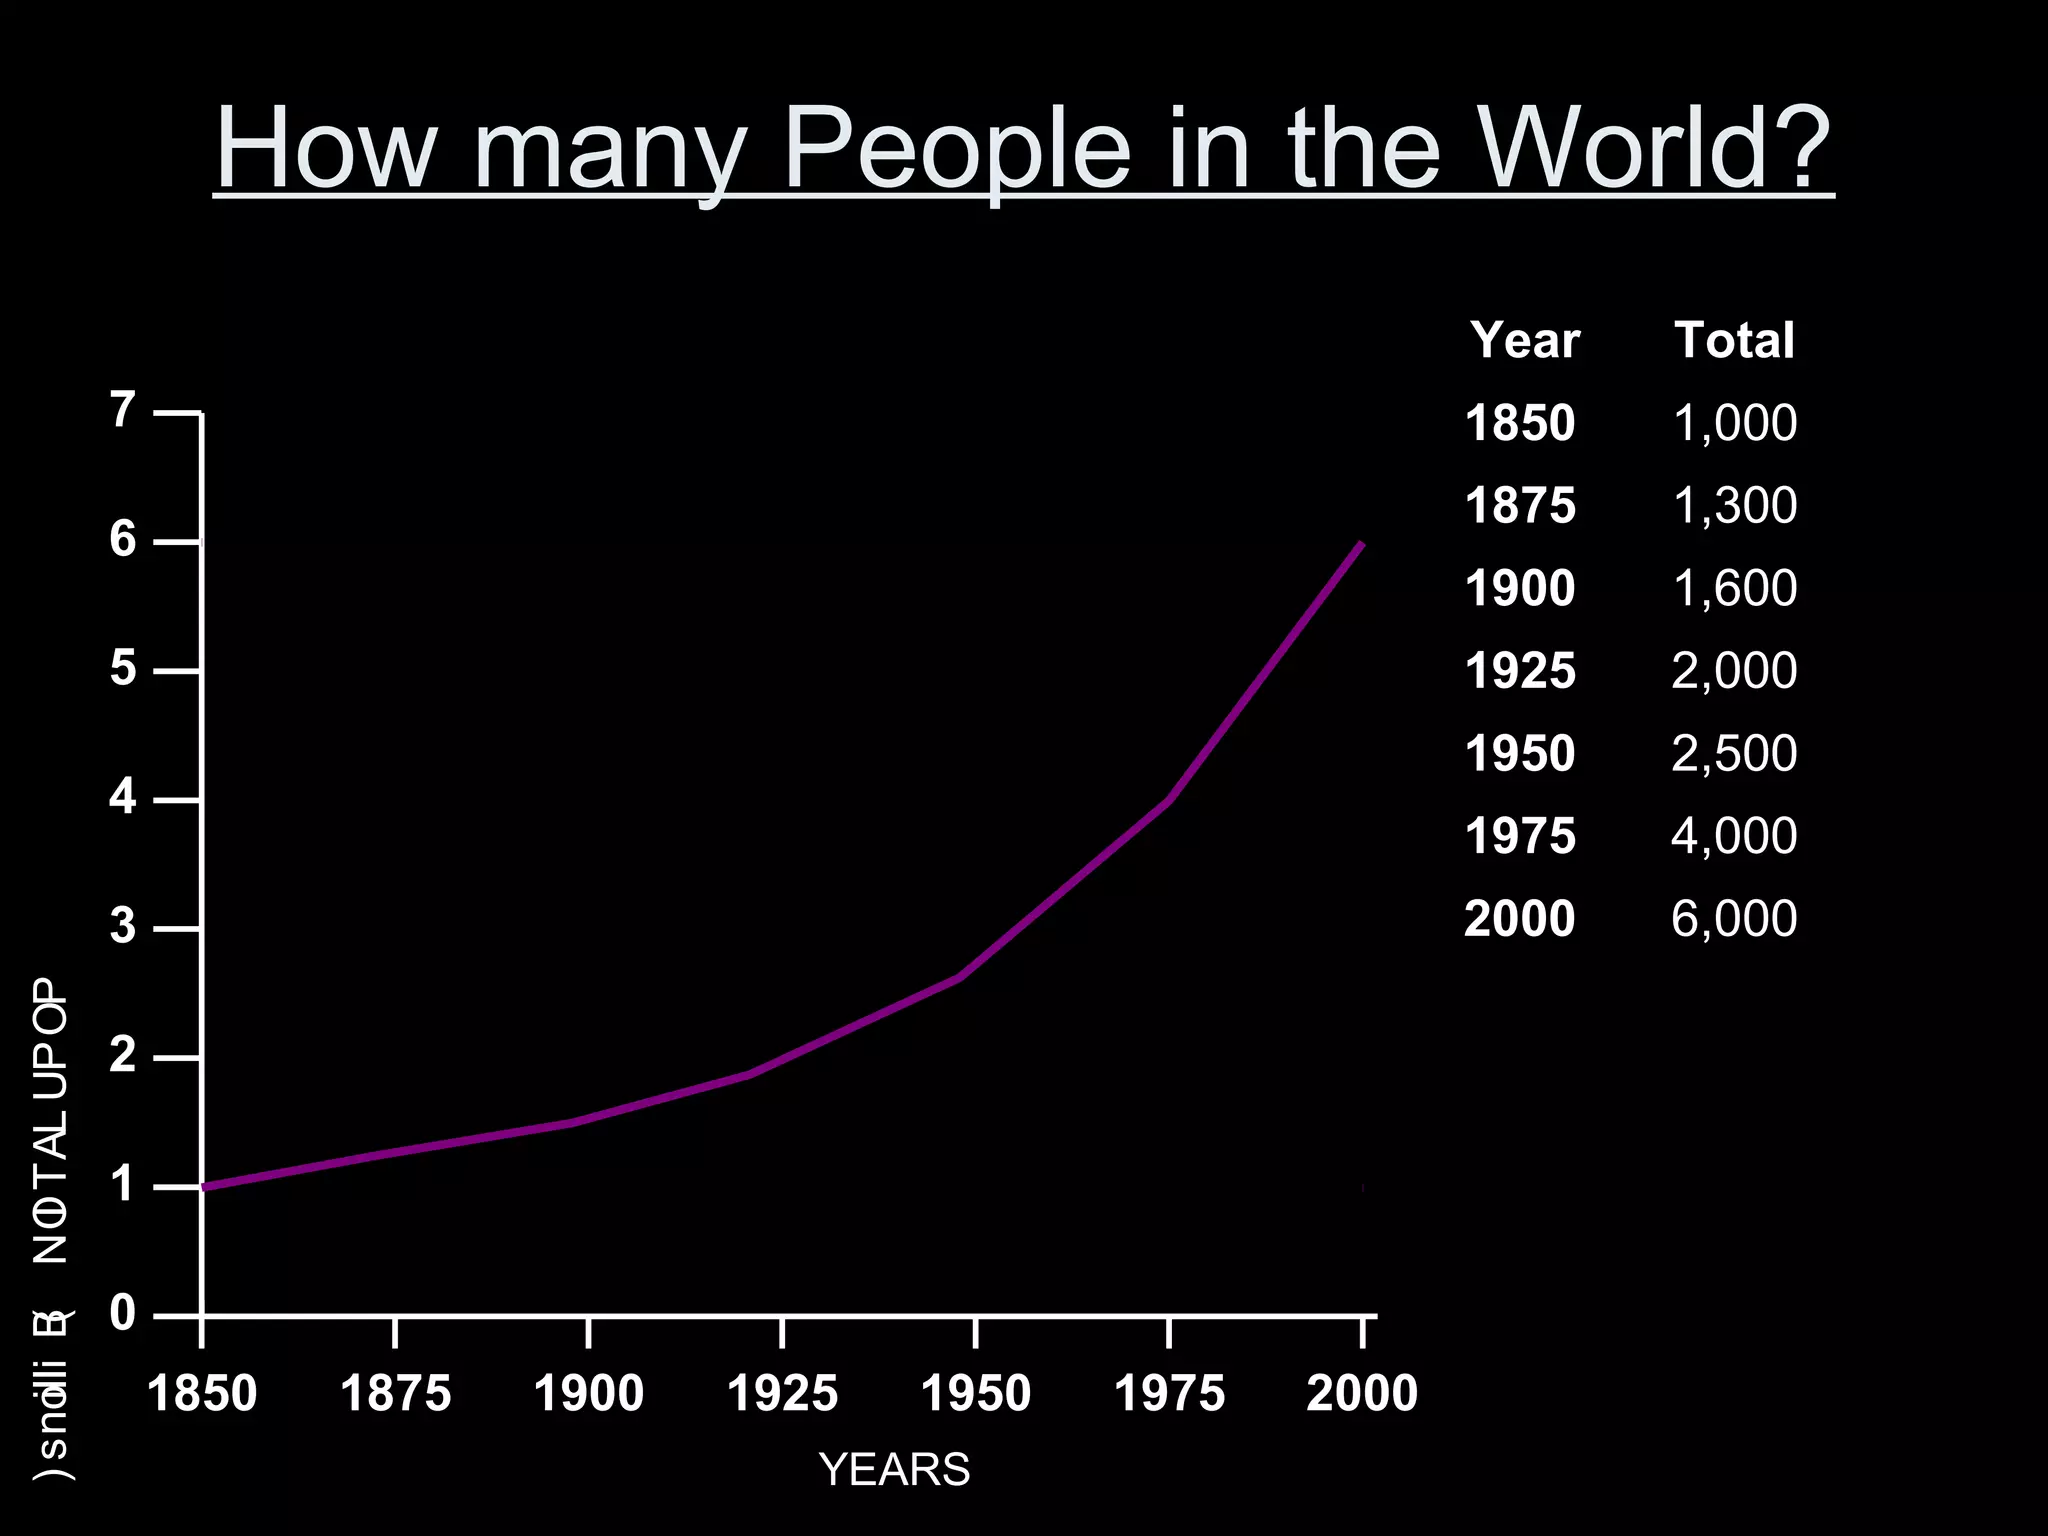
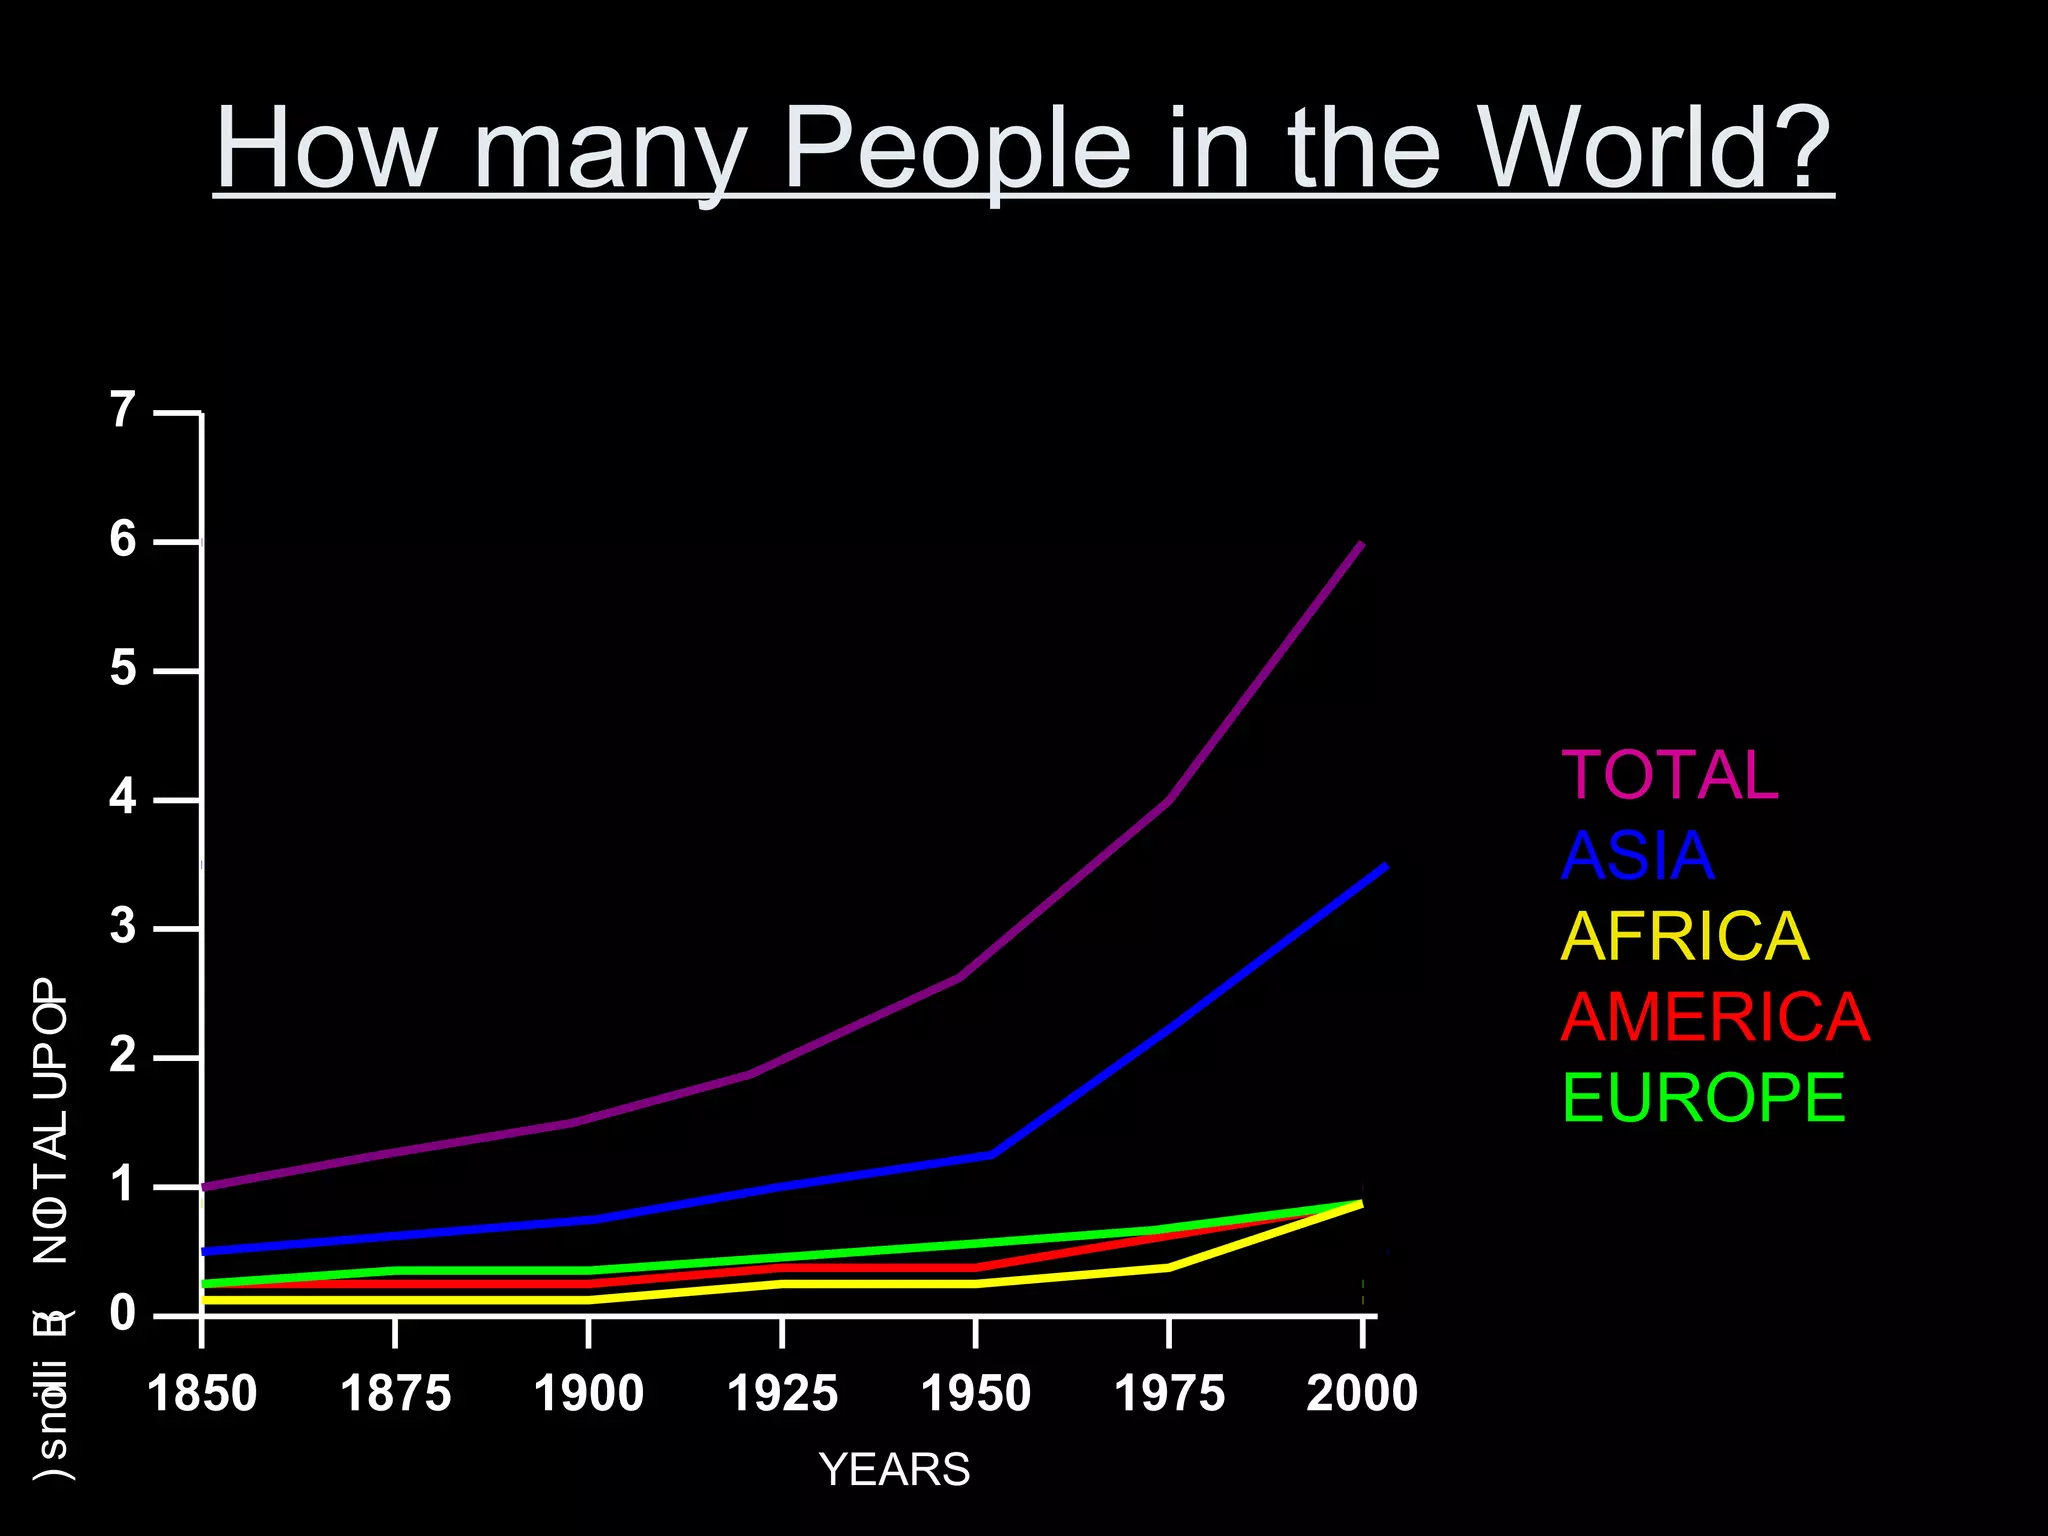


The document provides instructions for creating and analyzing multi-line graphs. It explains that multi-line graphs share key features with bar graphs, such as titles, labeled axes, and equal spacing. The main differences are that horizontal labels are placed on data points rather than between them on a multi-line graph, and a key is needed. Steps are provided for creating a sample multi-line graph tracking population growth in New Zealand over time. Learners are then asked to create their own multi-line graph and analyze world population data from 1850 to 2000 broken down by region.


