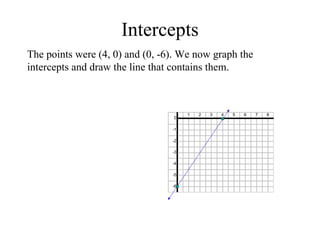
The document discusses intercepts in linear equations. It defines an x-intercept as the x-coordinate where the graph of the linear equation crosses the x-axis. The y-intercept is defined as the y-coordinate where the graph crosses the y-axis. To find the intercepts of a linear equation, set y=0 and solve for x to find the x-intercept, or set x=0 and solve for y to find the y-intercept. An example finds the intercepts of y=3/2x - 6 by setting each variable equal to 0 and solving, finding the x-intercept to be 4 and the y-intercept to be -6.
This is your introduction to domain, range, and functions. You will learn more about domain, range, functions, relations, x-values, and y-values. There are definitions and explanations of each concepts. There are questions to help quiz yourself. Test your abilities. Enjoy.
On The Number of Representations of a Positive Integer By Certain Binary Quad...IJERA Editor
It is well known how to find the formulae for the number of representations of positive integers by the positive
binary quadratic forms which belong to one-class genera. In this paper we obtain the formulae for the number of
representations by certain binary forms with discriminants –80 and –128 belonging to the genera having two
classes.
The technologies and people we are designing experiences for are constantly changing, in most cases they are changing at a rate that is difficult keep up with. When we think about how our teams are structured and the design processes we use in light of this challenge, a new design problem (or problem space) emerges, one that requires us to focus inward. How do we structure our teams and processes to be resilient? What would happen if we looked at our teams and design process as IA’s, Designers, Researchers? What strategies would we put in place to help them be successful? This talk will look at challenges we face leading, supporting, or simply being a part of design teams creating experiences for user groups with changing technological needs.
Investigate how to find the gradient of a line given two coordinates
Starter questions on first slide of PowerPoint.
Go through the lesson objective and outcomes with the class then ask students to complete the worksheet plotting coordinates. Tell the class they have 2-3 minutes to do this. The task is to recap on plotting coordinates and iron out any misconceptions. Ask pupils to have a think about what is the same and what is different about these triangles. Ask which quadrant each triangle is in and if any lines are parallel or perpendicular. Ask pupils to show how many triangles they drew correctly by number of fingers.
10-15 mins - Go through slides 9-12 explaining gradient then pupils do the question shown on slide 13 (mini-whiteboards). Give out worksheets while pupils are doing this so they can move onto that when they finish question on the board. Pupils swap papers and mark. Ask for hands up who got one/two/three/four/five answers correct. Ask pupils what is the same and what is different about these lines emphasising negative/positive gradient. Extension worksheets prepared for anyone that finishes.
10-15 mins – Go through slides 16-17 then ask pupils to do the next two questions on laminated grid (whiteboard).
Mathematics (from Greek μάθημα máthēma, “knowledge, study, learning”) is the study of topics such as quantity (numbers), structure, space, and change. There is a range of views among mathematicians and philosophers as to the exact scope and definition of mathematics
UiPath Test Automation using UiPath Test Suite series, part 3DianaGray10
Welcome to UiPath Test Automation using UiPath Test Suite series part 3. In this session, we will cover desktop automation along with UI automation.
Topics covered:
UI automation Introduction,
UI automation Sample
Desktop automation flow
Pradeep Chinnala, Senior Consultant Automation Developer @WonderBotz and UiPath MVP
Deepak Rai, Automation Practice Lead, Boundaryless Group and UiPath MVP
Search and Society: Reimagining Information Access for Radical FuturesBhaskar Mitra
The field of Information retrieval (IR) is currently undergoing a transformative shift, at least partly due to the emerging applications of generative AI to information access. In this talk, we will deliberate on the sociotechnical implications of generative AI for information access. We will argue that there is both a critical necessity and an exciting opportunity for the IR community to re-center our research agendas on societal needs while dismantling the artificial separation between the work on fairness, accountability, transparency, and ethics in IR and the rest of IR research. Instead of adopting a reactionary strategy of trying to mitigate potential social harms from emerging technologies, the community should aim to proactively set the research agenda for the kinds of systems we should build inspired by diverse explicitly stated sociotechnical imaginaries. The sociotechnical imaginaries that underpin the design and development of information access technologies needs to be explicitly articulated, and we need to develop theories of change in context of these diverse perspectives. Our guiding future imaginaries must be informed by other academic fields, such as democratic theory and critical theory, and should be co-developed with social science scholars, legal scholars, civil rights and social justice activists, and artists, among others.
GDG Cloud Southlake #33: Boule & Rebala: Effective AppSec in SDLC using Deplo...James Anderson
Effective Application Security in Software Delivery lifecycle using Deployment Firewall and DBOM
The modern software delivery process (or the CI/CD process) includes many tools, distributed teams, open-source code, and cloud platforms. Constant focus on speed to release software to market, along with the traditional slow and manual security checks has caused gaps in continuous security as an important piece in the software supply chain. Today organizations feel more susceptible to external and internal cyber threats due to the vast attack surface in their applications supply chain and the lack of end-to-end governance and risk management.
The software team must secure its software delivery process to avoid vulnerability and security breaches. This needs to be achieved with existing tool chains and without extensive rework of the delivery processes. This talk will present strategies and techniques for providing visibility into the true risk of the existing vulnerabilities, preventing the introduction of security issues in the software, resolving vulnerabilities in production environments quickly, and capturing the deployment bill of materials (DBOM).
Speakers:
Bob Boule
Robert Boule is a technology enthusiast with PASSION for technology and making things work along with a knack for helping others understand how things work. He comes with around 20 years of solution engineering experience in application security, software continuous delivery, and SaaS platforms. He is known for his dynamic presentations in CI/CD and application security integrated in software delivery lifecycle.
Gopinath Rebala
Gopinath Rebala is the CTO of OpsMx, where he has overall responsibility for the machine learning and data processing architectures for Secure Software Delivery. Gopi also has a strong connection with our customers, leading design and architecture for strategic implementations. Gopi is a frequent speaker and well-known leader in continuous delivery and integrating security into software delivery.
JMeter webinar - integration with InfluxDB and GrafanaRTTS
Watch this recorded webinar about real-time monitoring of application performance. See how to integrate Apache JMeter, the open-source leader in performance testing, with InfluxDB, the open-source time-series database, and Grafana, the open-source analytics and visualization application.
In this webinar, we will review the benefits of leveraging InfluxDB and Grafana when executing load tests and demonstrate how these tools are used to visualize performance metrics.
Length: 30 minutes
Session Overview
-------------------------------------------
During this webinar, we will cover the following topics while demonstrating the integrations of JMeter, InfluxDB and Grafana:
- What out-of-the-box solutions are available for real-time monitoring JMeter tests?
- What are the benefits of integrating InfluxDB and Grafana into the load testing stack?
- Which features are provided by Grafana?
- Demonstration of InfluxDB and Grafana using a practice web application
To view the webinar recording, go to:
https://www.rttsweb.com/jmeter-integration-webinar
Key Trends Shaping the Future of Infrastructure.pdfCheryl Hung
Keynote at DIGIT West Expo, Glasgow on 29 May 2024.
Cheryl Hung, ochery.com
Sr Director, Infrastructure Ecosystem, Arm.
The key trends across hardware, cloud and open-source; exploring how these areas are likely to mature and develop over the short and long-term, and then considering how organisations can position themselves to adapt and thrive.
Accelerate your Kubernetes clusters with Varnish CachingThijs Feryn
A presentation about the usage and availability of Varnish on Kubernetes. This talk explores the capabilities of Varnish caching and shows how to use the Varnish Helm chart to deploy it to Kubernetes.
This presentation was delivered at K8SUG Singapore. See https://feryn.eu/presentations/accelerate-your-kubernetes-clusters-with-varnish-caching-k8sug-singapore-28-2024 for more details.
Epistemic Interaction - tuning interfaces to provide information for AI supportAlan Dix
Paper presented at SYNERGY workshop at AVI 2024, Genoa, Italy. 3rd June 2024
https://alandix.com/academic/papers/synergy2024-epistemic/
As machine learning integrates deeper into human-computer interactions, the concept of epistemic interaction emerges, aiming to refine these interactions to enhance system adaptability. This approach encourages minor, intentional adjustments in user behaviour to enrich the data available for system learning. This paper introduces epistemic interaction within the context of human-system communication, illustrating how deliberate interaction design can improve system understanding and adaptation. Through concrete examples, we demonstrate the potential of epistemic interaction to significantly advance human-computer interaction by leveraging intuitive human communication strategies to inform system design and functionality, offering a novel pathway for enriching user-system engagements.
State of ICS and IoT Cyber Threat Landscape Report 2024 previewPrayukth K V
The IoT and OT threat landscape report has been prepared by the Threat Research Team at Sectrio using data from Sectrio, cyber threat intelligence farming facilities spread across over 85 cities around the world. In addition, Sectrio also runs AI-based advanced threat and payload engagement facilities that serve as sinks to attract and engage sophisticated threat actors, and newer malware including new variants and latent threats that are at an earlier stage of development.
The latest edition of the OT/ICS and IoT security Threat Landscape Report 2024 also covers:
State of global ICS asset and network exposure
Sectoral targets and attacks as well as the cost of ransom
Global APT activity, AI usage, actor and tactic profiles, and implications
Rise in volumes of AI-powered cyberattacks
Major cyber events in 2024
Malware and malicious payload trends
Cyberattack types and targets
Vulnerability exploit attempts on CVEs
Attacks on counties – USA
Expansion of bot farms – how, where, and why
In-depth analysis of the cyber threat landscape across North America, South America, Europe, APAC, and the Middle East
Why are attacks on smart factories rising?
Cyber risk predictions
Axis of attacks – Europe
Systemic attacks in the Middle East
Download the full report from here:
https://sectrio.com/resources/ot-threat-landscape-reports/sectrio-releases-ot-ics-and-iot-security-threat-landscape-report-2024/
DevOps and Testing slides at DASA ConnectKari Kakkonen
My and Rik Marselis slides at 30.5.2024 DASA Connect conference. We discuss about what is testing, then what is agile testing and finally what is Testing in DevOps. Finally we had lovely workshop with the participants trying to find out different ways to think about quality and testing in different parts of the DevOps infinity loop.
Smart TV Buyer Insights Survey 2024 by 91mobiles.pdf91mobiles
91mobiles recently conducted a Smart TV Buyer Insights Survey in which we asked over 3,000 respondents about the TV they own, aspects they look at on a new TV, and their TV buying preferences.
2. 5-Minute Check
Find the slope of the line that contains each pair of points.
1. C(-4, -2), D(5, 3)
3. 5-Minute Check
Find the slope of the line that contains each pair of points.
1. C(-4, -2), D(5, 3) 5/9
4. 5-Minute Check
Find the slope of the line that contains each pair of points.
1. C(-4, -2), D(5, 3) 5/9
2. H(1, 4), S(5, -2)
5. 5-Minute Check
Find the slope of the line that contains each pair of points.
1. C(-4, -2), D(5, 3) 5/9
2. H(1, 4), S(5, -2) -3/2
6. 5-Minute Check
Find the slope of the line that contains each pair of points.
1. C(-4, -2), D(5, 3) 5/9
2. H(1, 4), S(5, -2) -3/2
3. G(0, 7), B(2, -7)
7. 5-Minute Check
Find the slope of the line that contains each pair of points.
1. C(-4, -2), D(5, 3) 5/9
2. H(1, 4), S(5, -2) -3/2
3. G(0, 7), B(2, -7) -7
8. 5-Minute Check
Find the slope of the line that contains each pair of points.
1. C(-4, -2), D(5, 3) 5/9
2. H(1, 4), S(5, -2) -3/2
3. G(0, 7), B(2, -7) -7
4. J(0, 0), W(4, -4)
9. 5-Minute Check
Find the slope of the line that contains each pair of points.
1. C(-4, -2), D(5, 3) 5/9
2. H(1, 4), S(5, -2) -3/2
3. G(0, 7), B(2, -7) -7
4. J(0, 0), W(4, -4) -1
10. 5-Minute Check
Find the slope of the line that contains each pair of points.
1. C(-4, -2), D(5, 3) 5/9
2. H(1, 4), S(5, -2) -3/2
3. G(0, 7), B(2, -7) -7
4. J(0, 0), W(4, -4) -1
5. R(-4, -4), F(-5, -3)
11. 5-Minute Check
Find the slope of the line that contains each pair of points.
1. C(-4, -2), D(5, 3) 5/9
2. H(1, 4), S(5, -2) -3/2
3. G(0, 7), B(2, -7) -7
4. J(0, 0), W(4, -4) -1
5. R(-4, -4), F(-5, -3) -1
13. Intercepts
Learning the Concept
The graph of a linear function may cross either the x-
axis, the y-axis, or both axes.
The x-intercept is the x-coordinate of the point
where the graph crosses the x-axis.
The y-intercept is the y-coordinate of the point
where the graph crosses the y-axis.
14. Intercepts
The line graphed below crosses both axes.
x-intercept The line graphed crosses the 6
x-axis at (5, 0). Therefore the 5
x-intercept is 5. Note that the 4
corresponding y-coordinate is 0. 3 y-intercept
2
y-intercept The line crosses the y-axis at 1
0
(0, 2). So the y-intercept is 2. 1 2 3 4 5 6
Note that the corresponding x-intercept
x-coordinate is 0.
15. Intercepts
From the previous slide, we learned that the y-
coordinate for the point of the x-intercept is 0.
We also learned that the x-coordinate for the point of
the y-intercept is 0.
So, to solve for the x-intercept for an equation, we
let the y-value be 0 and then solve for x.
Also to solve for the y-intercept for an equation, we
let the x-value be 0 and then solve for y.
16. Intercepts
Example 1
Find the x-intercept and y-intercept for y = 3/2x – 6.
Then graph the equation using the x- and y-intercepts.
x-intercept: y-intercept:
y = 3/2x – 6 y = 3/2x – 6
0 = 3/2x – 6 y = 3/2*0 – 6
0 + 6 = 3/2x – 6 + 6 y= –6
6 = 3/2x
6*2/3 = 3/2*2/3x
4=x The y-intercept is -6.
The x-intercept is 4. The ordered pair is (0,-6).
The ordered pair is (4,0).
17. Intercepts
The points were (4, 0) and (0, -6). We now graph the
intercepts and draw the line that contains them.
1 2 3 4 5 6 7 8
0
-1
-2
-3
-4
-5
-6
18. Intercepts
The points were (4, 0) and (0, -6). We now graph the
intercepts and draw the line that contains them.
1 2 3 4 5 6 7 8
0
-1
-2
-3
-4
-5
-6
19. Intercepts
The points were (4, 0) and (0, -6). We now graph the
intercepts and draw the line that contains them.
1 2 3 4 5 6 7 8
0
-1
-2
-3
-4
-5
-6
20. Intercepts
The points were (4, 0) and (0, -6). We now graph the
intercepts and draw the line that contains them.
We can check our work by
selecting a point on the line, 0
1 2 3 4 5 6 7 8
(2,-3) to see if we are correct. -1
-2
y = 3/2x – 6
-3
– 3 = 3/2(2) – 6 -4
-5
–3=3–6 -6
–3=–3
21. Intercepts
If we already have a line on the graph, how will we be able to
determine the x- and y-intercepts?
22. Intercepts
If we already have a line on the graph, how will we be able to
determine the x- and y-intercepts?
What are the intercepts?
23. Intercepts
If we already have a line on the graph, how will we be able to
determine the x- and y-intercepts?
What is the slope
of this line?